Welcome to our Blog!
Updates, ideas, insights and tips from the ChartMill Team

Market Breadth Recovery Continues, but the Bigger Trend Still Needs Work
The market followed up Tuesday’s sharp rebound with another constructive session on Wednesday. Short-term breadth improved further and all three major index ETFs closed above their EMA9, but the broader backdrop remains fragile, with weak monthly breadth readings and still-unfavorable weekly trend signals for SPY and QQQ.

Nike's Brutal Reckoning and Trump's Murky Iran Script, Wall Street Refuses to Blink
Wednesday, April 1 was supposed to be the day investors got clarity. Instead, Nike handed them a gutting earnings miss while Trump delivered an Iran speech that confused as much as it comforted.
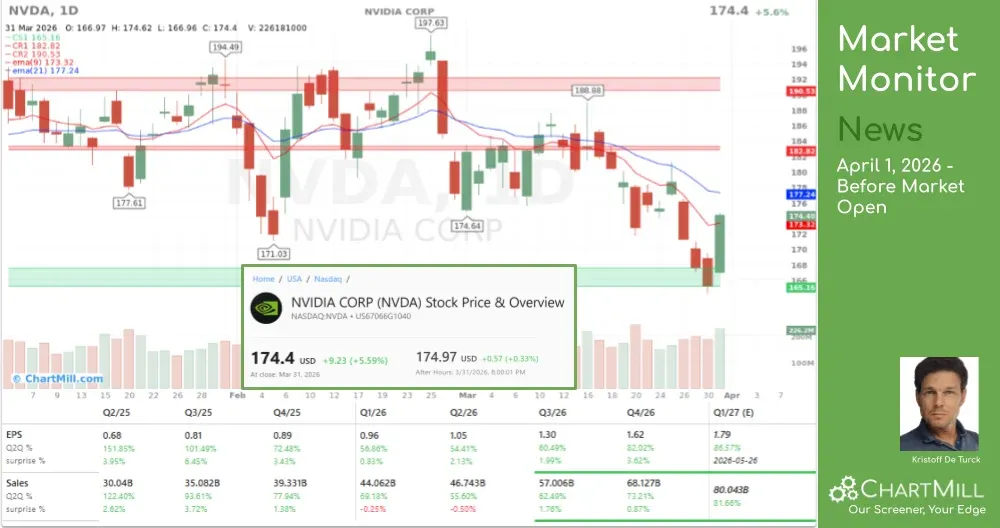
Breadth Rebounds Sharply, But Long-Term Trend Pressure Remains on SPY and QQQ
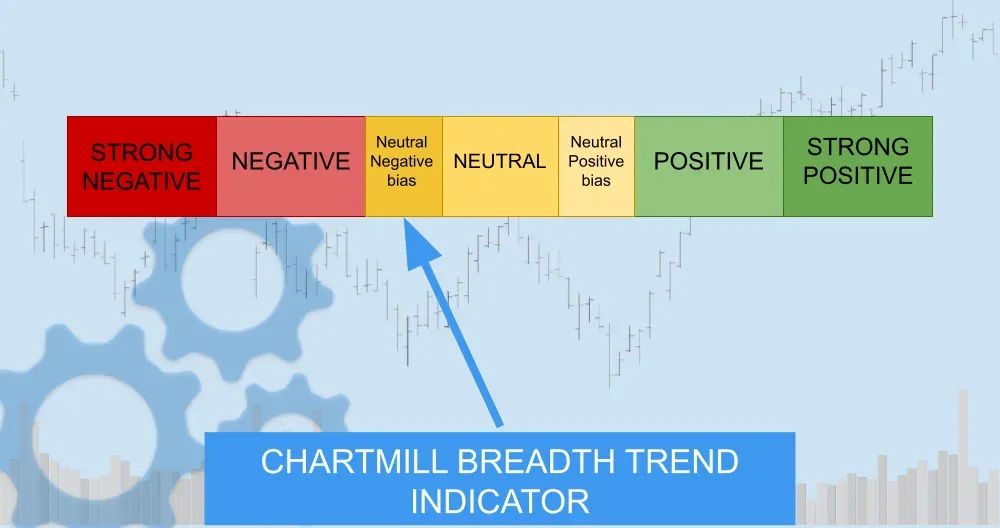
After several sessions of heavy internal deterioration, the market finally produced a strong upside breadth day on the latest dataset shown here, dated March 31, 2026. The rebound was broad and forceful, but most medium-term breadth measures still remain weak, which means this looks more like a relief rally inside a damaged market than a confirmed trend reversal.
Wall Street Ends a Rough Quarter With Its Best Day, Iran Hope Ignites the Rally
March 31 delivered the best single session for U.S. equities in nearly a year, as softening rhetoric from both Washington and Tehran raised real hopes that the five-week Iran war may finally be winding down.

Market Breadth Update: Selling Pressure Eases, but Internal Damage Keeps Building
Monday’s breadth data looked less extreme than Friday’s washout, but there was no real repair beneath the surface.
Chips Down, Ackman Up: How Iran, the Fed, and a Viral Post Defined Monday's Market
Wall Street started the week with a whimper as memory chipmakers extended their brutal selloff on AI efficiency fears, crude oil pushed past $102, and Jerome Powell chose patience over panic.
Market Breadth Breakdown Deepens as Weekly Downtrends Confirm
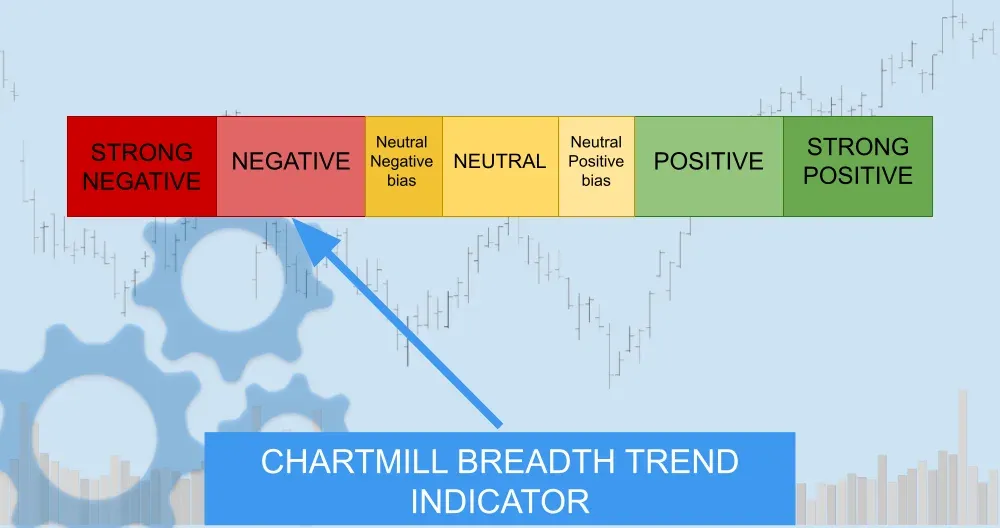
Friday’s data showed another clear distribution day, with decliners overwhelming advancers and already-weak intermediate-term breadth deteriorating further.
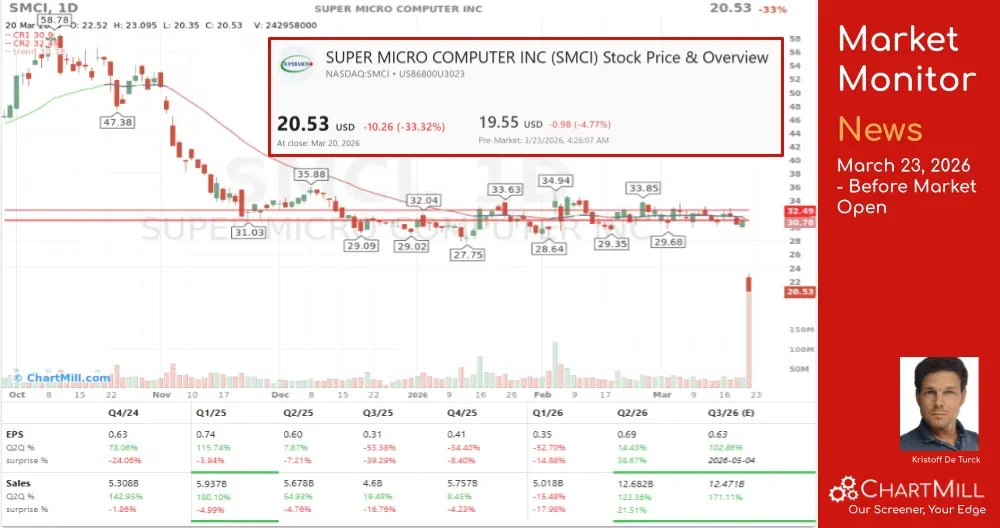
Oil, War, and a Leaked AI Model: Wall Street Can't Catch a Break
The Iran conflict tightens its grip on markets as the Dow joins the Nasdaq in correction territory, Meta reels from a double legal knockout, and a surprise AI data leak rattles the entire cybersecurity sector.
Failed Follow-Through Sends Breadth Back to the Lows
Wednesday’s rebound did not receive any confirmation on Thursday. Market breadth rolled over sharply again, daily participation collapsed, and both SPY and QQQ were pushed back into key support zones, confirming that the market remains in a fragile, distribution-driven environment.
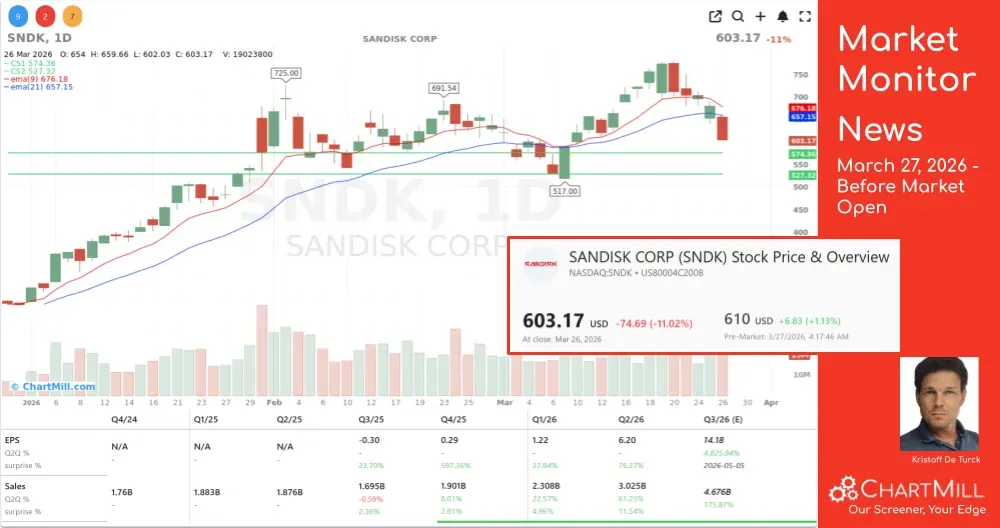
Chips Crack as Iran Fears Grip Wall Street
Thursday handed investors a painful reminder that geopolitics and technology disruption can strike simultaneously. The Nasdaq shed 2.4% and the Dow Jones fell 1%, with semiconductor stocks absorbing the heaviest blows, caught between fears of a helium shortage triggered by the Iran conflict and a Google algorithm that threatens to upend memory demand. Meanwhile, oil surged past $107 a barrel, and Snap tumbled after Brussels opened a child safety probe.
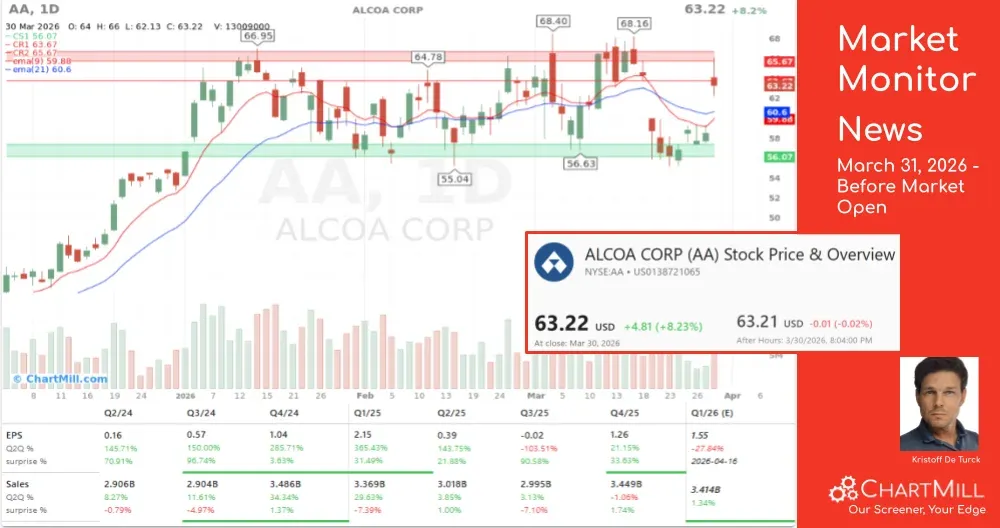
A Better Breadth Day, but Not Yet a Stronger Market
A second straight improvement in daily breadth helped stabilize the market on March 25, with advancers clearly outpacing decliners and short-term participation expanding. Still, the broader backdrop remains fragile: most medium- and longer-term breadth measures are weak, SPY and QQQ remain below their short-term moving averages, and the weekly trend picture continues to argue for caution.
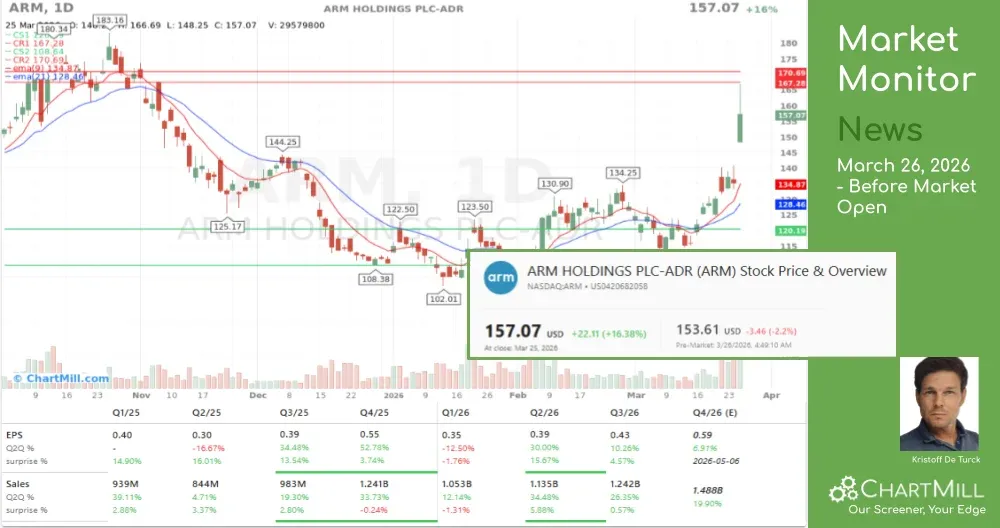
ARM Makes Its Move While Wall Street Watches the Strait
Arm Holdings surged close to 17% after announcing plans to sell its own chips directly for the first time, with Meta as its first customer. Meanwhile, Wall Street ended the day modestly higher as investors balanced ceasefire hopes against an oil market caught between relief and renewed tension.
Market Breadth Reverses Lower as Rally Attempt Loses Traction
Tuesday’s market action showed that Monday’s rebound did little to repair the market’s internal damage. Breadth weakened sharply again, with decliners back in control and participation across key moving-average metrics still stuck at depressed levels. The major indexes are now sitting near important support zones, while the broader market continues to look fragile beneath the surface.
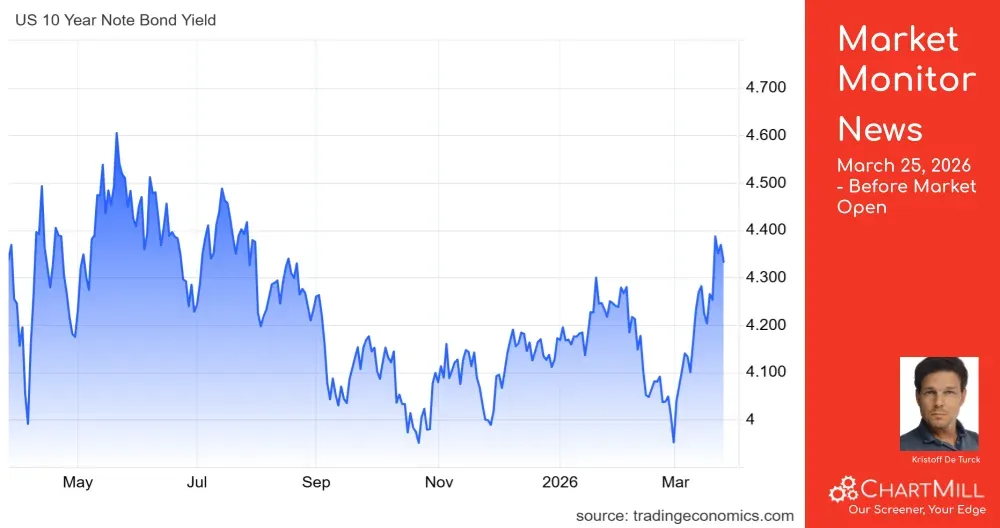
Iran Puts a Match to Oil Markets as Wall Street's Tech Giants Buckle Under Rate Pressure
Oil crossed back above $100 a barrel as Iran–US diplomacy showed its cracks, a climbing 10-year yield hammered the tech sector, and fresh redemption gates at two of the largest private credit funds raised uncomfortable questions about liquidity in a $1.8 trillion market. Tuesday delivered more than enough to keep investors on their toes heading into Wednesday's session.
Breadth Rebounds Sharply, but the Bigger Repair Job Is Still Ahead
A strong upside breadth day gave the market a needed reset after Friday’s heavy damage. Still, the broader participation data remains weak enough that this looks more like a relief rebound inside a fragile market than a fully restored bullish environment.
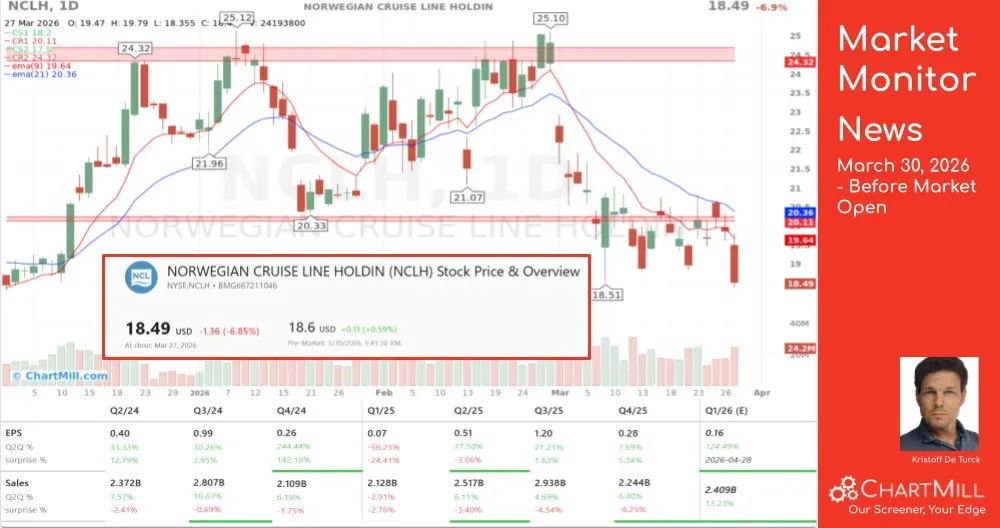
Trump Blinks on Iran And Wall Street Thanks Him for It
A five-day pause on potential U.S. strikes against Iranian energy infrastructure was all it took to flip a sea of red into a splash of green on Monday. Oil fell hard, rates retreated, and cruise and airline stocks surged, while Tesla's Terafab chip ambitions and Berkshire's latest Japan move added some genuine corporate substance to the session.
Market Breadth Breakdown Resumes as Friday Selling Erases Thursday’s Pause
The brief stabilization seen a day earlier did not hold. Friday’s session brought another broad-based washout, with decliners overwhelming advancers and already-weak participation metrics deteriorating further. The major indexes remain under pressure on both the daily and weekly timeframes, and the breadth data continues to argue for a defensive reading.
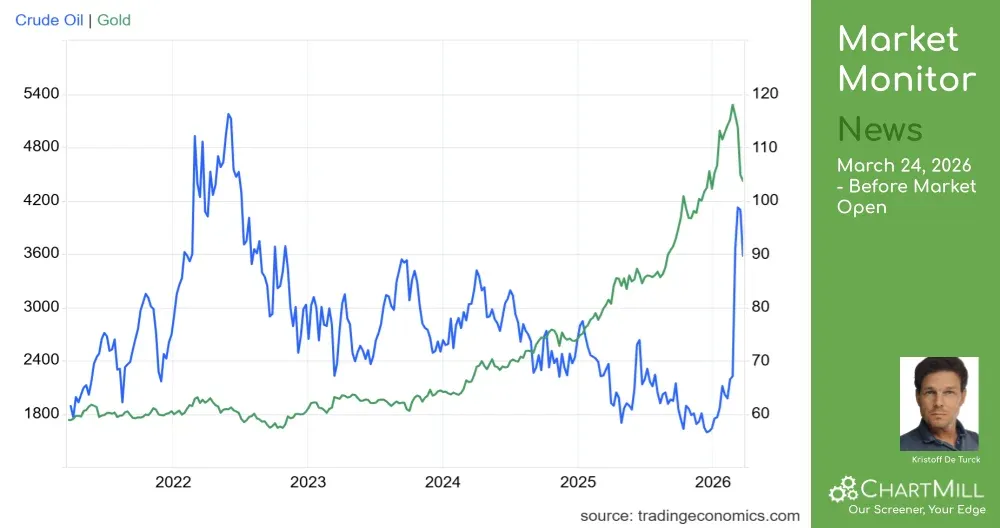
Wall Street Drowns in Red as Iran War Escalates and a Chip-Smuggling Scandal Rocks AI Infrastructure
Four straight weeks of losses, oil prices surging past $112 a barrel, gold posting its worst weekly drop in over four decades, and a co-founder of one of the most talked-about AI hardware companies arrested for smuggling chips to China. Friday, March 20 was anything but dull on Wall Street.
Market Breadth Rebounds, But Conviction Is Still Missing
After Wednesday’s highly negative breadth washout, Thursday brought a clear short-term improvement in participation, especially on a daily and weekly basis. Still, the broader picture did not materially improve: most medium-term breadth readings remain weak, leadership is scarce, and the major indexes are still trading at or near important support zones.
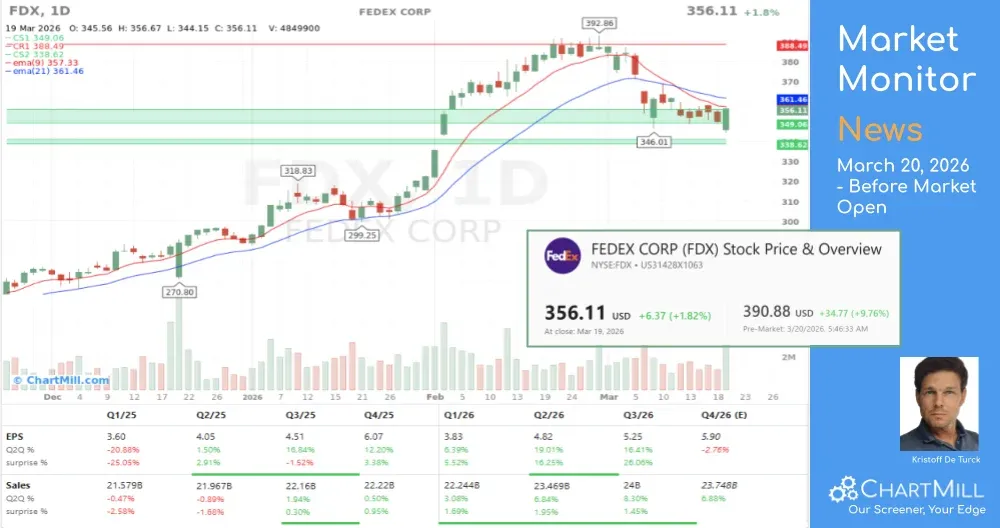
Oil Diplomacy Rescues Wall Street From a Deeper Sell-Off — But the Hormuz Knot Remains Untied
Trump and Netanyahu's reassuring remarks on the Iran conflict pulled oil prices back from multi-year highs and gave Wall Street a lifeline on Thursday, but the structural threat to the Strait of Hormuz remains very much alive. Meanwhile, Micron's blockbuster results were overshadowed by an eye-popping capex pledge, and FedEx delivered a post-market earnings surprise that should have your attention heading into Friday's open.
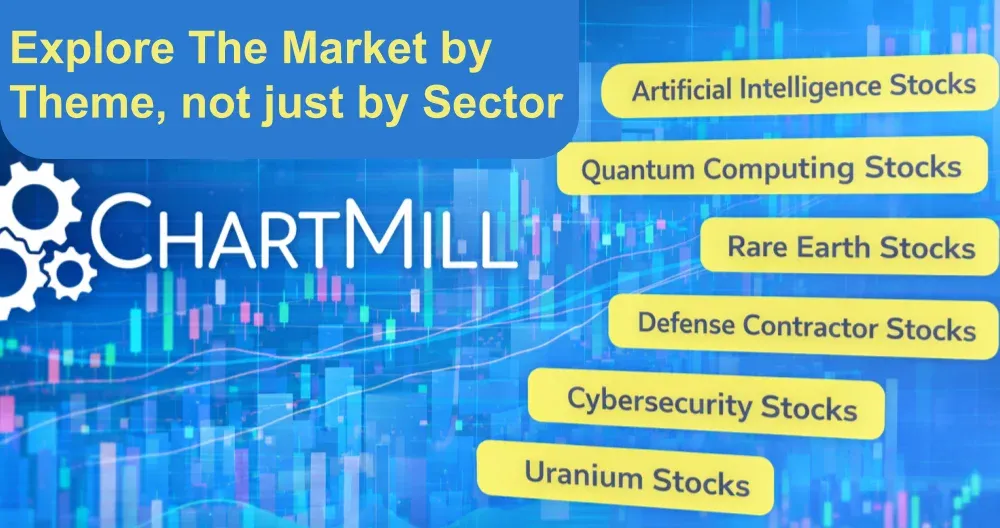
New on ChartMill: Explore the Market by Theme, Not Just by Sector
we expanded the USA Stock Market Overview page on ChartMill. In addition to the traditional market structure, you can now also explore thematic stock groups such as Quantum Computing Stocks, Rare Earth Stocks, Artificial Intelligence Stocks, Uranium Stocks, and more.

SPXC Breakout Update: Now What?
Now that it’s working: a step-by-step trade management plan

Apple’s Silent Siri and the AI Gap: A Tech Titan’s Identity Crisis
Apple is facing a rare moment of vulnerability as concerns mount over its ability to compete in the generative AI race. With reports of Siri delays and a reliance on competitors for innovation, the company's "wait and see" approach is finally being tested by an increasingly impatient market.

Why Ford is Scaling Back Its All-Electric Vehicle Plan
After a $15.5B strategy reset, the automaker is ditching pricey EV bets to double down on affordable electrics and booming hybrids.
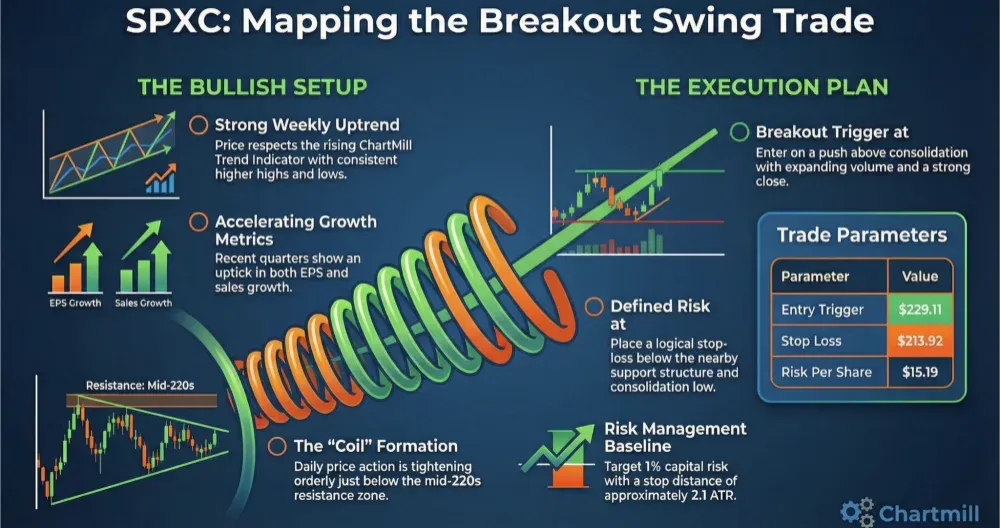
SPX Technologies (SPXC): A Growth Stock Coiling Under Key Resistance
A tightening base beneath resistance, backed by accelerating fundamentals
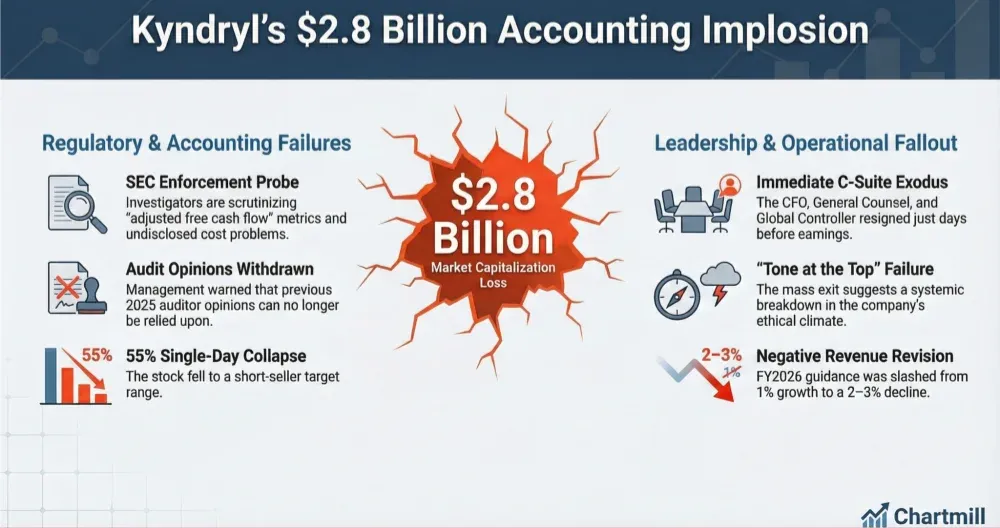
Kyndryl’s $2.8 Billion Vanishing Act: Short Sellers Vindicated as the SEC Moves In
Kyndryl suffered a historic 55% collapse after disclosing an SEC enforcement investigation into its cash management and adjusted free cash flow metrics. The sudden exodus of top executives and the withdrawal of previous auditor opinions suggest a systemic "tone at the top" failure that has turned a high-profile IBM spin-off into a cautionary tale of accounting irregularities.

Microsoft’s AI Paradox: Why We Must Fertilize the Soil Before We Can Harvest
Yesterday, Microsoft released its latest quarterly results, and the paradox couldn’t be more striking.

Finding Stocks Has Never Been Easier: Meet the New AI Screening Builder on ChartMill
Instantly translate your trading ideas into powerful filters using natural language.

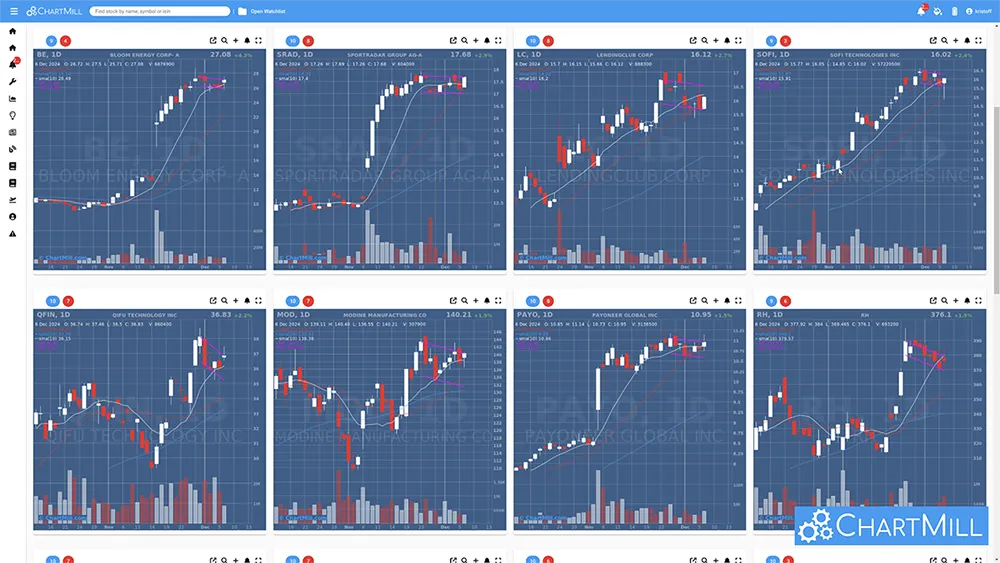
A Whole Watchlist of “Coiled Springs” (Found With One Simple ChartMill Screen)
Sometimes you open a scan result and you immediately feel the market tone. That’s exactly what happened here: the screenshot above is packed with US stocks that are already in established uptrends, and now look like they’re resting in tight ranges near the EMA9 / EMA21. That’s the classic “coiled spring” look: strong trend + controlled digestion + potential next leg.
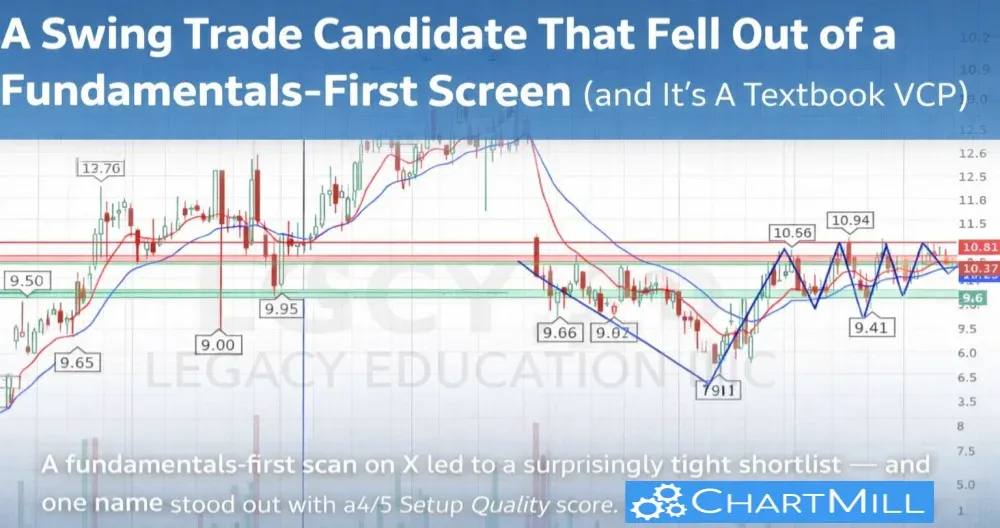
A Swing Trade Candidate That Fell Out of a Fundamentals-First Screen (and It’s a Textbook VCP)
A fundamentals-first scan on X led to a surprisingly tight shortlist — and one name stood out with a 4/5 Setup Quality score. Here’s why LGCY’s chart is a textbook VCP pattern, how I’d frame the key levels, and why even great-looking setups still need clear risk management.
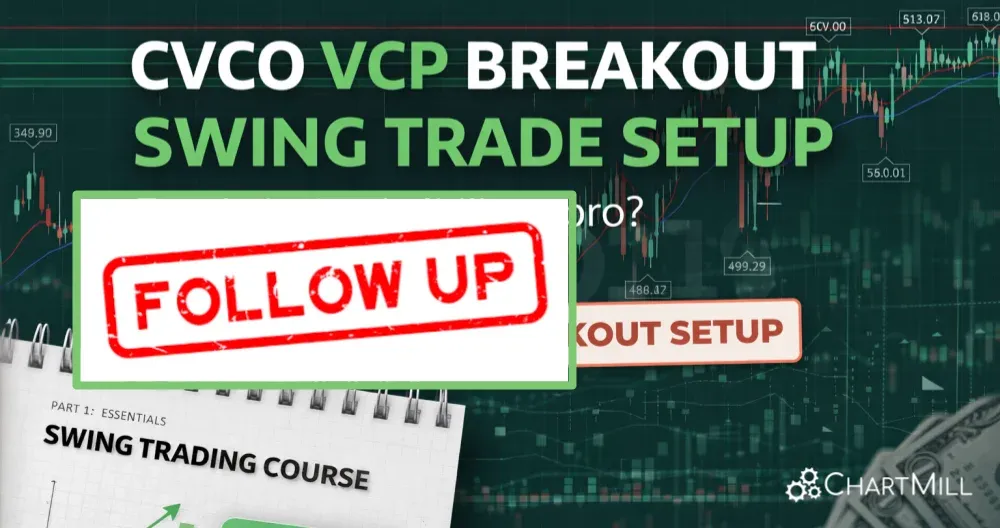
CVCO Follow-Up: The Breakout Just Confirmed
(Now the Hard Part Begins) ChartMill_US

CVCO: A textbook VCP coiling under the highs (with the “right kind” of numbers underneath)
Some stocks announce their intention with clean structure. Cavco Industries (CVCO) is doing exactly that: a classic Volatility Contraction Pattern (Minervini-style) tightening up just beneath resistance.
NerdWallet (NRDS) at $13.48: Platform Compounder in the Making — or Still a “Google + Credit Cycle” Stock?
NRDS surfaced from a 16-stock ChartMill “high-quality small-cap growth” screen. In this post, I assess whether it’s a genuine long-term compounder in the making — or a business still too exposed to platform and cycle risk.

Why GE Vernova Surged 16% in a Single Session
On Wednesday, shares of GE Vernova (NYSE: GEV) jumped roughly 16% in one trading session. That kind of move in a large, established industrial name doesn’t happen by accident...

Discover New Ways to Screen Stocks: ChartMill Adds Fresh Filters and Metrics
ChartMill’s stock screener just got more powerful. Explore new filters including EMAs, relative strength, revenue, Graham number, and more — perfect for traders and investors alike.
Testing the Waters: Three Short Swing Trade Setups
Three Short Swing Trade Setups Testing the downside with minimal exposure.
Introducing the Master Swing Trading Course: Built From Your Questions, Backed by 30+ Years of Experience
After months of work, we’re proud to release the Master Swing Trading Course - a 175-page deep dive designed from your feedback and our three decades of market experience.

NIKE Q4 FY2025 – Is the Swoosh Turning the Corner?
Nike beats low expectations, sparks a breakout, fundamental turnaround in progress?
FedEx: Better Numbers, Bleaker Outlook And a Founder Farewell
Despite a solid Q4, FedEx stock stumbles on soft guidance and macro headwinds.
How the Iran-US Crisis Could Shake Markets And Where Smart Traders Are Looking for Opportunity

Roku and Amazon Ads: A Game-Changer or a Fleeting Hype?
Roku’s new Amazon Ads deal could reshape CTV advertising, but can it drive real growth or is it just hype? Here's what investors need to know.

Oracle Just Soared 13% on Earnings — Too Hot to Touch, or Still a Buy?
Oracle just soared 13% after earnings — but is it too hot to chase, or still worth buying for long-term investors? Walter Shares breaks it down.

GitLab Just Crushed Earnings… and the Stock Crashed – Here’s Why I’m Buying
GitLab beats earnings, stock drops. Long-term investor Walter Shares explains why it’s a buying opportunity, not a red flag.

Are Uranium Stocks Worth Considering Today?
The energy market is on the move, and nuclear power, long shunned, is making a comeback. Should I be keeping an eye on uranium stocks? And maybe even: Is now the time to get in?
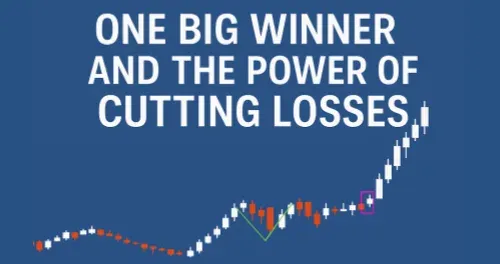
One Big Winner and the Power of Cutting Losses
One big winner can change your portfolio. Learn why risk management beats perfect setups in swing trading.

Trading Bull Flags, 5 Common Mistakes You Should Definitely Avoid!
Avoid costly trading errors. Learn the 5 most common mistakes traders make with bull flag patterns—and how to avoid them.

Why the P/E Ratio Alone Isn’t Enough to Identify Value Stocks...
The price-to-earnings (P/E) ratio is one of the most widely used metrics for evaluating stocks, especially when looking for value investments. However, relying solely on this indicator can lead to misleading conclusions.

Introducing Our New and Improved Stock Profile Pages!
Discover ChartMill's new and improved stock profile pages! Get key financials, technical ratings, news, and insights—all in one place. Explore now!
ChartMill 2024 Highlights
As we step into 2025, it's the perfect moment to reflect on the groundbreaking features and enhancements that defined ChartMill in 2024.
Discover Short Interest Trading Ideas and Spot Potential Short Squeezes with ChartMill
We’ve just released a new article on short interest, short squeezes, and how to use ChartMill’s screening tools to identify potential high-pressure setups.
Smarter Stock Selection by Combining Different Screening Filters
The Market Monitor: A Unique Feature in ChartMill
ChartMill stands out by offering a Market Monitor page, updated daily, which gives users a clear overview of the current market conditions.

Explore Our Latest Videos: Mastering Growth and Swing Trading with ChartMill

Hidden Insights: Using a Stock Screener to Decode Market Conditions
Let’s explore how stock screeners can serve as an indirect barometer for the health of the market.

Introducing the New Full Screen Stock Charts in ChartMill
With Full Screen Stock Charts, you can open an expanded charting window and either enter individual tickers or load your saved watchlists directly.

Discover Hot IPO Breakouts with ChartMill's New Screen
We’ve developed a new screen in ChartMill to help you easily find IPOs from the past year that are on the verge of breaking out to new highs. These are the stocks showing strong demand, which can be a powerful signal for future growth.

6 ChartMill Trading ideas you can use to look for undervalued stocks

How To Find The New Leaders When Stock Markets Are Correcting?
Focus on a bottom-up approach to find the strongest individual stocks that can become the new leaders of tomorrow.
Which Sectors, Industries and Stocks merit your full attention when interest rates fall?
Better-than-expected inflation data have increased the likelihood that the Federal Reserve will cut interest rates. This has shifted investor interest toward sectors that benefit more directly from lower borrowing costs, such as smaller, interest-sensitive growth companies.

New Features and updates from ChartMill – Taking Your Analysis to the Next Level!
Quickly discover these exciting new features and updates in your favorite stock screening platform!