

(All data & visualisations by ChartMill.com)
Daily Market Trend Analysis – September 24, 2025 (After Market Close)
Minor losses for all US index ETFs, new intraday high for IWM (Russell 2000 - small caps)
Short Term Trend
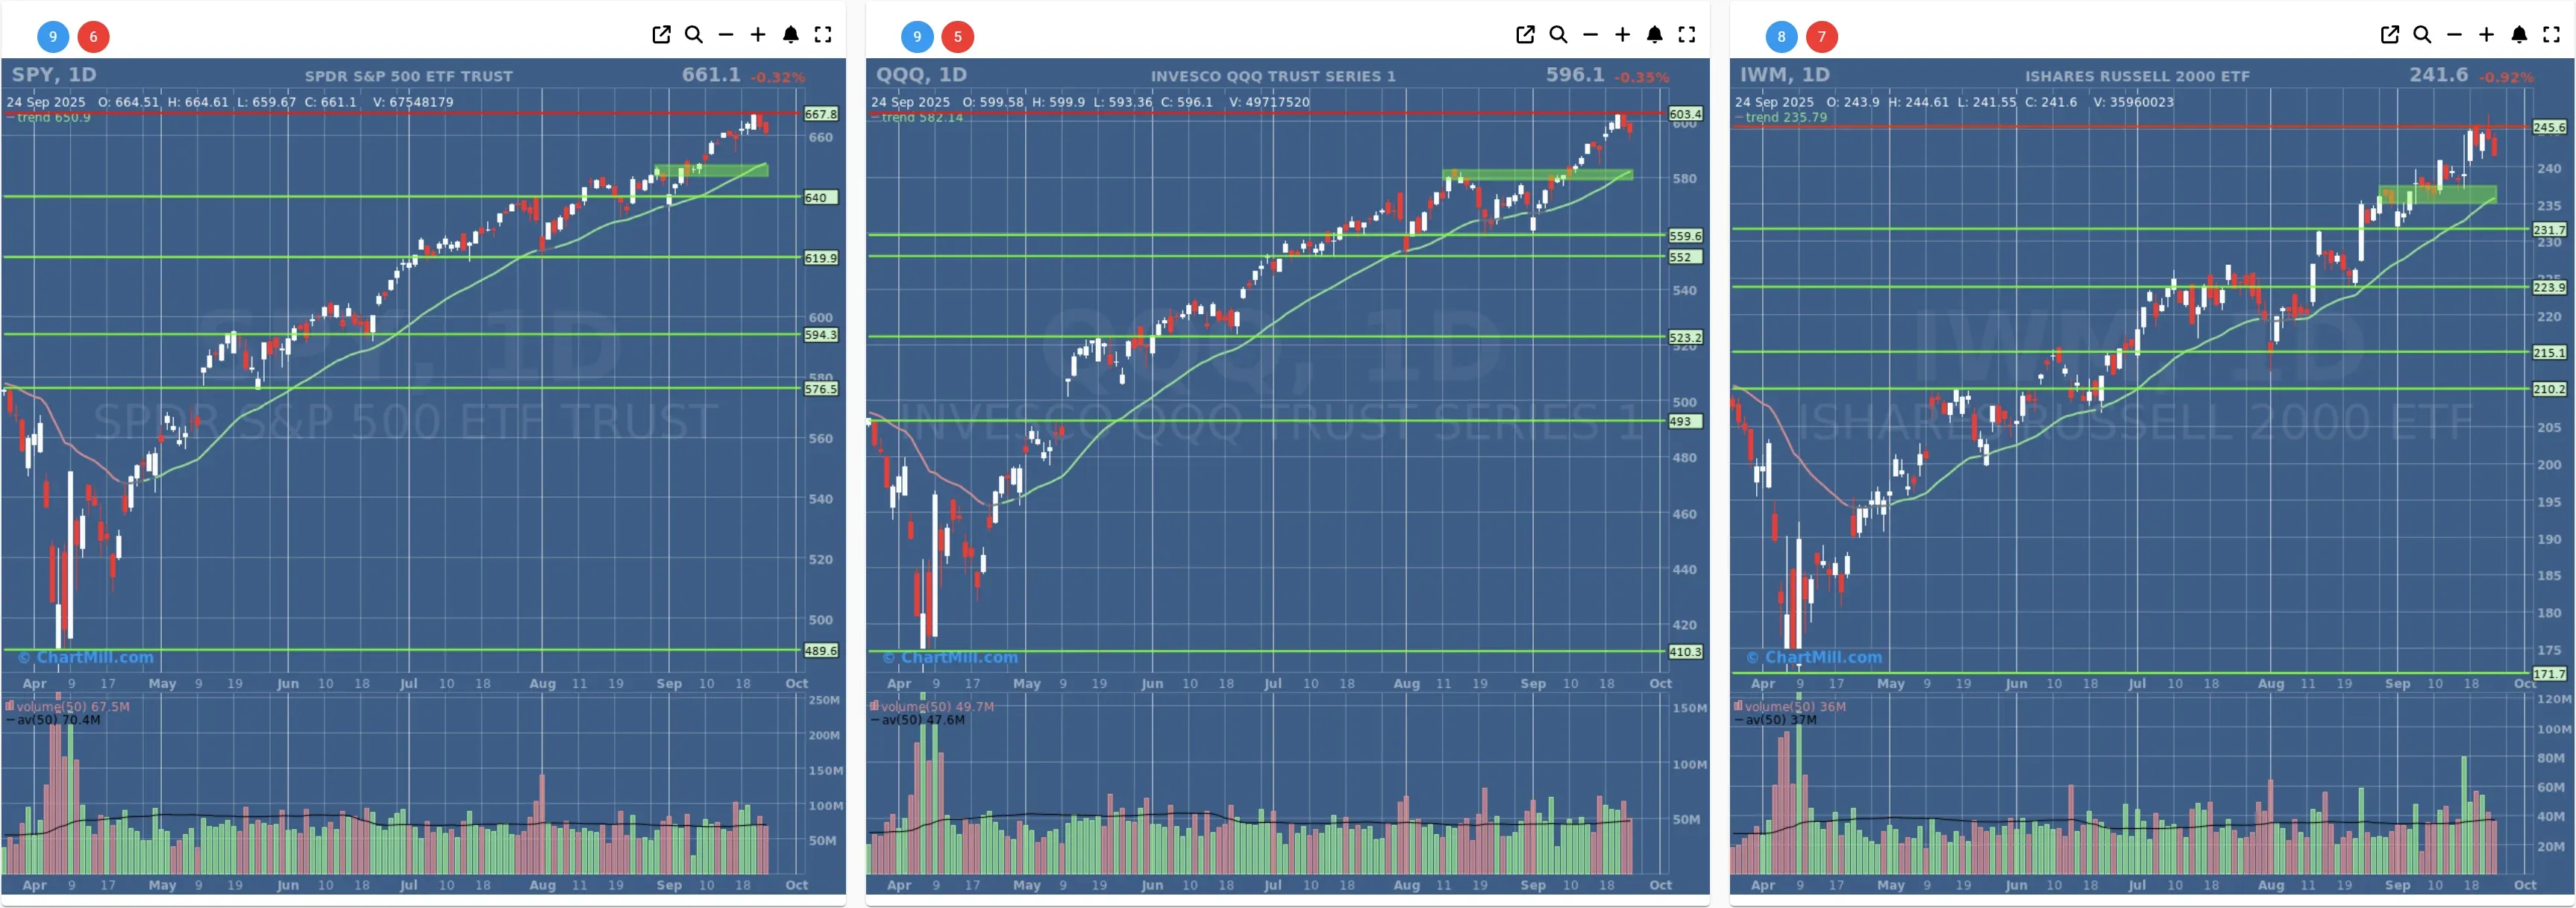
- Short-Term Trend: Positive (no change)
- Next Support at $660 - $650
- Next Resistance at $667
- Volume: At Average (50)
- Pattern: Down Day
- Short-Term Trend: Positive (no change)
- Next Support at $590
- Next Resistance at $603
- Volume: At Average (50)
- Pattern: Down Day
- Short-Term Trend: Positive (no change)
- Next Support at $235
- Next Resistance at $245
- Volume: At Average (50)
- Pattern: Down Day
Long Term Trend
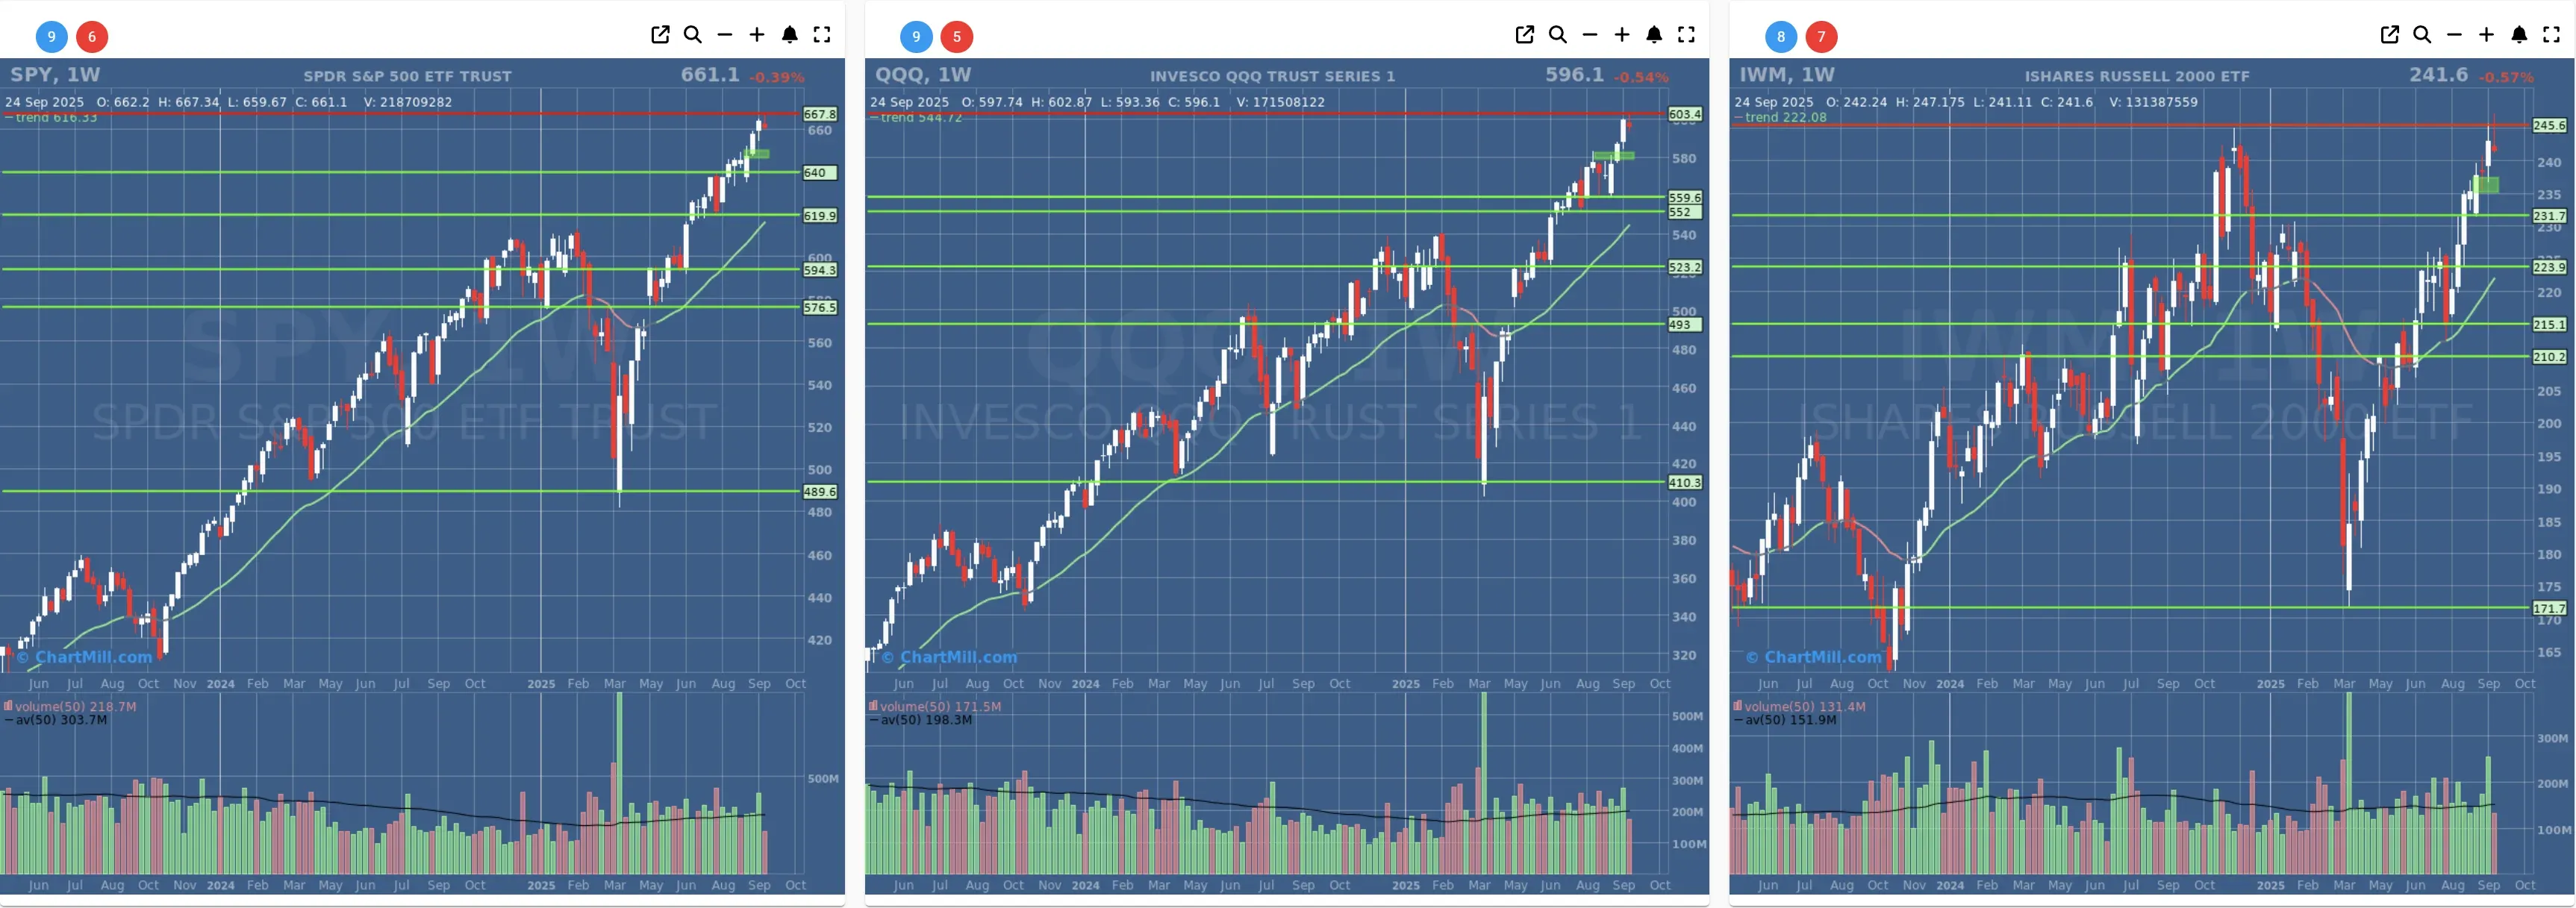
- Long-Term Trend: Positive (no change)
- Long-Term Trend: Positive (no change)
- Long-Term Trend: Positive (from neutral)
Daily Market Breadth Analysis – September 24, 2025 (After Market Close)
After Tuesday’s modest pullback, Wednesday’s session (Sep 24) brought a clear deterioration in market breadth.
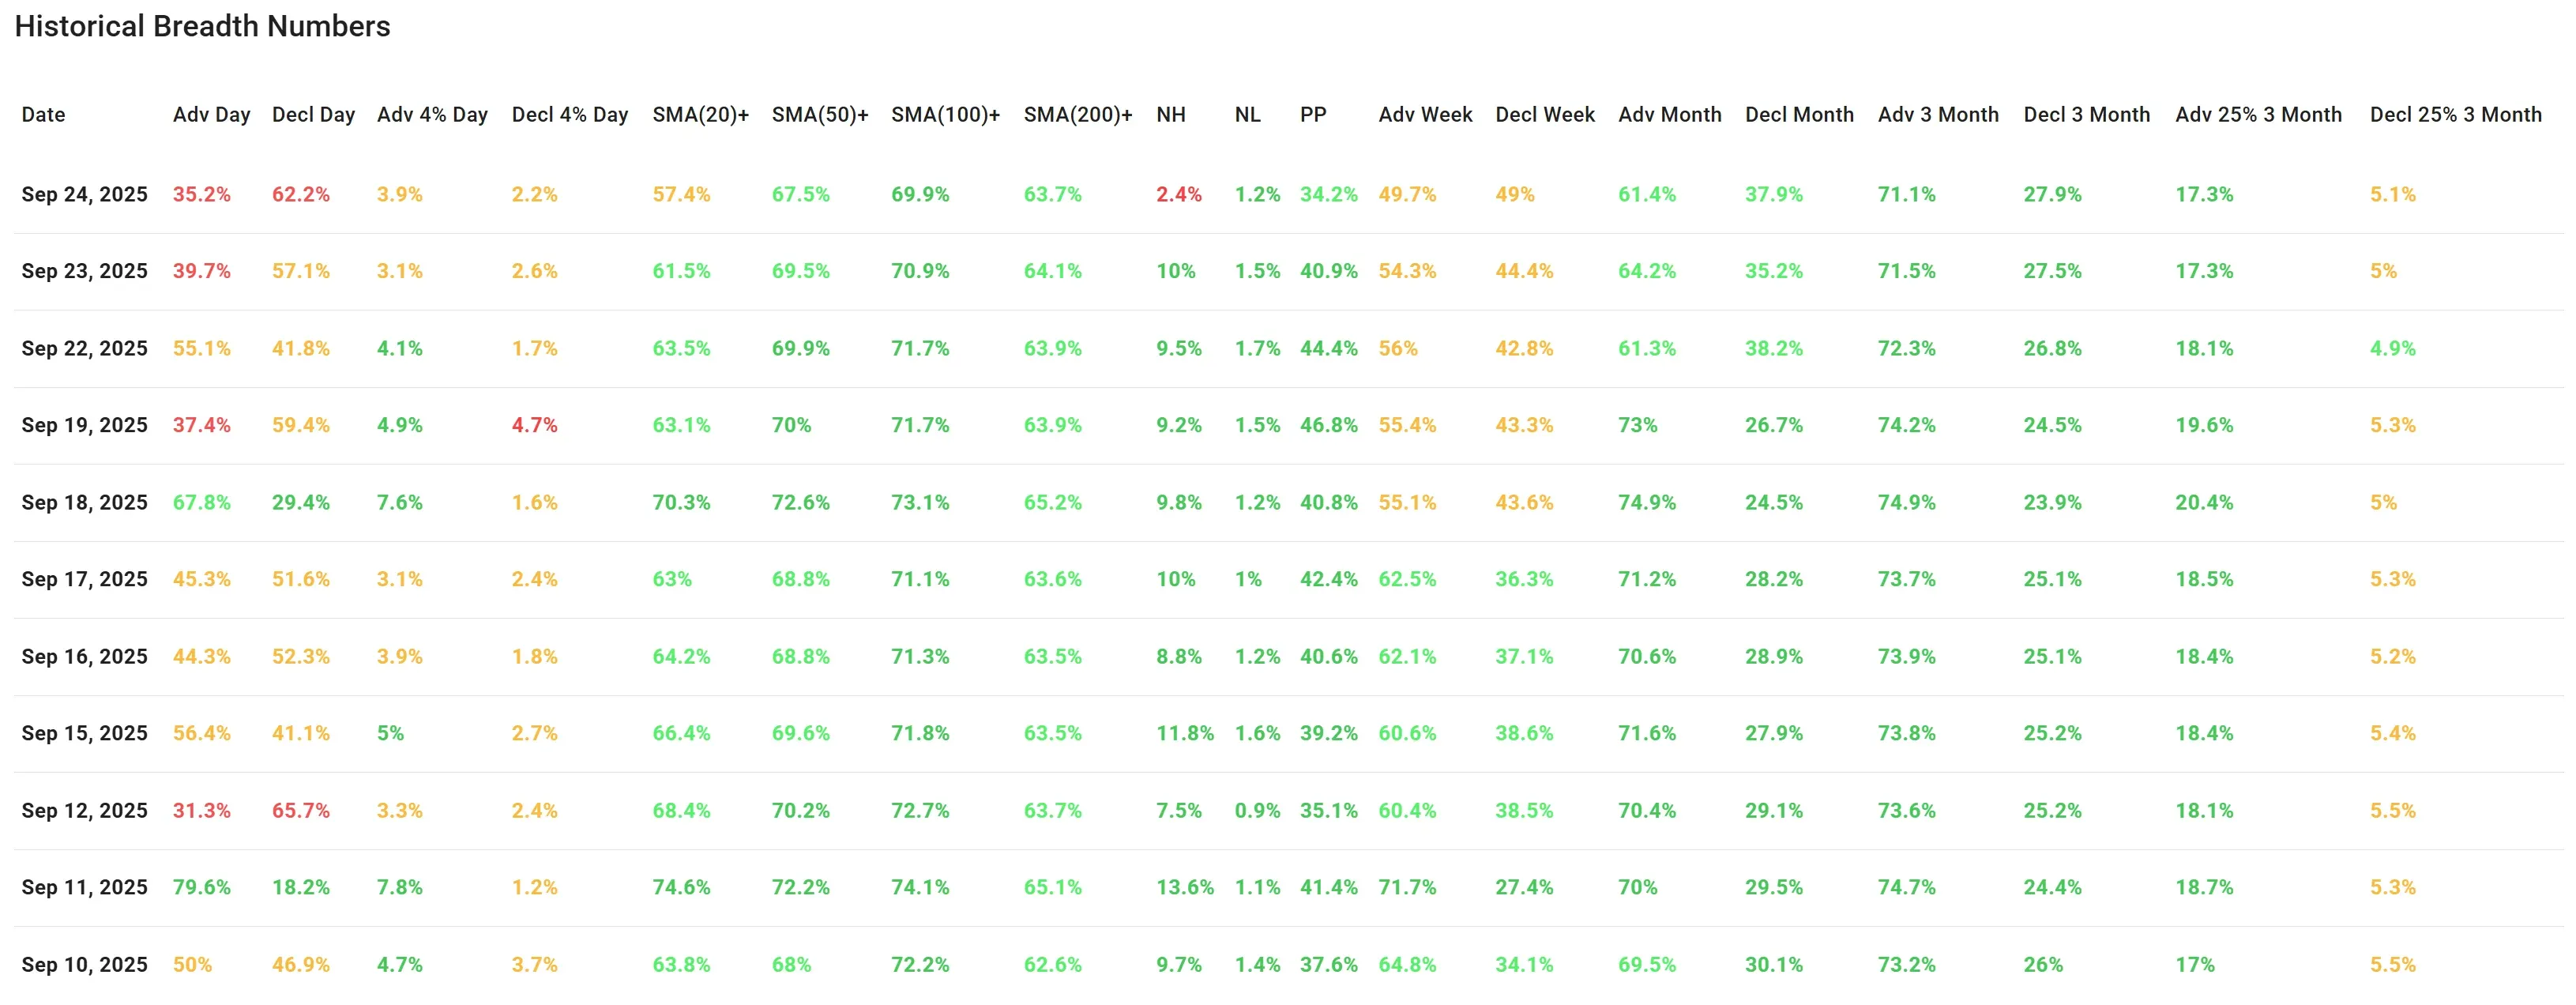
Only 35.2% of stocks advanced, while 62.2% declined, extending yesterday’s imbalance (39.7% vs 57.1%). This marks two consecutive sessions where declining stocks outnumbered advancers by a notable margin.
Short-term momentum weakened further: just 57.4% of stocks remain above their 20-day SMA, a drop from 61.5% the prior day.
The 50-, 100- and 200-day readings (67.5%, 69.9%, and 63.7%) held steady but no longer show broad improvement. Meanwhile, new highs shrank to 2.4%, the lowest in over two weeks, while new lows (1.2%) stayed subdued but are creeping higher relative to earlier sessions.
Weekly breadth deteriorated as advancing stocks slid to 49.7%, falling below parity for the first time since last week, while decliners matched closely at 49%.
On the monthly horizon, however, breadth remains supportive, with 61.4% advancing vs 37.9% declining, indicating the weakness is still confined to the shorter-term picture.
Comparing to Tuesday’s analysis
The previous report already flagged a “pullback phase” developing, with breadth tilting weaker but not yet breaking down. Today’s data confirms that signal, momentum is clearly fading, participation is narrowing, and near-term selling pressure is taking hold.
Breadth Trend Rating: Neutral with a negative bias
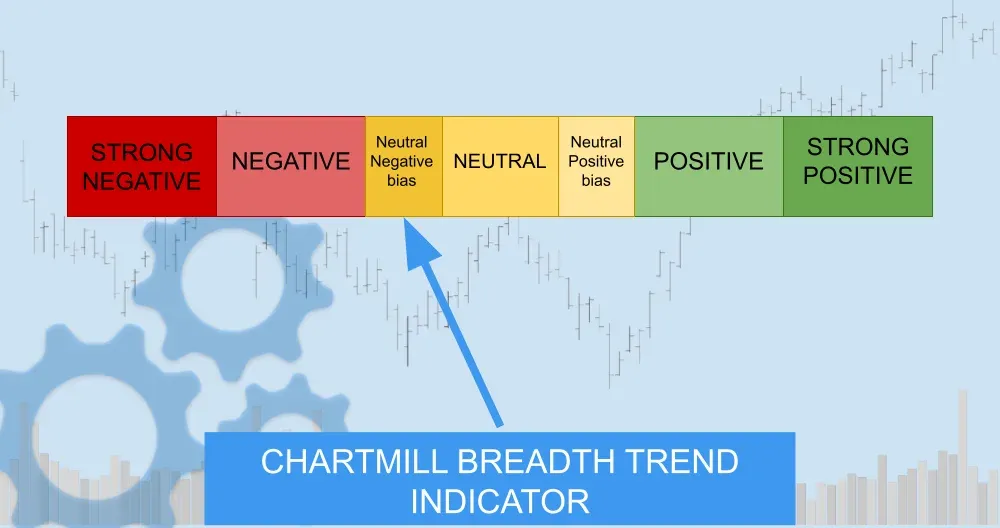
While longer-term metrics still look healthy, the day-to-day and weekly readings show selling gaining traction. Unless we see quick stabilization, the risk is that this short-term pullback expands further.
Kristoff - ChartMill
Next to read: Wall Street Pauses AI Frenzy as Oracle Seeks $15B in Fresh Funding