
(All data & visualisations by ChartMill.com)
Daily Market Trend Analysis – October 1, 2025 (After Market Close)
New Highs for QQQ and SPY... once again!
Short Term Trend
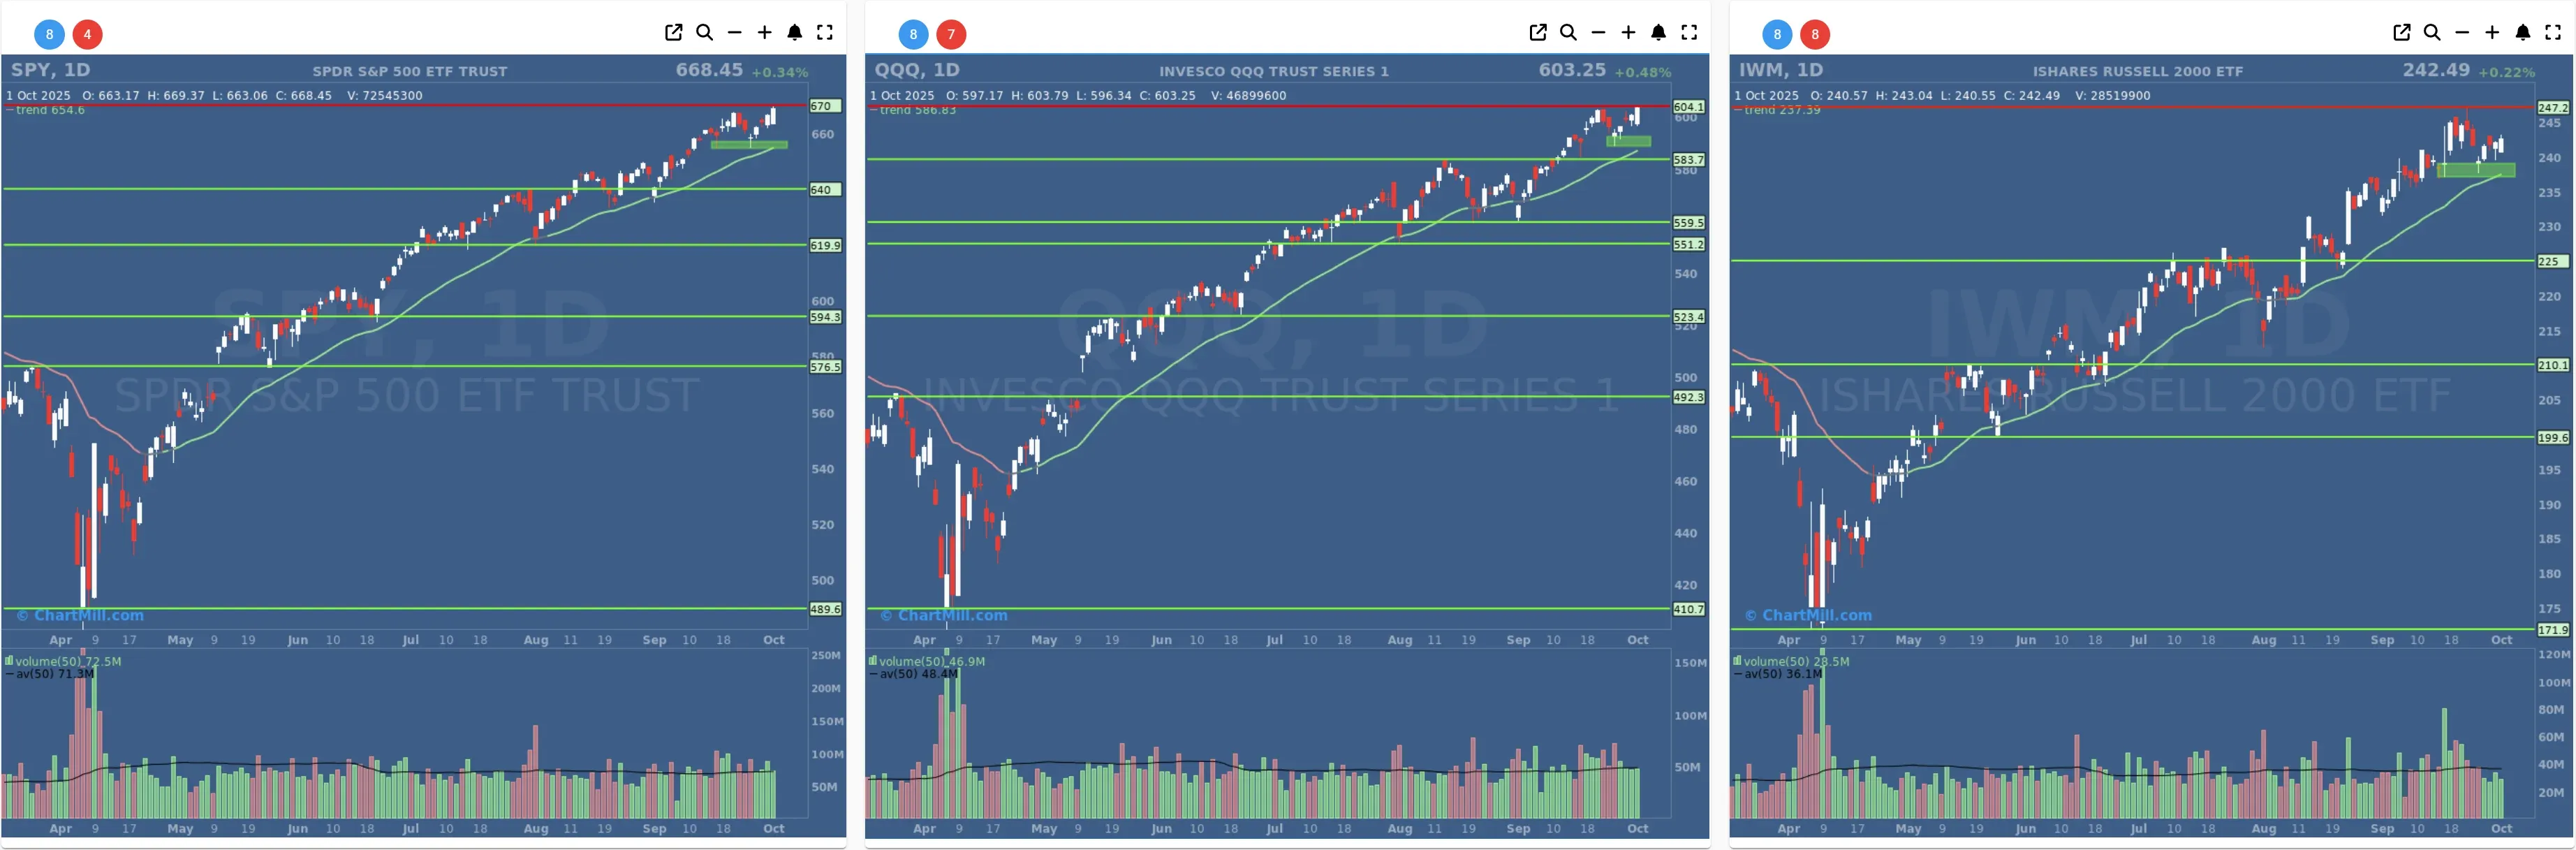
- Short-Term Trend: Positive (no change)
- Next Support at $660 - $650
- Next Resistance at $667
- Volume: At Average (50)
- Pattern: Up Day - New All Time High - Strong Close
- Short-Term Trend: Positive (no change)
- Next Support at $590
- Next Resistance at $603
- Volume: At Average (50)
- Pattern: Up Day - New All Time High - Strong Close
- Short-Term Trend: Positive (no change)
- Next Support at $235
- Next Resistance at $245
- Volume: Slightly Below Average (50)
- Pattern: Up Day - Bullish Engulfing Candle - Strong Close
Long Term Trend

- Long-Term Trend: Positive (no change)
- Long-Term Trend: Positive (no change)
- Long-Term Trend: Positive (from neutral)
Daily Market Breadth Analysis – October 1, 2025 (After Market Close)
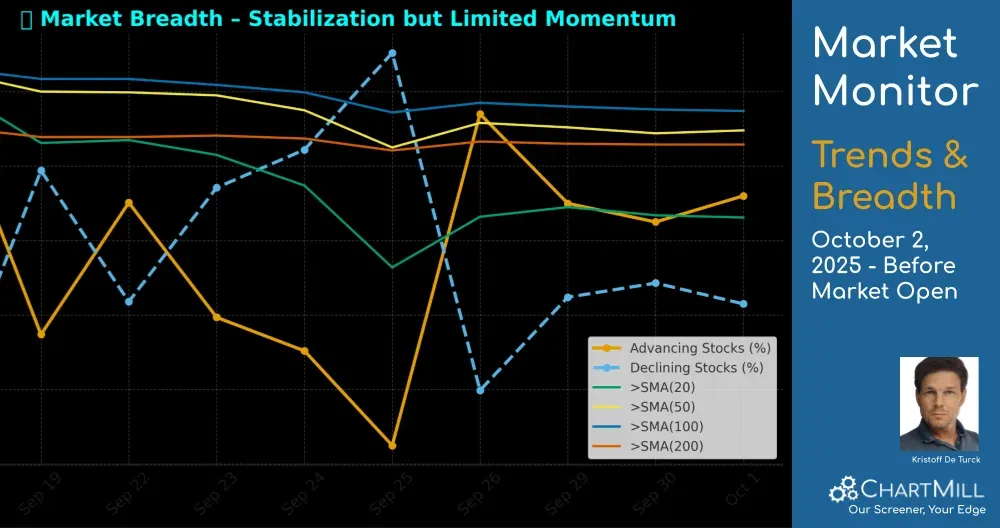
Market breadth indicators show continued stabilization with a slight improvement compared to the end of September. While participation across moving averages and advancing stocks remains solid, the lack of stronger follow-through signals points to a market that is steady but not yet showing decisive upward momentum.
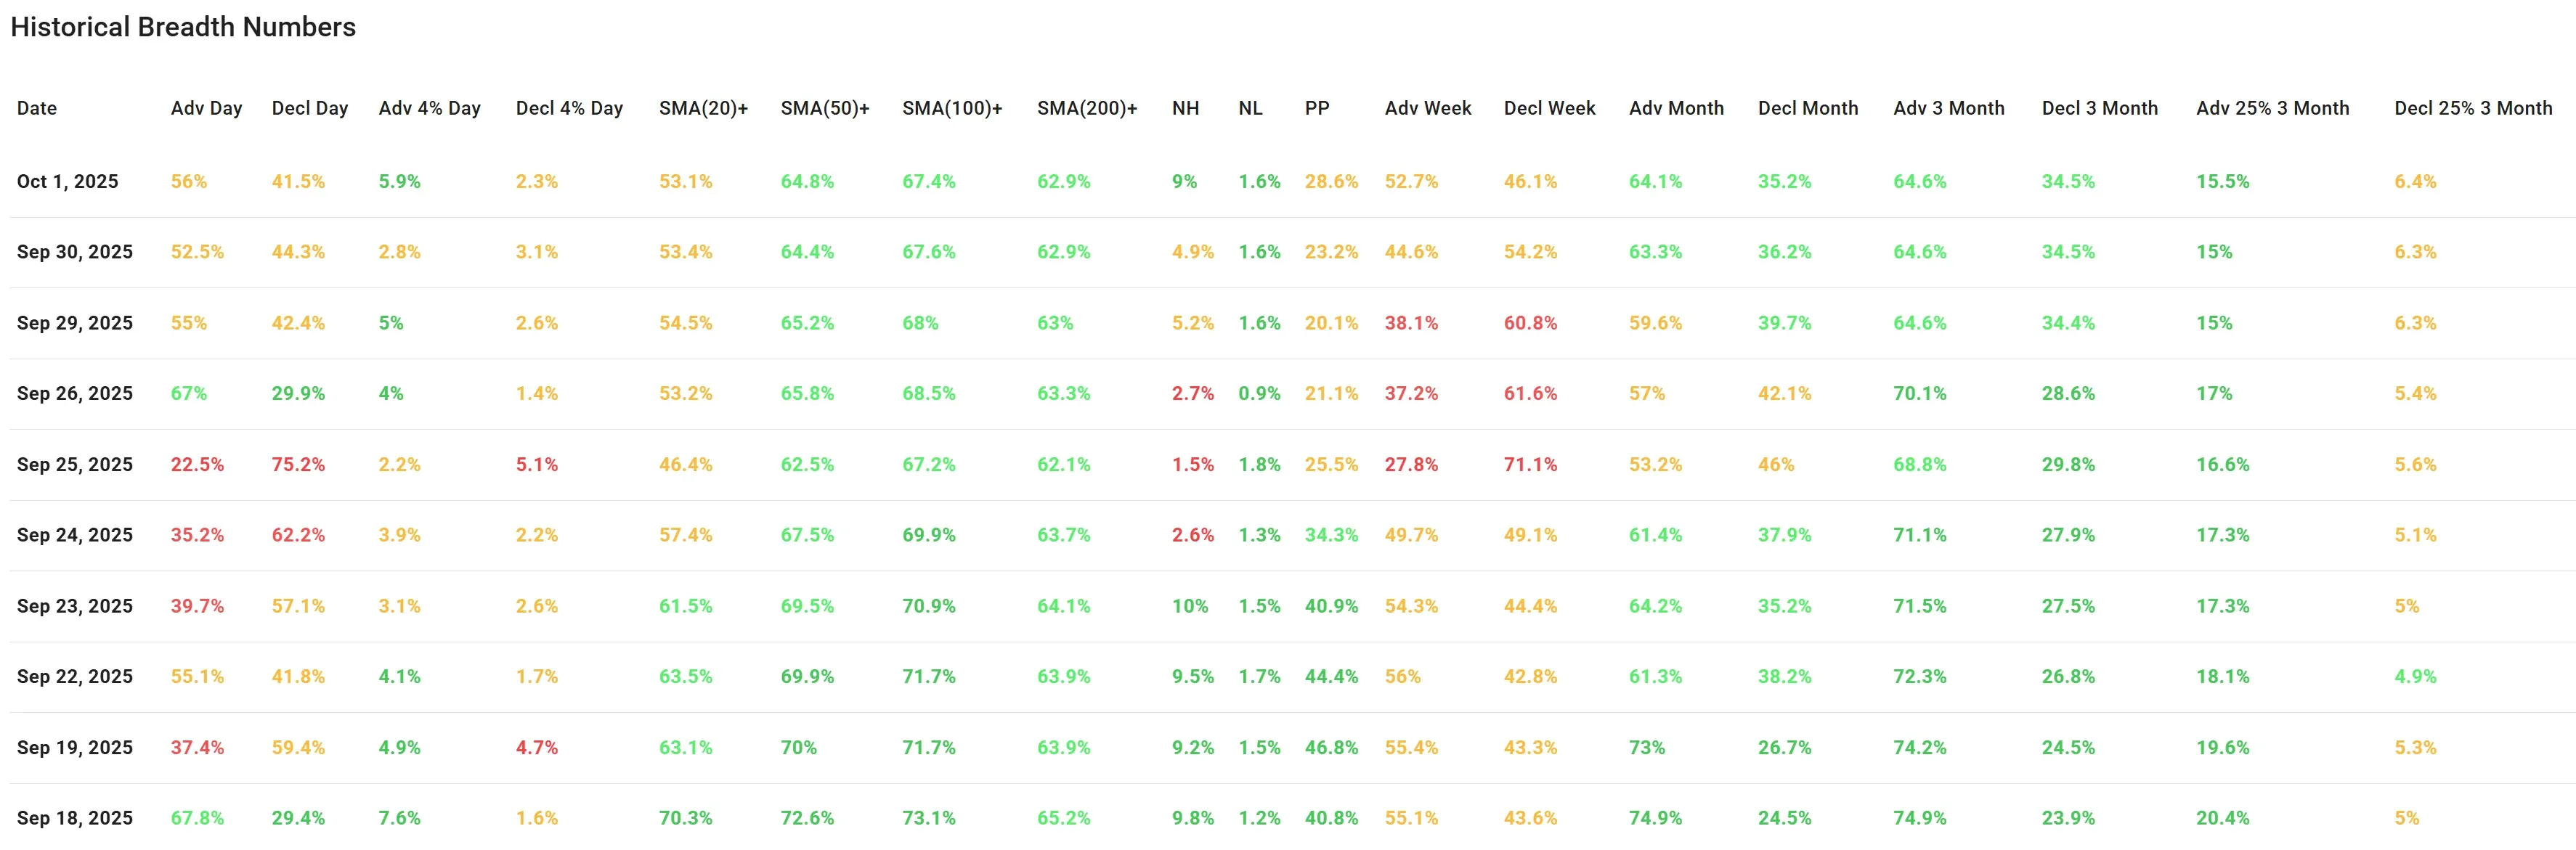
Daily Breadth Metrics
Advancers vs. Decliners:
On Oct 1, advancing issues made up 56% of the market, a modest increase from 52.5% the day before. Decliners fell to 41.5%. This is the second consecutive day above the 50% threshold, reinforcing signs of stabilization.
Strong Moves (±4%):
The percentage of stocks rising more than 4% increased to 5.9%, the highest since Sep 18. Decliners greater than 4% fell back to 2.3%, a constructive sign.
Moving Averages:
Readings across all timeframes remain stable:
-
SMA(20)+: 53.1% (virtually unchanged from 53.4% yesterday)
-
SMA(50)+: 64.8% (flat vs. 64.4%)
-
SMA(100)+: 67.4% (slightly down from 67.6%)
-
SMA(200)+: 62.9% (unchanged)
These levels show broad participation is intact, but short-term momentum (SMA 20) remains below the stronger medium- and long-term measures, highlighting the lack of acceleration.
New Highs / New Lows:
New highs expanded to 9%, the strongest in a week, while new lows held steady at 1.6%. The NH/NL spread turned clearly positive again.
Broader Timeframes
-
Weekly: Advancers rose to 52.7%, while decliners slipped to 46.1%, reversing the previous negative weekly tilt.
-
Monthly: Longer timeframes are still stable, with 64.1% of stocks advancing over the past month against 35.2% declining.
-
Quarterly: The 3-month view continues to lean positively with 64.6% advancers vs. 34.5% decliners, though unchanged from recent days.
Comparison with Previous Day (Sep 30)
-
Both advancers and 4% movers strengthened compared to Tuesday.
-
SMA levels remained stable, pointing to consistency rather than acceleration.
-
New highs nearly doubled (9% vs. 4.9%), showing stronger leadership.
-
Weekly breadth flipped back into positive territory after being slightly negative.
Conclusion
The breadth picture on Oct 1 shows continued stabilization with modest improvement, particularly in the number of new highs and the stronger showing of daily advancers.
However, the lack of decisive gains in short-term moving averages and the relatively flat longer-term measures signal that while selling pressure has abated, momentum remains insufficient to confirm a strong bullish trend.
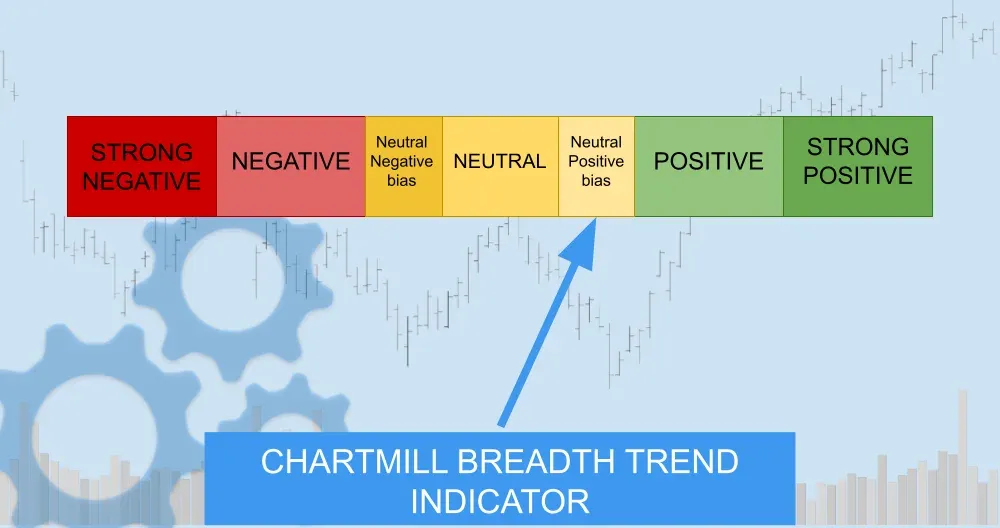
Breadth Trend Rating: Neutral with a Positive Bias
Kristoff - ChartMill
Next to read: Wall Street Holds Firm Despite Shutdown and Weak Jobs Data