

(All data & visualisations by ChartMill.com)
Daily Market Trend Analysis – September 25, 2025 (After Market Close)
Gap Down's & Doji Candles for all three US index-ETFs.
Short Term Trend
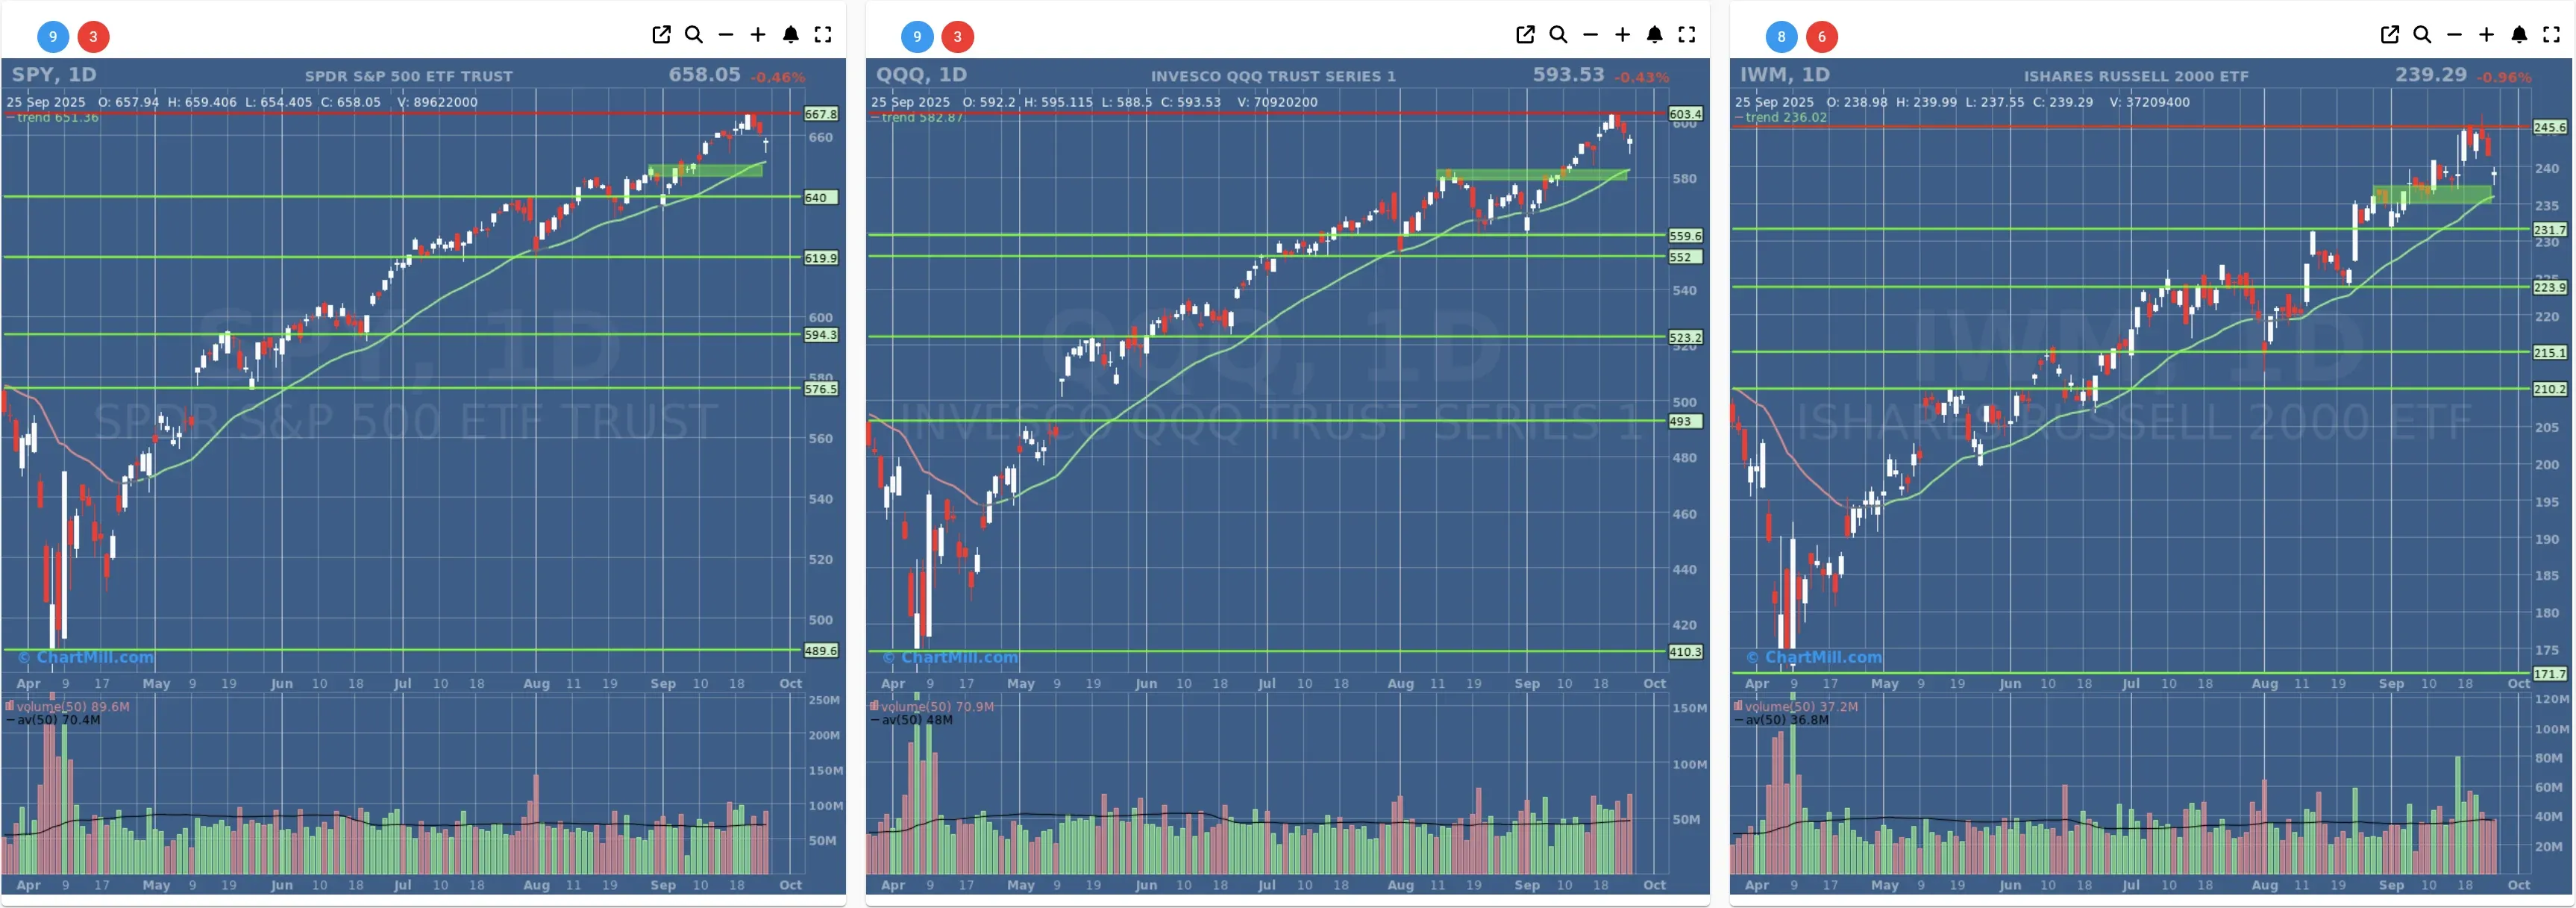
- Short-Term Trend: Positive (no change)
- Next Support at $660 - $650
- Next Resistance at $667
- Volume: Slightly Above Average (50)
- Pattern: Down Day - Gap Down - Doji Candle
- Short-Term Trend: Positive (no change)
- Next Support at $590
- Next Resistance at $603
- Volume: Well Above Average (50)
- Pattern: Down Day - Gap Down - Doji Candle
- Short-Term Trend: Positive (no change)
- Next Support at $235
- Next Resistance at $245
- Volume: At Average (50)
- Pattern: Down Day - Gap Down - Doji Candle
Long Term Trend
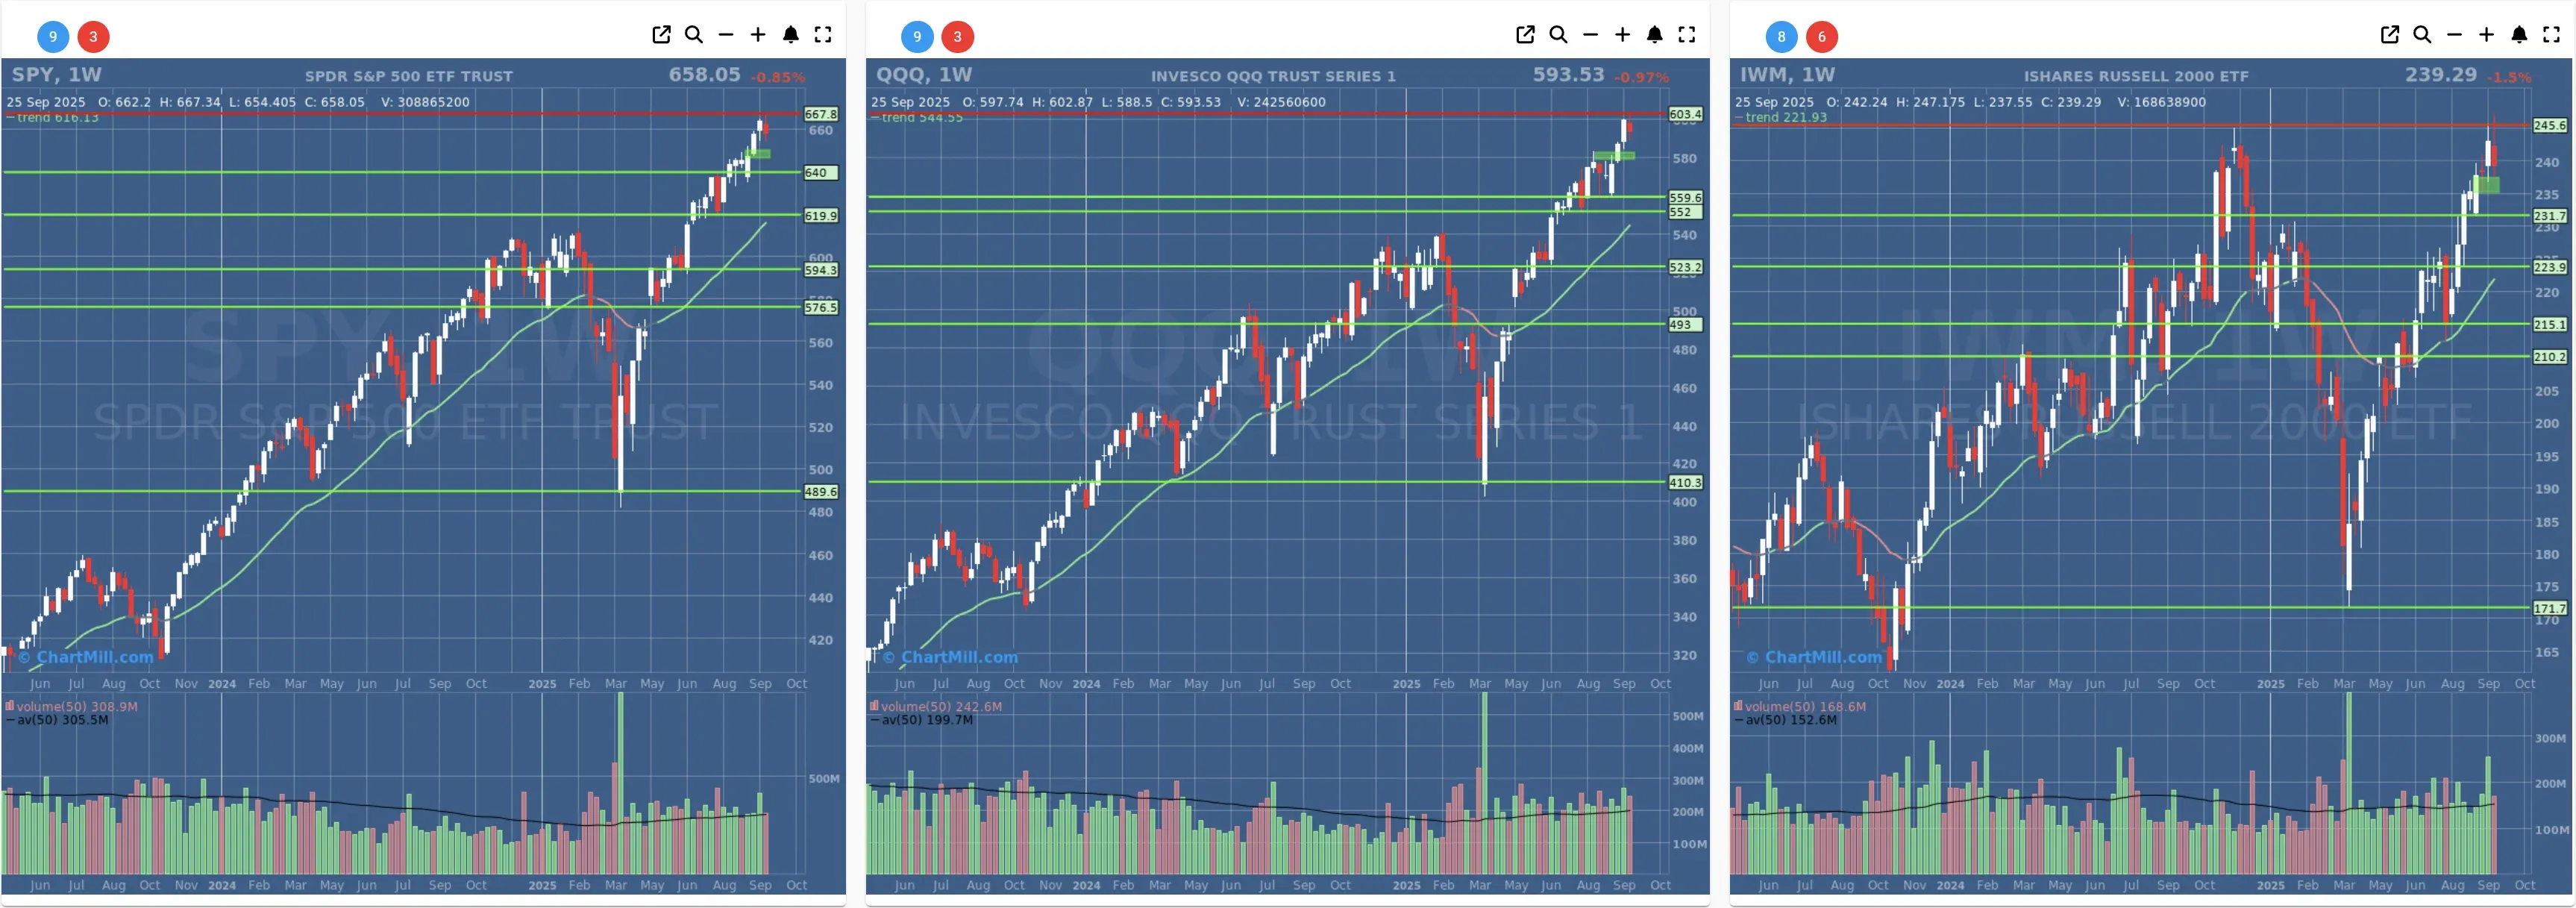
- Long-Term Trend: Positive (no change)
- Long-Term Trend: Positive (no change)
- Long-Term Trend: Positive (from neutral)
Daily Market Breadth Analysis – September 25, 2025 (After Market Close)
After a cautious warning sign on Wednesday, Thursday’s breadth numbers confirmed the shift in tone. Decliners overwhelmed advancers, short-term momentum fell back below key thresholds, and new highs nearly vanished. The data now reflects a clear deterioration in market participation.
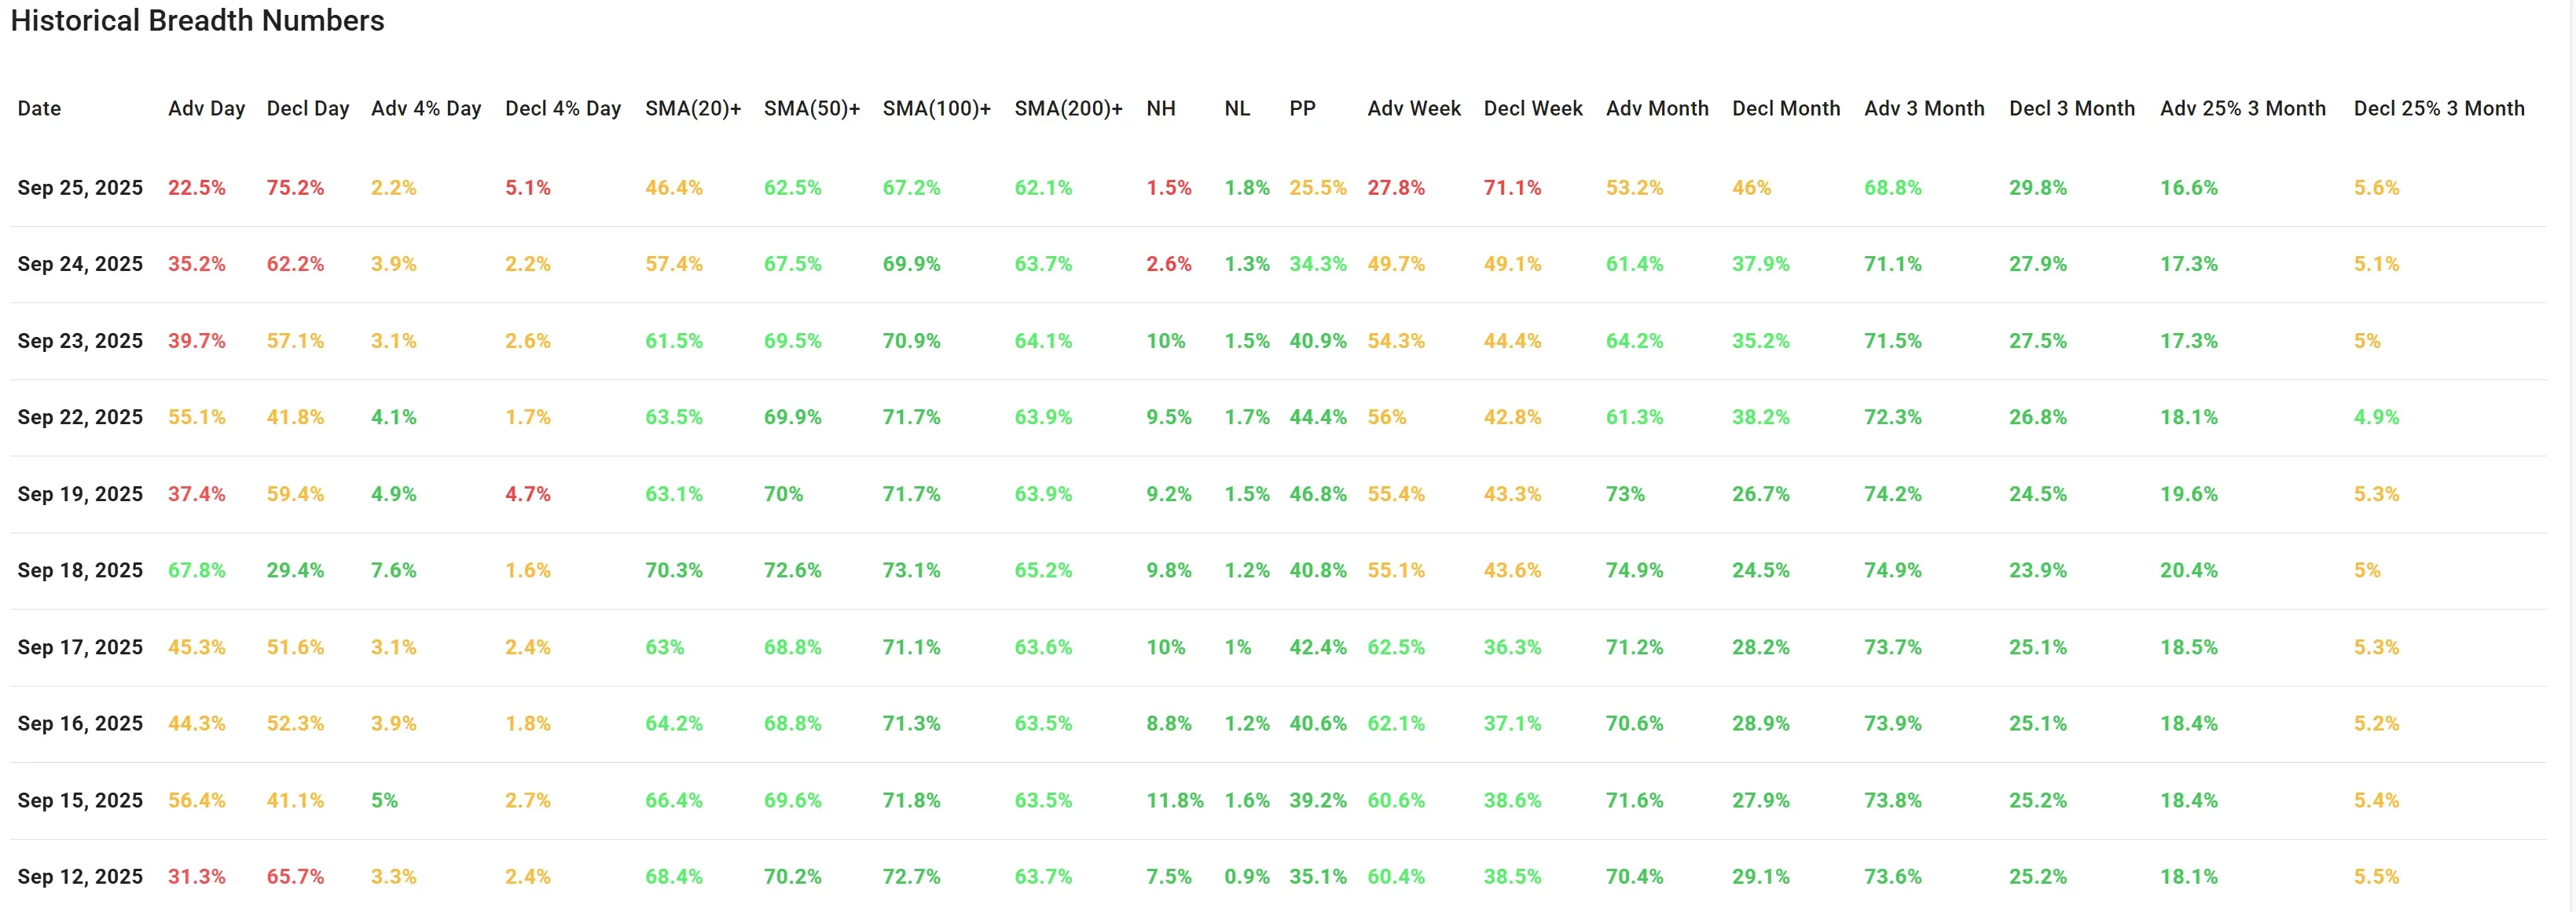
Thursday’s session delivered a decisive blow to market breadth.
Only 22.5% of stocks advanced, while a heavy 75.2% declined, worsening the imbalance already visible on Wednesday (35.2% advancers, 62.2% decliners). This sharp shift illustrates that selling pressure has spread more broadly across the market.
The short-term momentum metrics deteriorated notably: only 46.4% of stocks closed above their 20-day moving average, down from 57.4% the previous day. This drop below the 50% threshold is an important technical shift, signaling that short-term weakness is becoming the dominant force.
Mid- and longer-term moving averages (50-, 100-, and 200-day) remain stronger at 62–67%, but these readings are now under pressure after holding steady earlier in the week.
Breadth leadership also faded further. New highs dropped to just 1.5% of stocks, compared to 2.6% on Wednesday and 10% on Monday.
Meanwhile, new lows held steady near 1.8%, a small number in absolute terms, but the collapse in new highs underscores how thin the leadership has become.
The weekly view also flipped: only 27.8% of stocks gained on the week, against 71.1% declining. That marks a rapid reversal from the relatively balanced picture earlier in the week.
On a monthly basis, breadth still looks somewhat healthier (53.2% advancing vs. 46% declining), but even here the margin is narrowing.
Over the 3-month horizon, broader strength persists: nearly 69% of stocks are still higher, and 16.6% gained more than 25%. This longer-term resilience provides some cushion, but with short-term breadth falling so sharply, the risk is that the weakness begins to erode the medium-term outlook as well.
Context and Comparison to Wednesday
In yesterday’s analysis, the numbers were already flashing early caution: advancers had slipped below 40%, and the percentage above the 20-day average dropped close to 57%. Today’s follow-up confirmed and amplified those warnings.
What looked like the start of a pullback on Wednesday has now developed into a broader wave of selling.
Conclusion
The breadth picture has shifted decisively negative. Short-term participation has broken down, leadership has all but vanished, and weekly figures confirm that sellers have gained control.
While longer-term trends remain intact for now, the current momentum suggests growing downside risk if selling pressure persists.
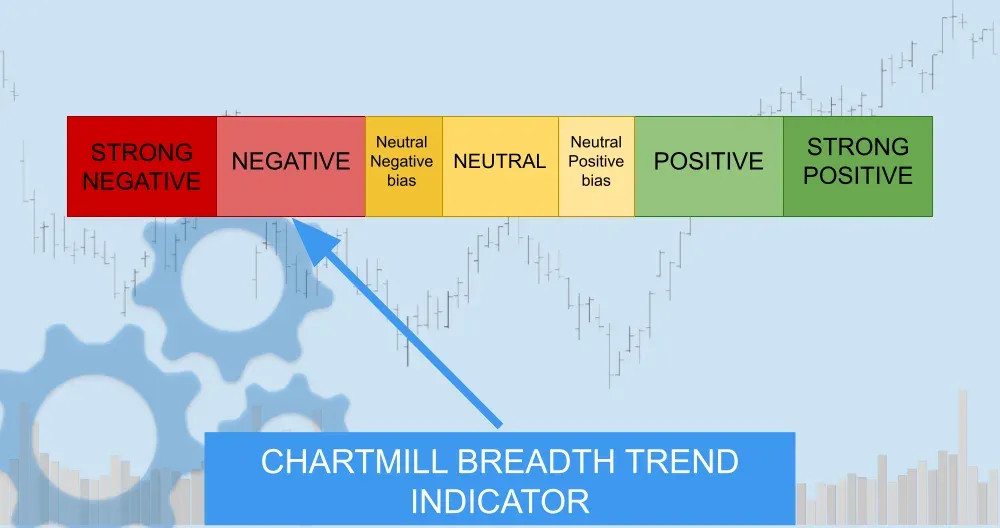
Breadth Trend Rating: Negative
Kristoff - ChartMill
Next to read: Wall Street Slips as Growth Fears Meet Rate Jitters