

(All data & visualisations by ChartMill.com)
Daily Market Trend Analysis – October 3, 2025 (After Market Close)
New intraday highs for SPY and IWM.
Short Term Trend

- Short-Term Trend: Positive (no change)
- Next Support at $666 - $660
- Next Resistance at /
- Volume: At Average (50)
- Pattern: Down Day - New Intraday High
- Short-Term Trend: Positive (no change)
- Next Support at $600
- Next Resistance at /
- Volume: At Average (50)
- Pattern: Down Day- At Minor Support
- Short-Term Trend: Positive (no change)
- Next Support at $235
- Next Resistance at $247
- Volume: At Average (50)
- Pattern: Up Day - Gap Up - New Intraday High - Doji Candle
Long Term Trend

- Long-Term Trend: Positive (no change)
- Long-Term Trend: Positive (no change)
- Long-Term Trend: Positive (from neutral)
Daily Market Breadth Analysis – October 3, 2025 (After Market Close)
The final trading session of the week showed continued stabilization in market breadth, marking a modest improvement across several key metrics compared to Thursday’s data.

Daily Breadth Trends (Oct 3 vs Oct 2)
-
Advancing vs Declining Stocks improved further, with 58.9% advancing (up from 53.6%) and 38.3% declining (down from 43%).
-
Advancers with >4% gains rose slightly to 5.2%, indicating stronger intraday conviction among some winners.
-
The percentage of stocks above key moving averages (SMA(20), SMA(50), SMA(100), SMA(200)) all ticked higher, especially SMA(20)+ (55.9% from 53.5%) and SMA(200)+ (63.6% from 62.8%). These are incremental but encouraging signs of a shifting trend.
New Highs vs New Lows
-
New Highs (NH) increased to 11.5%, the highest level since Sep 23, indicating growing participation in upward moves.
-
New Lows (NL) remained extremely low at 0.8%, reinforcing a healthy floor in recent market action.
Weekly & Monthly Breadth
-
Weekly advancers dipped slightly from 63.3% to 61.4%, but remain comfortably above decliners (37.5%).
-
Monthly advancers slightly decreased to 59.3% (from 60.7%), while decliners rose to 40.2%.
This may signal that while short-term breadth is recovering, the 1-month trend is flattening, not reversing, but showing early hesitation.
Longer-Term Indicators
-
Adv 3-Month (65.7%) and Decl 3-Month (33.2%) show that broader market breadth over 3 months still favors bulls.
-
Adv 25% 3-Month remains solid at 16%, holding steady from 15.7% the day before—supporting the idea that the strongest stocks continue to lead.
Comparison with October 2 Data
The steady gains across key short-term indicators confirm the pattern of stabilization already seen on October 1 and 2. The modest improvement in participation (NH, SMA%) and a slight rise in >4% gainers suggest growing confidence, although the moves are still measured rather than explosive.
The absence of strong selling pressure is another notable characteristic this week. Declining stocks, both daily and on a 3-month basis, remain moderate.
Conclusion and Trend Rating
While not overly bullish, the data for October 3 reflects a measured improvement in market breadth. There's a visible continuation of the rebound that began earlier in the week, with both the number of advancing stocks and participation in strong moves improving.
However, the gains remain fragile. Breadth hasn’t shifted decisively into "strong bull" territory. We’re seeing a slow grind higher, not a breakout.
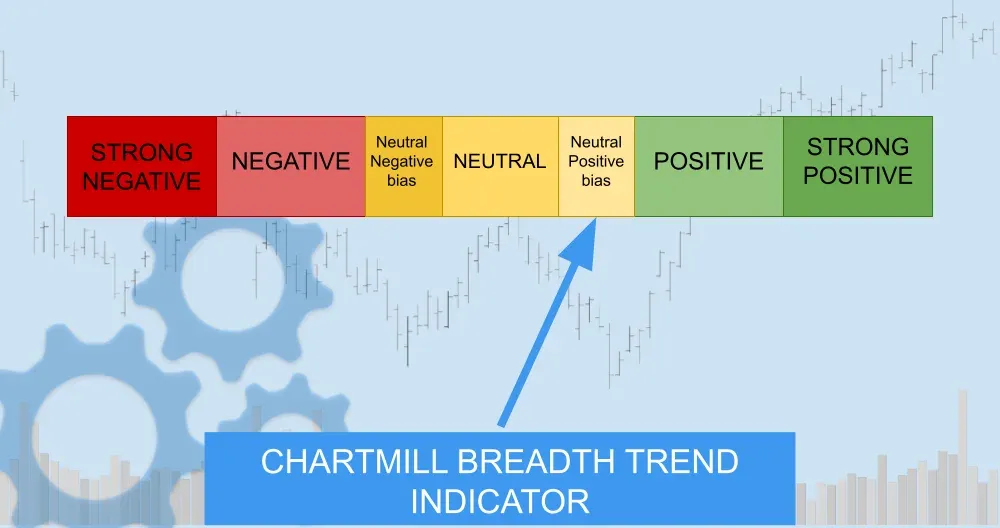
Breadth Trend Rating: Neutral – Positive Bias
Kristoff - ChartMill