Bullish Engulfing Candlestick Pattern - Definition and usage
What is a bullish engulfing pattern and how does it form?
The bullish engulfing pattern is a technical analysis Japanese candlestick pattern which is formed by two consecutive candles. The engulfing pattern occurs when:
-
A first negative (bearish) candle with a relatively small body. This is a candle whose closing price is lower than its opening price, typically this will have a red or black color on the chart.
-
This is followed by a second positive (bullish) candle. This candle opens lower than the first candle's closing price and it closes higher than the first candle's opening price. This is typically a white or green colored candlestick.
The body of the second candle thus completely engulfs the body of the previous candle, hence the name of the pattern. The second candle is the actual bullish engulfing candle.
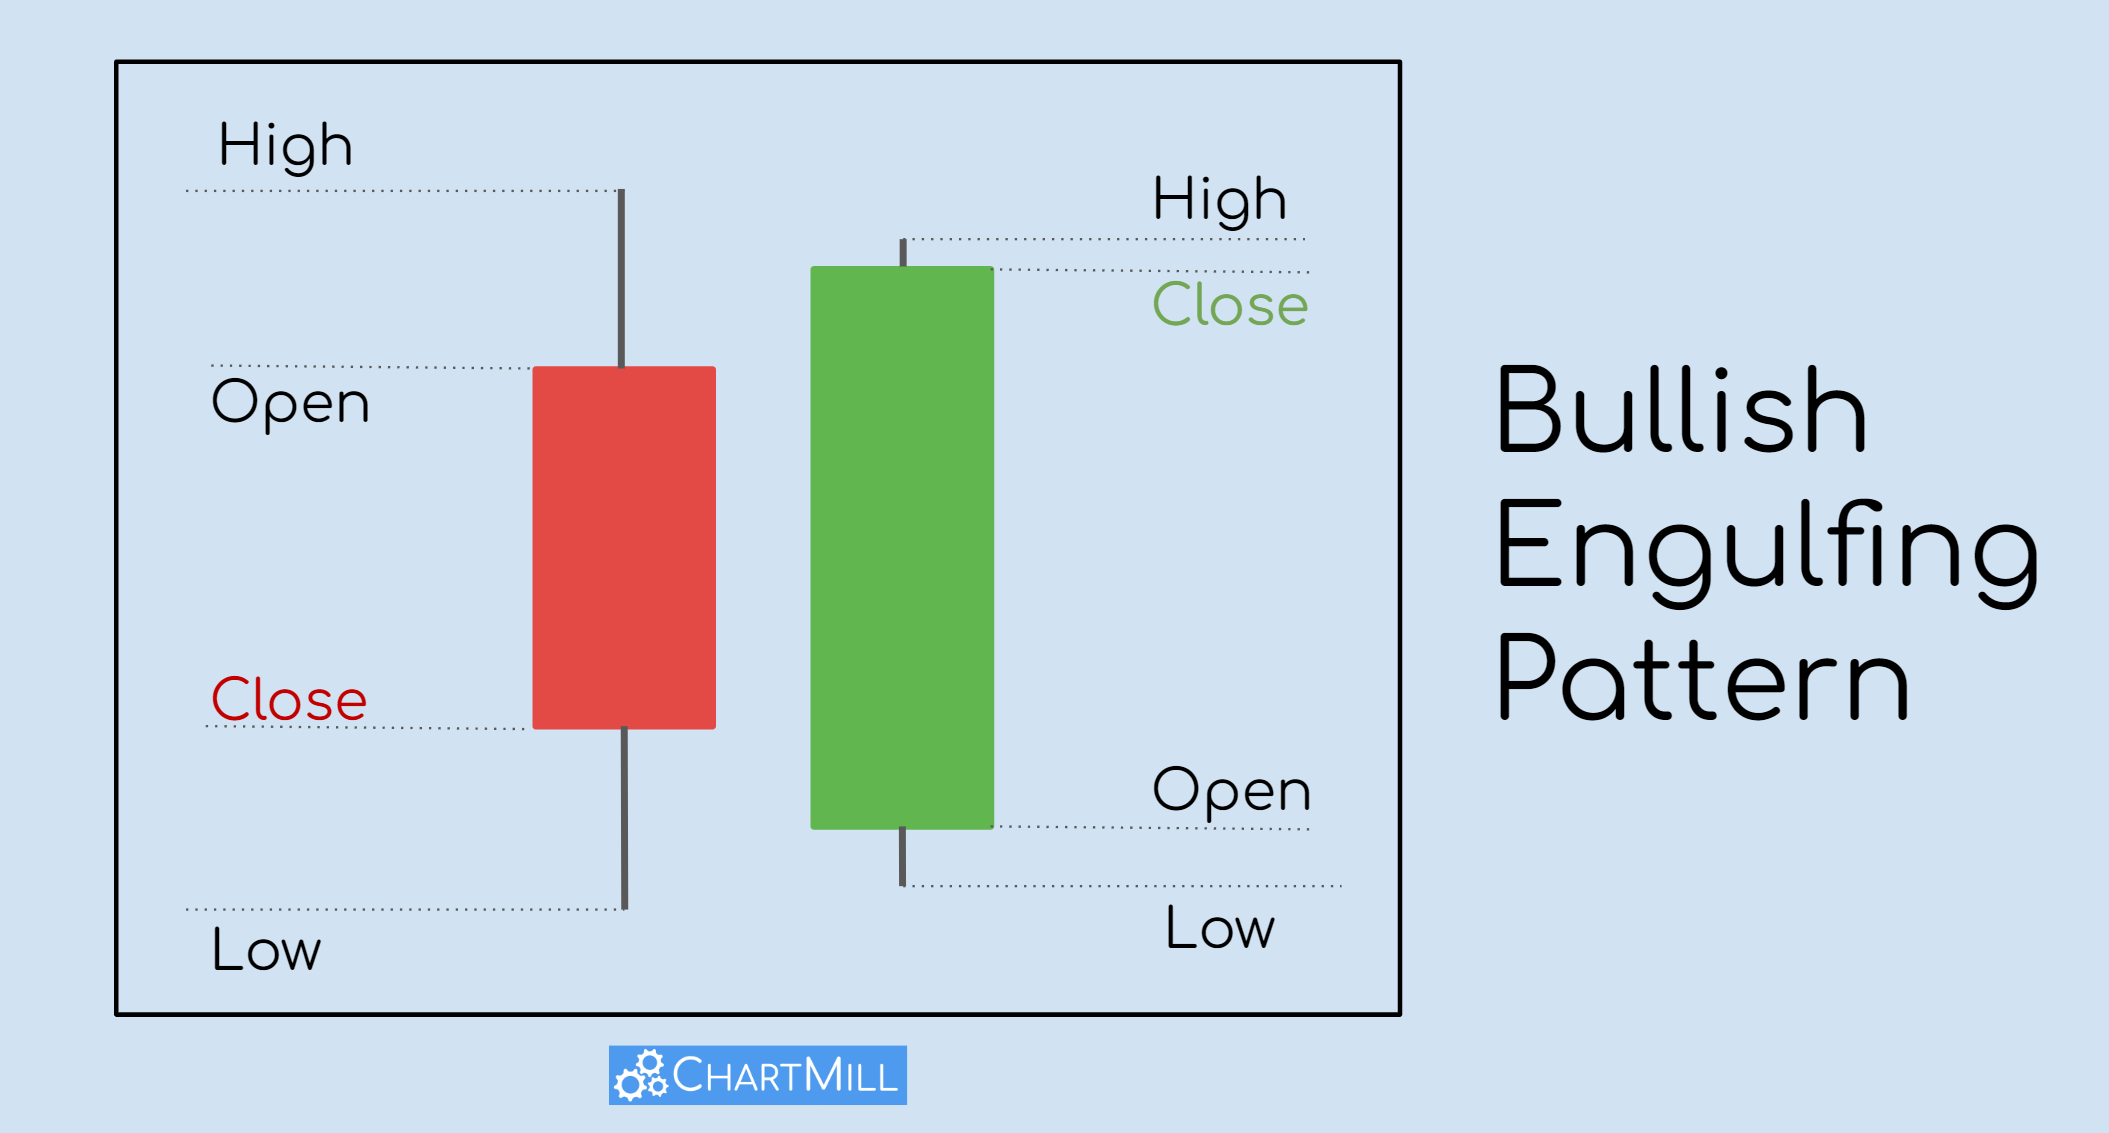
The closing price of the second engulfing candle is preferably as close as possible to the daily high. This is a clear sign of strength and increases the chance that the price will continue to rise the following day(s). So the upper shadow should be as small as possible.
The lower opening price of the second candle made many buyers purchase the stock. So the buying pressure has overcome the selling pressure which was still observed after the first red candle. This is why this may suggest a potential reversal of the trend.
In this article, you will read:
- What exactly this pattern means
- How to recognize it so that the pattern becomes more reliable and consequently more effective
- How to use this pattern as part of a profitable trading strategy
- How to find this specific candlestick combination by using the ChartMill stock screener
Prefer to watch instead of read? Check out our Bullish Engulfing Pattern Video here.
Core Insights
- The bullish engulfing is a candlestick pattern made up of two candles. The body of the second candle fully covers the body of the first candle.
- This pattern helps spot early changes in price trends. In a downtrend, it is a sign of bullish momentum.
- Traders can use it as a warning signal to protect open short positions or as an entry signal to go long.
- The pattern is more reliable when it happens at the same time as other signs on the chart. These signs also show a trend change is coming.
What does the bullish engulfing candle pattern tell us?
The pattern indicates a sudden rapid and powerful upward price movement, also known as bullish momentum. This is precisely why it is important to find out exactly where the pattern occurs.
When this pattern appears in a downtrend, it shows that the trend is losing strength. This can be a sign that a trend reversal is happening. We might be at the start of a new upward price trend.
How to increase the success ratio of the bullish engulfing pattern?
Opening new long positions solely based on this pattern is not advisable. By finding other matching elements on the price chart, you can boost the pattern's reliability. This will help improve your success rate.
Here are some examples where the pattern appears. These examples include other elements that raise the chances of a real trend reversal.
Minor Price Retracement
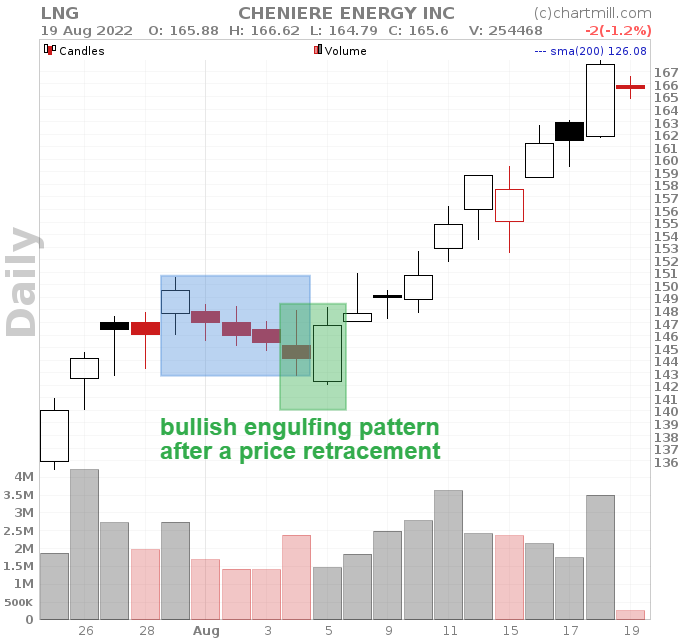
The engulfing pattern is a reversal pattern. It is important that the candles before the pattern go down. This shows that there is at least a small drop in price. The pattern finalizes the price retracement.
Long term uptrend
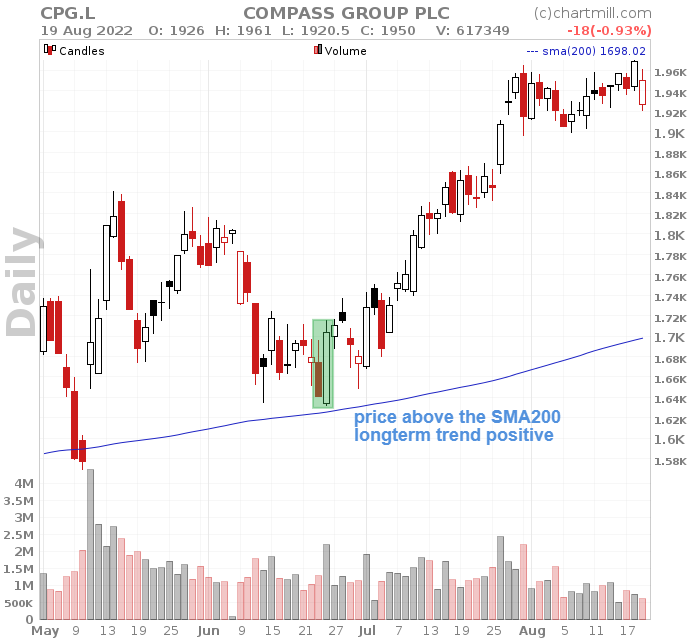
Reversal candlestick patterns in falling trends whereby the long-term trend is still bullish offer the best opportunities. After all, in this way, you are trading in the direction of the existing long-term trend.
Volume
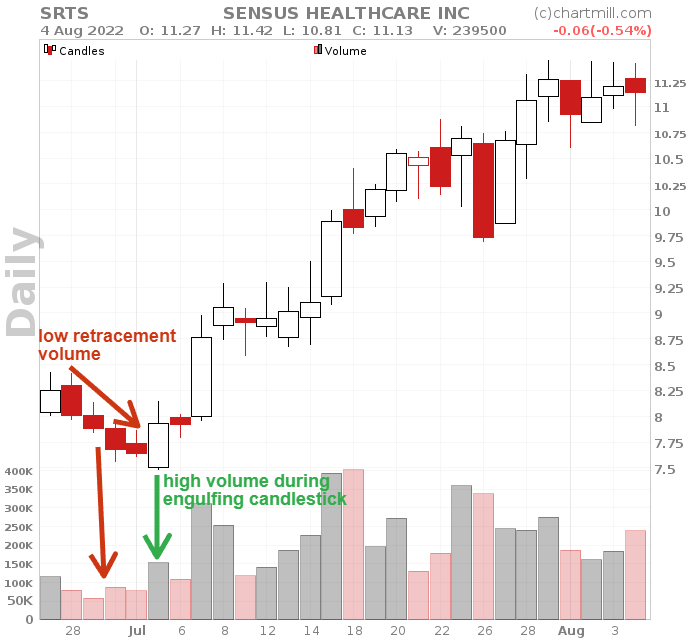
Higher volume when the second candle forms is good. This is especially true if volume was much lower during the price drop. The larger the volume, the more interest buyers have at this price level. This increases the chance of a valid reversal pattern.
Earlier support level
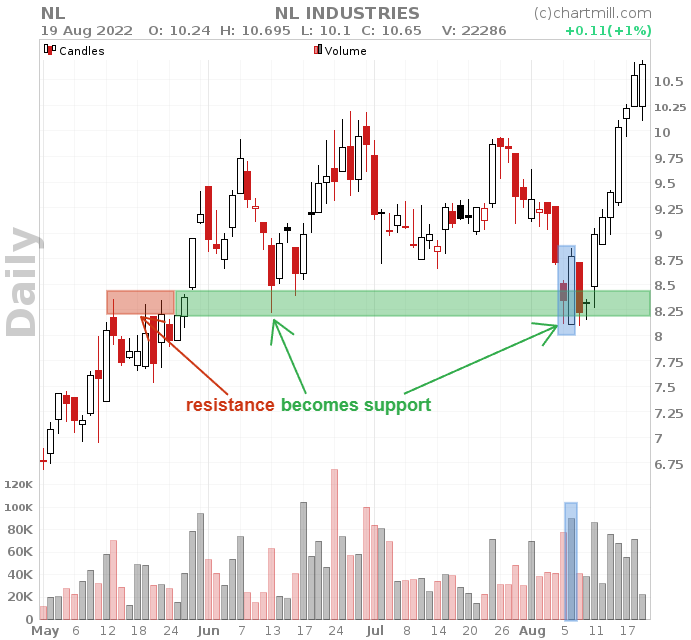
A candlestick pattern that coincides with a previously significant support level confirms its validity.
Closing price of the engulfing candle
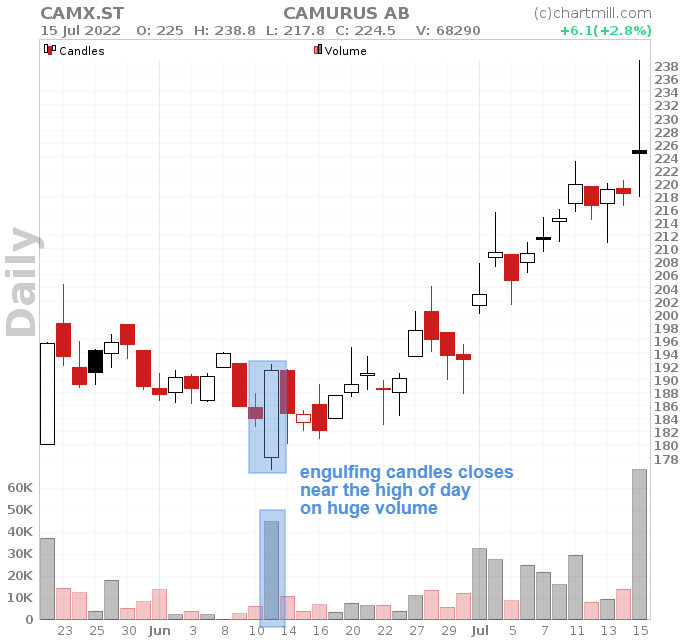
The engulfing candle should close at or near its highest price. This is an exceptionally strong sign of buying momentum. Avoid long upper tails because they typically indicate selling pressure.
How to use this candlestick pattern in a trading strategy?
The bullish engulfing pattern can be used as part of a trading strategy in two ways.
As a warning signal
When it occurs after a downtrend, the trader may have an open short position at the time the pattern forms.
If this is the case, and the trader expects a change in the price trend, he can decide to close the short position based on this pattern and thus secure his accumulated profits.
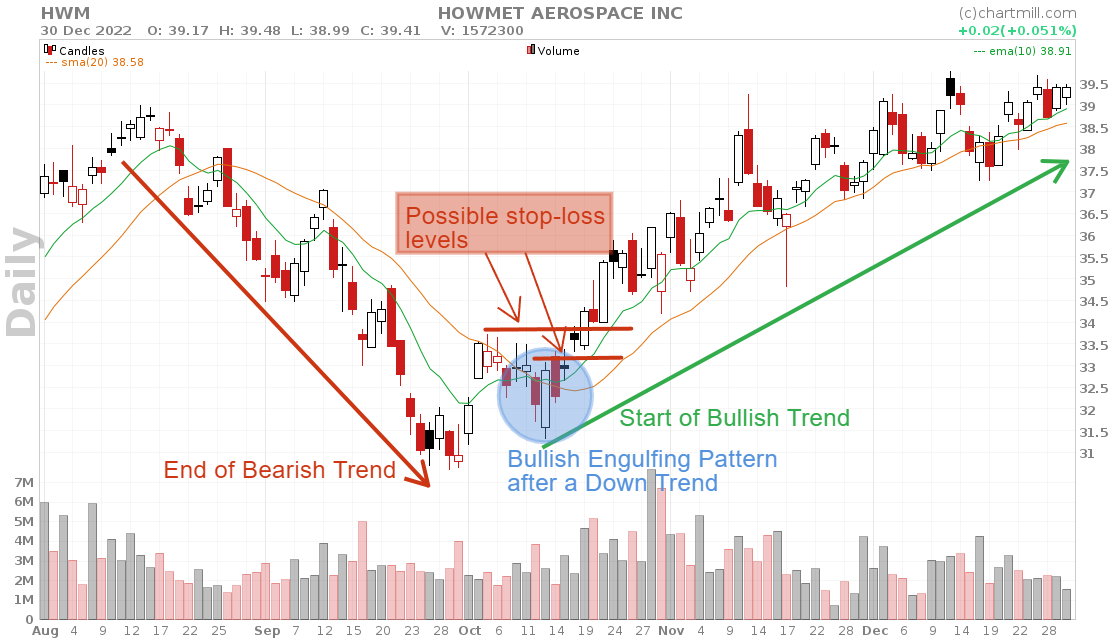
An alternative is to place a stop-loss just above the high of the bullish engulfing candle. Once the price reaches this level the short position would also be closed.
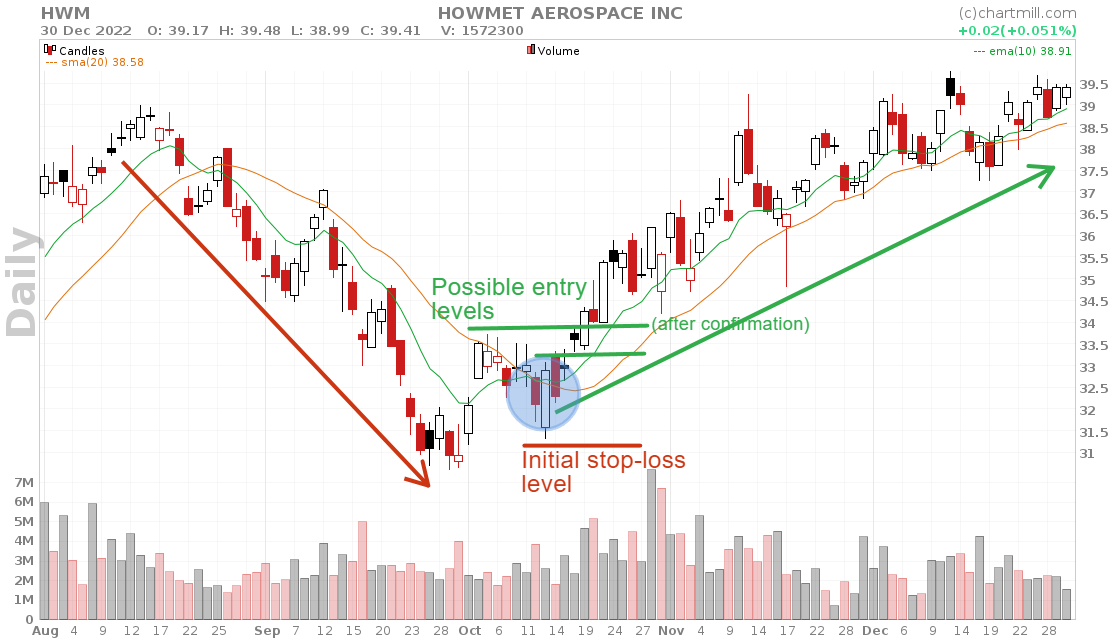
As an entry signal
Responding to the possible new bullish trend can be done by going long as soon as the pattern has formed. It is best to wait until the price goes higher than the high of the last bullish engulfing candle. This way you can at least be sure that a further upward price trend is in progress.
An even more defensive way is to wait for a confirmation candle, which is an additional green candle with a higher close after the two candles.
This is an additional indication that there is effectively a genuine trend reversal. In this way, it gives even more certainty, but the disadvantage is that you have missed a chunk of profit.
A bullish Engulfing Setup example from start to finish
Step 1: entering the market
Recognizing a good setup is not enough, you also need to know how you are going to trade the pattern and what the next steps will be once a position is opened.
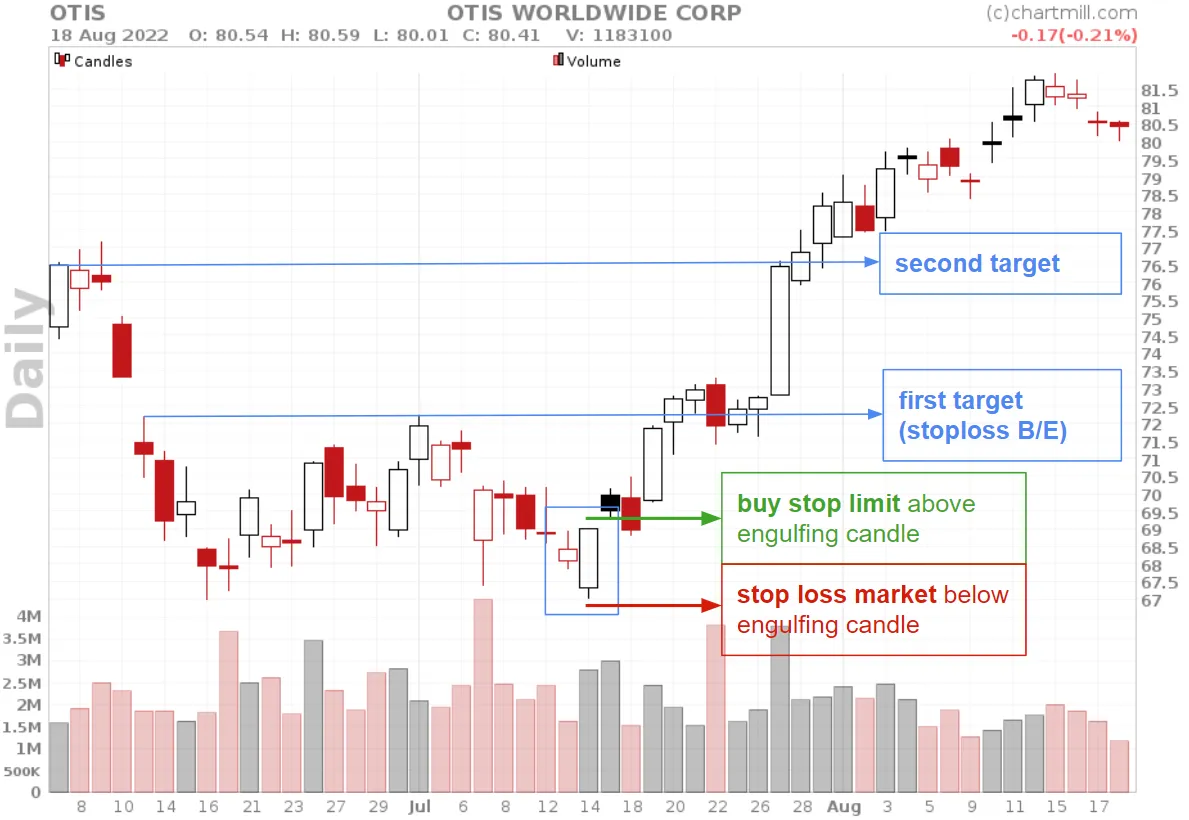
In the example above, the bullish engulfing pattern is visible on the date of July 14 where at the same time a double bottom was formed (June 16, 2022). The engulfing candle closes on the high of day with strongly increased volume. Thus, the pattern meets several converging characteristics and is of sufficient quality.
For the next trading day a buy stop limit order is placed, a few cents above the high of the engulfing candle (in this article you can read why you should use this kind of order).
Step 2: Defining your stop loss
The initial stop loss can be placed either just below the engulfing candle or below the most recent swing low. In this case it doesn't matter because in this example the low of the engulfing candle is at the same time the most recent swing low.
Step 3: Managing your trade: defining breakeven and/or profit levels
First resistance is visible at the $72.5 price level, this represents the first price target. When the price reaches this level, you can choose to bring your stop loss to breakeven and perhaps sell part of the position. After a short period of consolidation the price goes further up and also the second target is reached where you can again sell a portion or the entire remaining part.
By focusing only on the best patterns and making sure that your average winners are larger than your loss positions, you will be able to trade this pattern consistently and profitably.
And remember…
No signal is 100% perfect, so even if you only withhold the best setups, you will face loss positions. In the same chart earlier on, there was a similar pattern that failed.
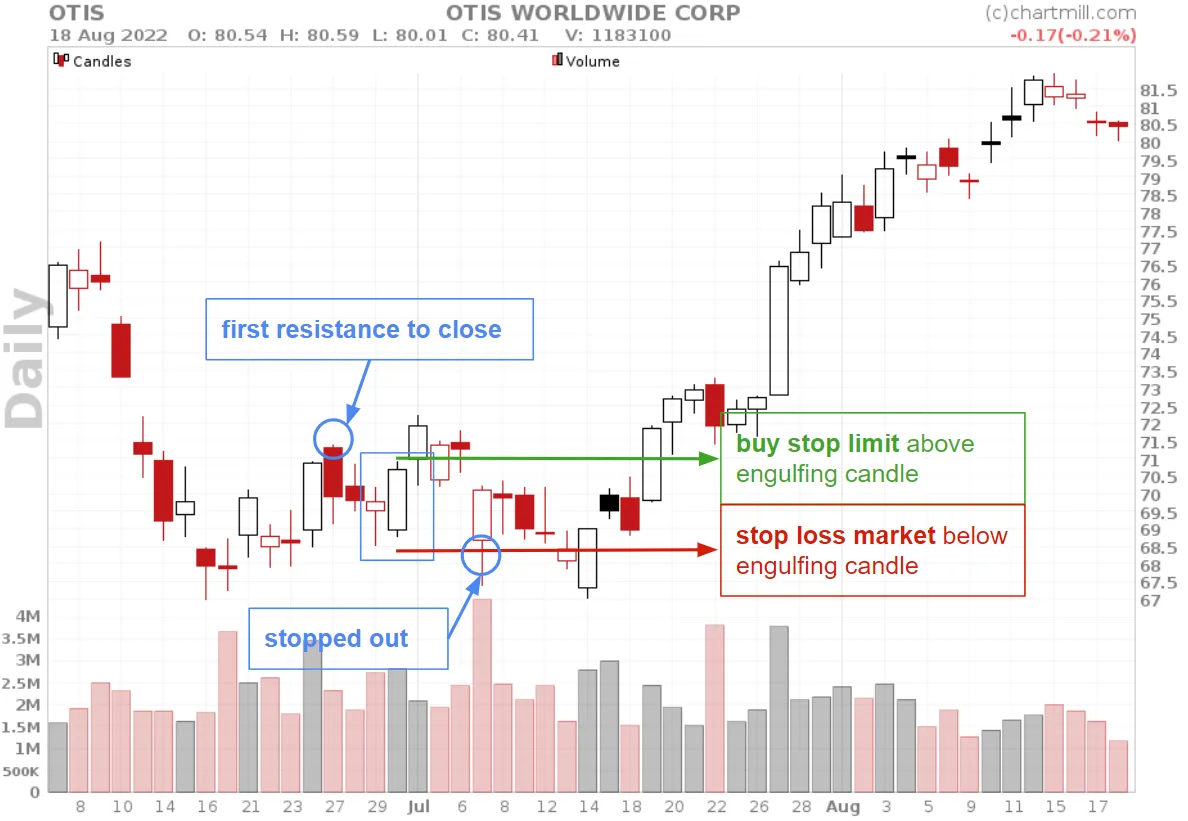
This pattern was of lower quality anyway, as there was still resistance slightly above the entry level. Initially the price did go up, but eventually you would have been stopped out a few days later. However, that loss was more than compensated by the second trade, where the second target had a risk/reward of more than 3.
Using the ChartMill stock screener to filter bullish engulfing patterns.
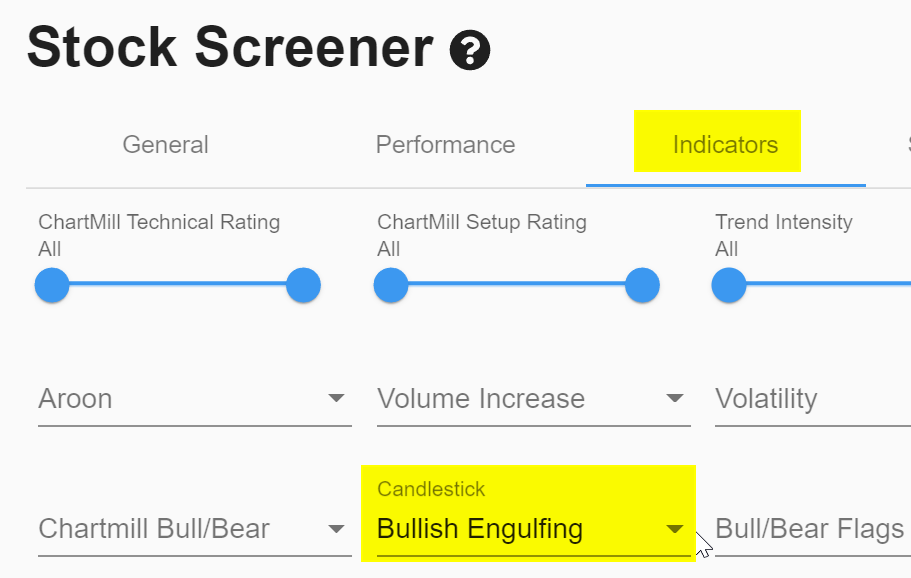
ChartMill has a built-in feature that automatically recognizes bullish engulfing patterns, both on the weekly and daily chart. You can access it on the stock screener page via:
- TA Indicators menu > Candlestick > 'Bullish Engulfing' or 'Weekly Bullish Engulfing'.
If you choose 'weekly bullish engulfing', make sure the timeframe of your chart is set to 'weekly' to recognize the candlestick pattern on the chart.
This way you will quickly get an initial selection of stocks where the pattern has just formed. Keep in mind that with this candlestick filter, ChartMill only recognizes the pattern but does not take into account other elements such as trend, volume,...etc.
If the list of stocks is substantial, you can add additional filters to further refine the selection.
A few possibilities are:
- TA Indicators menu > ChartMill Trend > Long-Term Negative and/or Short-Term Negative
- Performance menu > Signal > New 5-day lor or new 10-day low today
Another way could be to make sure that only patterns are retained whose second candle showed a strong rise with higher volume than the first candle of the pattern.
You can set the following additional filters:
- Performance menu > %change > at least 3%
- TA indicators menu > Volume Increase > Volume More Than Prev Volume
Keep in mind that the more filters you add, the smaller the number of results becomes. Depending on market conditions, ChartMill may or may not be able to find setups.
Pros and Cons when using the Bullish Engulfing Candlestick Pattern
| Pros | Cons |
|---|---|
| It is easy to spot and can be used in multiple timeframes. (So suited for swing trading, day trading and position trading) | Trading only the most qualitative engulfing patterns requires some experience. |
| Occurs frequently on the chart, so more than enough trading opportunities. | Because the bullish engulfing pattern is frequent, the enticement to trade (too much) is considerable. |
| Decent risk/reward ratio due to short stoplosses. | Short stoplosses will be hit faster, so it is important that winners are larger than the losers to compensate. |
Difference between a bullish and a bearish engulfing candle?
The bearish engulfing pattern is the opposite of the bullish engulfing candlestick pattern. It occurs after a bullish trend.
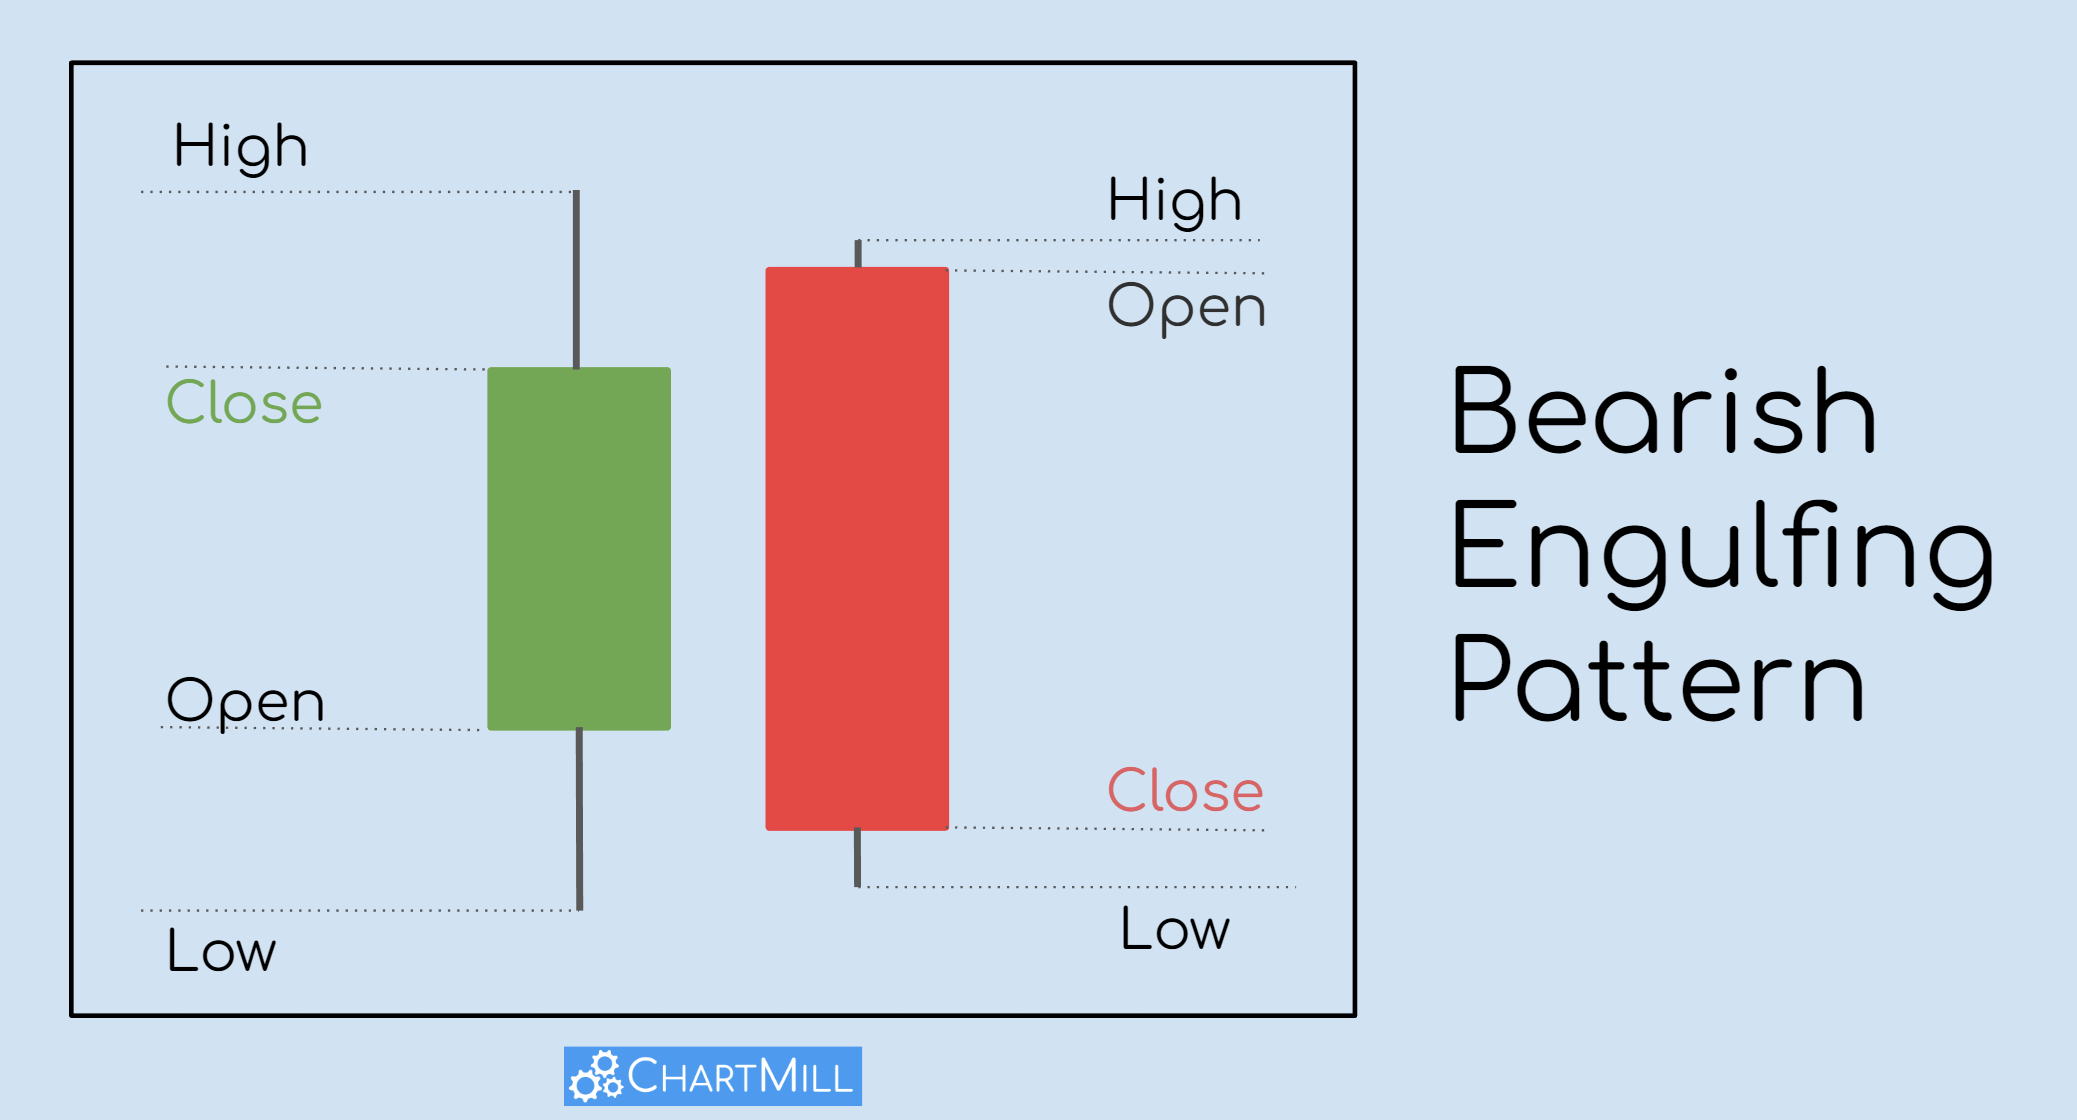
The pattern consists of an initial small bullish candle that is followed by a red downward candle that completely encircles the first candle. The opening price of the bearish engulfing candle is initially higher than the closing price of the first candle, but the closing price of the second candle is finally lower than the opening price of the first candle.
This is a clear signal of bearish momentum which increases the probability of a further decline in the following days.
FAQ
What is a bullish engulfing pattern?
A bullish engulfing pattern is a well-known Japanese candlestick pattern formed by two consecutive candles with the following characteristics:
- A first negative (bearish) candle with a relatively small body. This is a candle whose closing price is lower than its opening price.
- Followed by a second positive (bullish) candle. This candle opens lower than the first candle's closing price and it closes higher than the first candle's opening price.
So the bullish second candle body completely surrounds or engulfs the previous day's downwards candlestick, signalling the start of a fresh upward movement.
Is the bullish engulfing pattern reliable?
Several scientific studies have appeared in the past trying to figure out whether engulfing patterns and other Japanese candlestick patterns have predictive value. Their resuls have been mixed.
This is because much depends on how these patterns are tested. Is the trend in which the pattern occurs taken into account? To what extent is volume factored in? How significant is the difference in body size between the first and second candles and how does this affect pattern reliability? What criteria are used to determine whether or not a pattern is successful? Etc...
As mentioned in the article, you can significantly improve the success rate of the formation by taking into account other elements on the chart which simultaneously point in the direction of a trend reversal. The more confirmation you see on the chart in this way, the greater the chance that there is indeed a valid pattern.
What happens after the bullish engulfing pattern?
A bullish engulfing pattern may indicate a potential reversal from a downtrend to an uptrend. After the pattern formation there are no guarantees. While the formation of the pattern confirms buyers are stepping in, you need to monitor how the new trend unfolds.
Is bullish engulfing pattern good or bad?
The bullish engulfing pattern is a positive sign, assuming one wants to see an uptrend in the stock.
What's the difference between a bullish and a bearish engulfing candle?
The bearish engulfing pattern is the opposite of the bullish engulfing candlestick pattern. It occurs after a bullish trend.
The bearish pattern consists of an initial bullish candle, followed by a red downward candle that completely encircles the first candle and is considered negative, while the bullish engulfing is considered positive.