Discover a collection of proven stock screener ideas and trading strategies based on real-world experience, popular investing books, and insights shared by the ChartMill community. Each setup offers a quick starting point for your own screening — from technical breakout and pullback screens to fundamental growth and value filters. Use the filters below to browse through different trading styles, timeframes, and market focuses — and quickly find screeners that match your own strategies and preferences.
Breakout Screens - Good Technical and Setup ChartMill Ratings
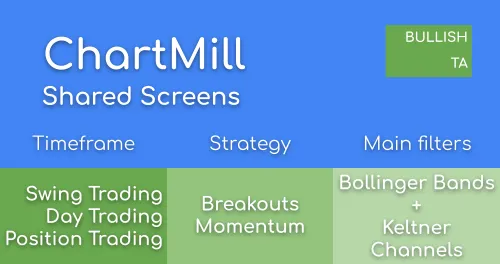
The Technical Breakout Setups will filter for stocks with a good Technical Rating and a good Setup Rating, leading to a list of breakout setups in the best performing stocks in the market.
This screen finds squeeze play setups on stocks that are in a strong uptrend. A squeeze play setup occurs when the Bollinger Bands are inside the Keltner channels. When this happens, the stock has been trading in a narrow range for a while. A major move could happen when the stock breaks out of this trading range.
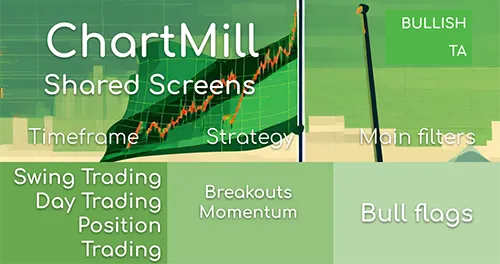
This screen finds bull flag patterns. A bull flag is a technical continuation pattern which can be observed in stocks with strong uptrends. The pattern takes shape when the stock retraces by going sideways (or by slowly declining) after an initial big rise in price. When you see the graphical representation of this pattern, you’ll notice that it somehow looks like a flag on a pole.
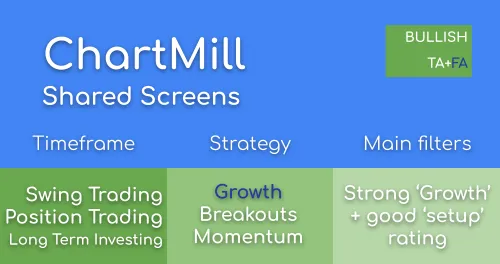
Strong Growth Stocks with good Technical Setup Ratings
The Strong Growth Stock Technical Setups combines Technical and Fundamental analysis and will filter for technical breakout patterns in stocks which are growing strongly while having decent profitability and health.
Momentum Screens - High Trend Intensity on Increased Volume
This screen finds stocks in a strong trend that are moving on increased volume. There is not necessarily a good entry point, if not it may still be interesting to put these stocks on a watch list.
Breakout Screens - Near 52 week High + High Relative Strength
This screen finds strong stocks near a new high. This list allows you to find stocks 'about to make a new high'. Good bases still need to be found either by further filtering or by manual inspection.
This screen finds stocks that have a long upper weekly chartmill channel. The stock is currently trading near the upper channel line. The channel line acts as resistance, when the stocks breaks this resistance a possible strong move may follow.
This is a base stock screener configuration for the CANSLIM system introduced by William O'Neill. It is intended as a starting point and the settings are discussed in more detail in the linked article. CANSLIM is a system with strong fundamental criteria related mostly to EPS growth, but also has some pure technical requirements as well as entry and exit rules.
The Decent Value Stocks screen is a Fundamental (FA) screen which will filter for stocks with a good fundamental valuation, while still showing decent profitability, health and growth.
The Affordable Growth screen will filter for stocks which are showing good growth, decent profitability and health and are not overvalued from a fundamental perspective.
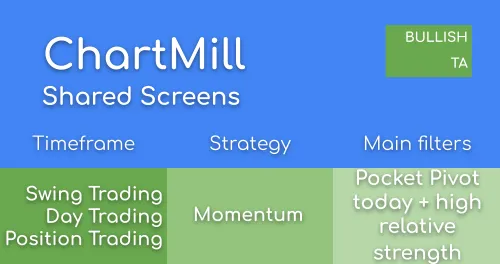
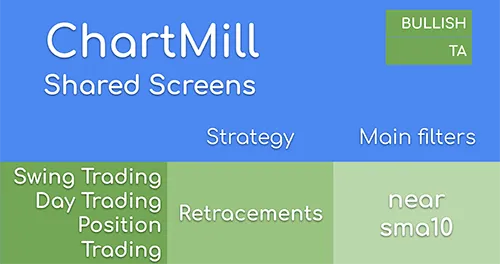
This screens searches for Pocket Pivots in Strong stocks that happen near the SMA(10). A pocket pivot is a positive sign of price/volume behavior. Whether the stock is a buy or not remains to be judged on a case by case basis.
This screen finds stocks that are being bought by large players based on the Effective Volume indicator. Whether the stock offers a good entry point is to be determined on a case by case basis.
This screen finds bear flag patterns. A bear flag is a consolidation after a strong move down. The downtrend may continue when the stocks moves out of the consolidation zone.
Breakout Screens - Finding Narrow Trading Ranges using ChartMill Channels
Find strong stocks in the market that are in a narrow trading range. We use Chartmill Channels to determine the trading range. By using the Chartmill Technical Quality Score we make sure to select stocks that are in an uptrend and technically solid.
Dividend Screens - Best Dividend Stocks using the ChartMill Dividend Rating Filter
The "Best Dividend Stocks" screen uses the ChartMill Dividend Rating to find the best stocks for dividend investing. The dividend rating takes into account reliability and sustainability of the dividend. We also use the health and profitability ratings to make sure only solid stocks are selected.
An Ascending Triangle Pattern is a bullish pattern and is formed when the price is trapped between horizontal resistance above and an upwards support trendline.
This screen finds reversals at the Bollinger Band for Swing Trading. A swing trade can be made in the direction of the reversal. The screen uses custom expressions to determine the reversal condition at the Bollinger Band.
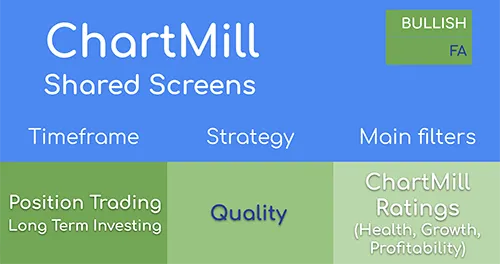
Caviar Cruise Full - Finding Stocks for Quality Investing
This screen also has a base version, but in this version we added some additional criteria to find stocks which qualify for quality investing. Quality investors only invest in the best and most profitable companies available. The screener can filter for criteria which are quantifiable, but besides this more research should be done on the results. Make sure to check the linked article for more information on quality investing and the screen.
I have found this scanner to find good, volatile, low-priced stocks that has made an explosive move, pulled back slightly and about to make a low (reverse back up)
Valuation/Quality Screens - Undervalued Stocks with High Piotroski F-score
This screen lists stocks with a high Piotroski F-score (8 or 9), while having a low Price/Book value and a good ChartMill valuation rating. So we are looking for quality companies which are undervalued.
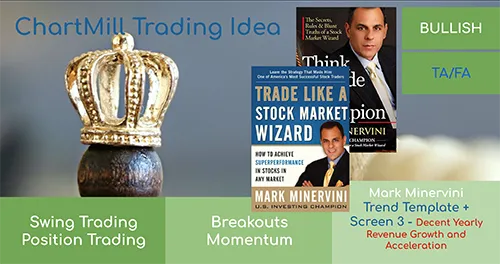
The screens filters for stocks which meet the Minervini Trend Template and have a ChartMill High Growth Momentum score of at least 6.
The trend template makes sure the results are stocks which are in an uptrend, not too far of their highs and well above their yearly lows.
The ChartMill HGM rating assures the results show high EPS and Sales growth and acceleration.
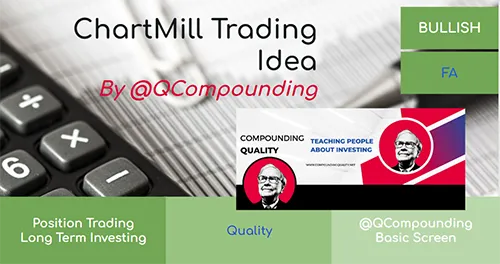
A screen as described by Compounding Quality (@QCompounding), a former professional investor. The screen focusses on quality stocks with low capital intensity and generating increasingly large free cash flows. A detailed description and discussion of the screen can be found in the linked article.
Momentum Screens - Recent Pocket Pivot in Strong Stocks
This screen finds strong stocks with at least one pocket pivot in the last 5 days. Whether an entry is possible should be judged on a case by case basis.
This screen is based on the Trend Template (TTP) by 2 times US Investing Champion Mark Minervini. He uses the Trend Template as the first step for his stock selection. The criteria are described in his book "Think and trade like a stock market wizard" : The current stock price is above both the 150-day (30-week) and the 200-day (40-week) moving average price lines. The 150-day moving average is above the 200-day moving average. The 200-day moving average line is trending up for at least 1 month (preferably 4–5 months minimum in most cases). The 50-day (10-week) moving average is above both the 150-day and 200-day moving averages. The current stock price is trading above the 50-day moving average. The current stock price is at least 30% above its 52-week low. The current stock price is within at least 25% of its 52-week high (the closer to a new high the better). The Relative Strength ranking (RS ranking) is no less than 70.
The Peter Lynch Strategy is a long term investing strategy, combining growth and value: finding decent stocks which are able to grow to hold for the long term, while not overpaying.
The little book that makes you rich - growth stocks
This configuration of the stock screener was created based on the rules described in the book "The little book that makes you rich", by Louis Navellier. The book defines eight criteria that should be met before a stock qualifies as growth stock which fits the system. These eight rules were converted into screener settings and there is a linked article available which discusses this screen a bit deeper.
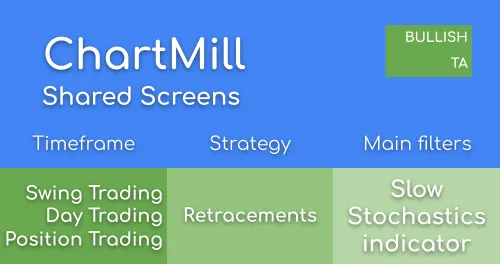
This screen is for stocks under $20 that are oversold on Slow Stochastics and are extremely close to the 20 day EMA. Many stocks ride along their 20 day EMA so using candle signals and this screen will help find long reversal candidates. The 8 EMA is the T-Line (Trend Line) inspired by candlestick authority Stephen Bigalow from his online chats. This line will alert you early to a potential trend change.
In this screen we apply some basic filters to find stocks which qualify for quality investing. Quality investors only invest in the best and most profitable companies available. The screener can filter for criteria which are quantifiable, but besides this more research should be done on the results. Make sure to check the linked article for more information on quality investing and the screen.
This screens finds potential Breakout setups in High Growth Momentum stocks.
At the same time it demonstrates the power of the ChartMill Rating by just using 3 filters: we find stocks which are high growth stocks (HGM rating above 6), with decent technicals (TA rating above 7), which show a setup pattern (setup rating above 7).
A screener inspired by the work of Terry Smith, founder of Fundsmith. The screen finds quality companies while also taking into account a fair pricing. The output is meant to be investigated deeper for long term buy and hold.
This screen finds stocks that are being sold by large players based on the Effective Volume indicator. Whether the stock offers a good short entry point is to be determined on a case by case basis.
This screen implements the strategy of Martin Zweig as described in the book "Winning on Wall Street". The strategy focusses on Growth stocks at reasonable price (GARP) and has also looks at the general market performance as well as the relative price performance of the individual stocks. Check the linked article for more details.
Detect early buying and positive divergence between large players volume and a sideways moving stock. The idea is to pick up rising large player volume and a rising Twiggs Money Flow, while the stock is still trading sideways. Great way to get ahead of big moves.
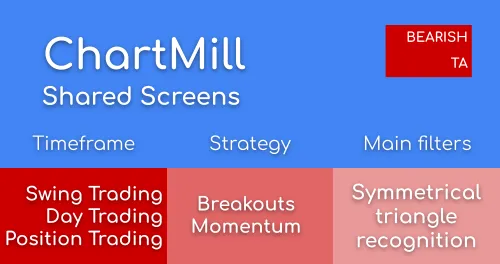
The Symmetrical Triangle Pattern can be considered both Bullish and Bearish and occurs when price is trapped between a declining resistance line and a rising support line.
An implementation of the 'Tiny Titans' screen by James O’Shaughnessy, as published in the book "Predicting the Markets of Tomorrow". The screen finds micro cap stocks with a low Price/Sales ratio and sorts them by relative strength.
The Qullamaggie episodic pivot setup is a highly effective strategy for identifying stocks that showed significant upward momentum following a major catalyst.
I use this screen to find stocks nearing support with upward trend. I buy the stock in lots and if stocks continues to fall I buy and average down. I also look closely at energy stocks and mining stocks. Stocks that correlate with the oil and gold market.
Volatility contraction and secure entry point inspired by Minervini
The VCP by Minervini (author of the book "Trade like a stock market wizard") is very similar to the concept of classic volume dry ups from CANSLIM by O'Neil. Many VCPs are similar to classic cup & handles, but the focus is on shares with multiple contractions, which is why they look like mini-cups with many handles (T3, T4 ...). The background is that with each contraction more shares move from weak to strong hands.
This screen looks for stocks that match the secure entry point analysis as closely as possible, meaning that they are in an uptrend and between the 52-week lows as highs, but just completing a pullback under volatility contraction. Relative strength must be high and some level of growth must be present. Fortunately, Chartmill offers a very powerful Growth and RS Rating that is applied here and I recommend everyone to experiment with it.
The idea of the screener is to find stocks that fit these criteria and thus pre-select them for a potential swing or position trade. The screener looks for stocks that are in a consolidation. An entry into such stocks can be a high volume trendline breakout from a contraction pattern and cannot be determined without classical charting.
As an example, it was possible to find the pattern in TSLA in 11.2020.
This strategy works best in bull markets with institutional demand for high-growth stocks.
This screen finds stocks that are nearing a long lower chartmill channel line that acts as support. This screen finds short setups: when the channel is broken, a possible strong move down may follow.
This screen shows stocks that have experienced a sharp decrease in price in a short time and are therefore at least 9% away from their 10-day moving averages and where the RSI2-indicator is extremely oversold (<10). This makes these stocks ideal candidates to look for mean reversion LONG setups on the assumption that the price will at least temporarily move back towards the average price. Remember that these candidates are merely watchlist setups. Confirmation is still needed, so be sure to read the article below that explains exactly what the strategy entails and how to apply it. Trade safe!
A bull flag is a technical continuation pattern which can be observed in stocks with strong uptrends. The pattern takes shape when the stock retraces by going sideways (or by slowly declining) after an initial big rise in price. When you see the graphical representation of this pattern, you’ll notice that it somehow looks like a flag on a pole.
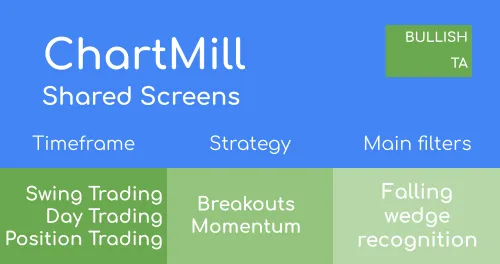
A falling wedge pattern is considered a reversal pattern within technical analysis. The wedge formation consists of a support and resistance line running in the same direction (downwards) but with different slopes. The formation gradually narrows until eventually the upper trend line is broken, leading to a buy setup.
Aimed at identifying stocks with the foundational characteristics of a potential short squeeze, using basic filters like short float%, short interest, minimum price and average daily volume.
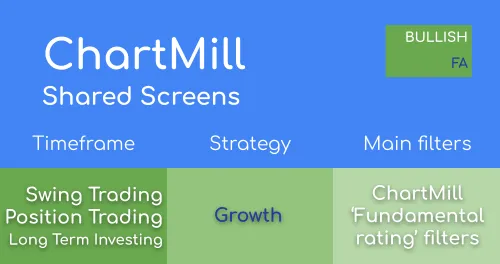
A trading idea created from a combination of fundamental and technical individual filters to find promising and financially sound growth companies with a market capitalization of up to maximum 10 billion (small & mid caps).
Low float stocks are stocks with a relatively small number of shares available for public trading. These kind of stocks can offer incredible profit opportunities, but they also come with significant risks.
Can Christopher Mayer’s legendary "100-Bagger" principles be automated? This 'Trading Idea' explores the transition from the theory of 100-to-1 returns to a functional, quantitative screener.
Focuses on fine-tuned parameters for stocks on the verge of a squeeze and Includes additional filters like float < 20M, short interest ratio > 5, recent price breakout, and days to cover > 3.
This screen shows stocks that have experienced a sharp increase in price in a short time and are therefore at least 9% away from their 10-day moving averages and where the RSI2-indicator is extremely overbought (>90). This makes these stocks ideal candidates to look for mean reversion SHORT setups on the assumption that the price will at least temporarily move back towards the average price. Remember that these candidates are merely watchlist setups. Confirmation is still needed, so be sure to read the article below that explains exactly what the strategy entails and how to apply it. Trade safe!
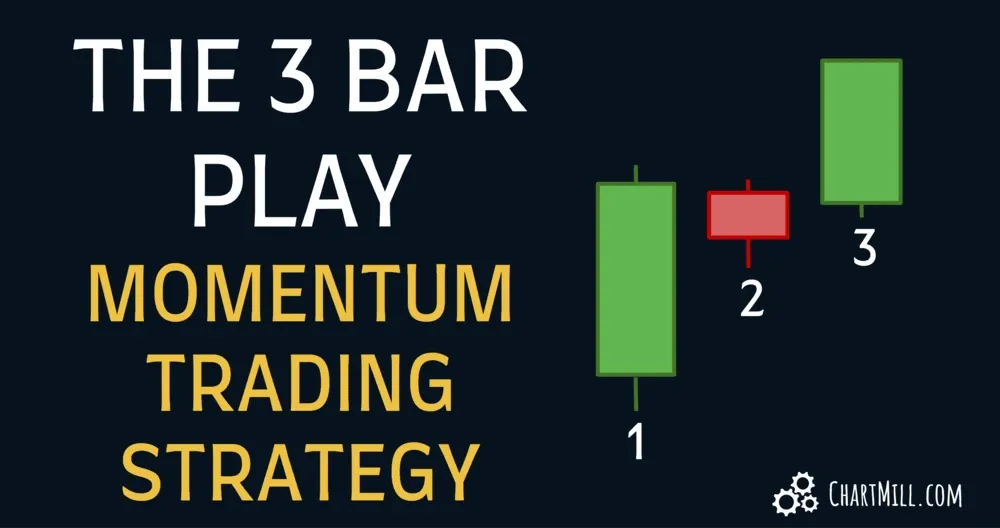
The 3 Bar Play is a bullish continuation pattern that appears after a stock has made a strong directional move. It signals that a brief pause in price is likely to be followed by a continuation in the same direction.
This screen shows stocks that have experienced a sharp increase in price in a short time and are therefore at least 9% away from their 20-day moving averages. This makes these stocks ideal candidates to look for mean reversion SHORT setups on the assumption that the price will at least temporarily move back towards the average price. The stocks you have witheld from this screen can be added into your actual trading platform, ready for the next trading day.
Be sure to read the articles below and watch the accompanying video that explains exactly what the strategy entails and how to apply it.
Good luck!
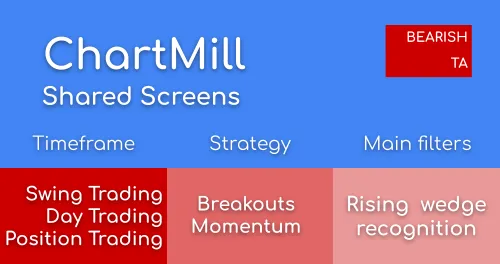
A rising wedge patterns is considered a reversal pattern within technical analysis. The wedge formation consists of a support and resistance line running in the same direction (upwards) but with different slopes. The formation gradually narrows until eventually the lower trend line is broken, leading to a sell setup.
This screen shows stocks that have experienced a sharp price drop in a short time and are therefore at least 9% away from their 20-day moving averages. This makes these stocks ideal candidates to look for mean reversion LONG setups on the assumption that the price will at least temporarily move back towards the average price. The stocks you have witheld from this screen can be added into your actual trading platform, ready for the next trading day.
Be sure to read the articles below and watch the accompanying video that explains exactly what the strategy entails and how to apply it.
Good luck!
Mean Reversion Screens - Failed Breakouts above 52 week High
This screen looks for stocks that have broken through their 52-week high within the past five days but have fallen more than 2% on the most recent trading day while closing lower than the previous trading day's low. In addition, the previous trading day must have ended positively.
The Symmetrical Triangle Pattern can be considered both Bullish and Bearish and occurs when price is trapped between a declining resistance line and a rising support line.
This screen shows companies offering the highest dividend yields (minimum 8%). Keep in mind that high-dividend stocks are not without risk. Be sure to read the article "evaluating stocks for dividend investing" for more detailed information (see Related Articles and videos below).
The Aroon indicator measures trends, but can also be used to spot consolidations. When both Aroon levels are low (below 30 in this case) it means that the stock has not made a new short term high or low in a while. Therefor it is trading in a price range and it could be an interesting trade when it breaks out of this range.
A broad selection of quality stocks can easily be found by using the ChartMill Fundamental Ratings. We need stocks with great health and profitability, while also showing decent growth. You can find tune the list with some additional quality filters or use the valuation Rating to find stocks at an attractive valuation.
We look for shortterm setbacks of stocks in strong longer term trend. You can choose also to invest in installments .
1/3 when signal is fired ( Stock pops up in screen ) 1/3 when the signal is confirmed by the stocks move, 1/3 when the stocks resuming of the uptrend is fully confirmed by a new high.
Portfolio Approach : You could buy the first ten stocks with the strongest Chartmill fundamental ratings i.e.
Use position sizing based on volatility ( ATR ;10) to determine how much to invest. Finally, use trailing stops to secure any profits and avoid too much losses. Exit : You can sell the 1. 1/3 of a position once it is well in the plus zone, thereby enjoying a free ride for the rest of the position and generating liquidity for the next stock. Check daily or weekly , but let your profits run and tighten your stops once you're in trade. You might get stopped out early sometimes though. Some traders use mental stops, but with 10 positions this might be difficult to to manage
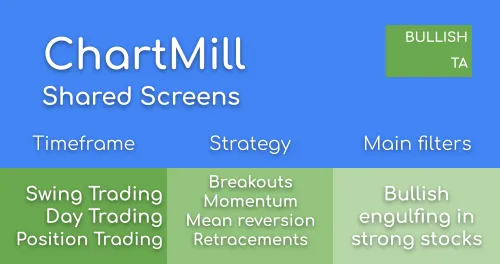
This screen finds reversals at the Bollinger Band for Swing Trading. A swing trade can be made in the direction of the reversal. The screen uses custom expressions to determine the reversal condition at the Bollinger Band.
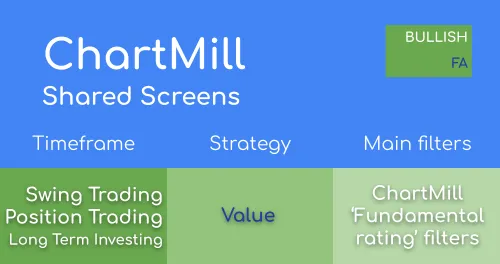
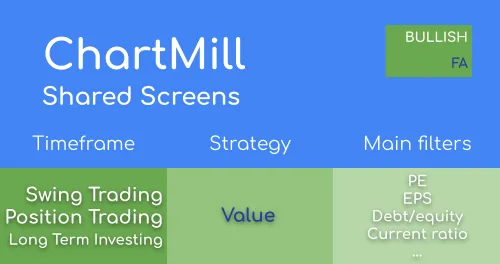
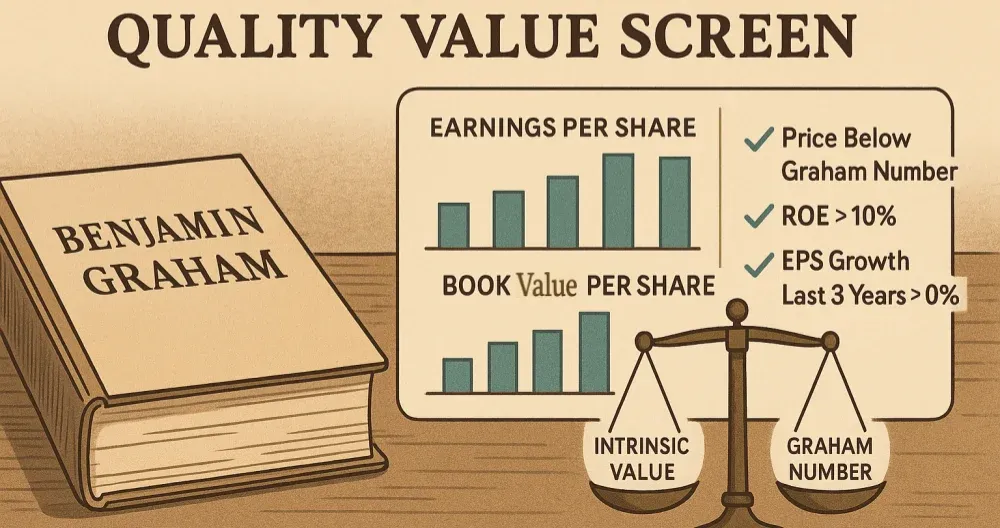
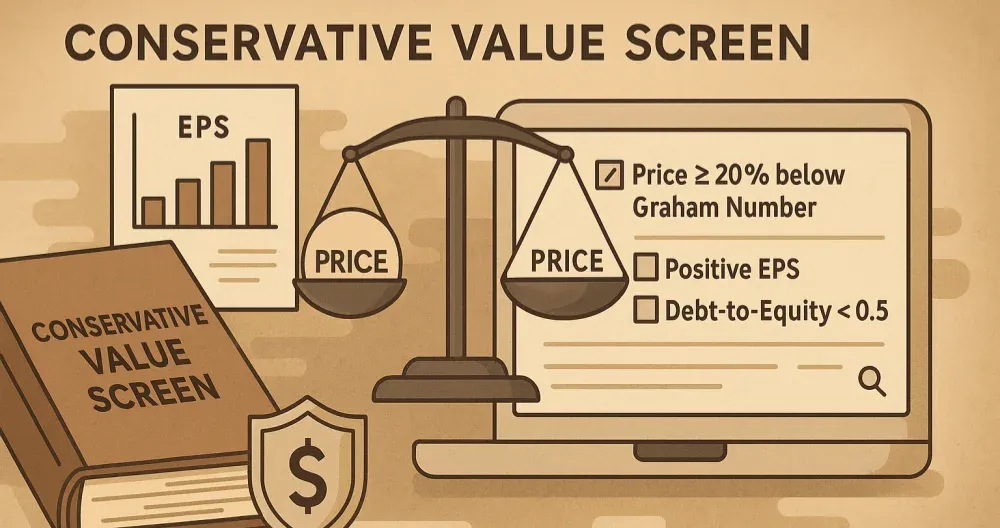
This screen provides a selection of stocks that may be of interest to the value investor. Be sure to read the accompanying article for more detailed explanations regarding the use of the filters.
Low volatility squeeze daily breakout in any direction
depending on the momentum of adx and dmi this volatility squeeze can bring a high return if found on the lower end of the linear regression on the weekly chart or at least on the bigger time frames if you're trading on a shorter time frame
Stocks with a bullish indicator and rising stochastic. Look for bullish confirmation for entry, price should rise and not fall below half way point of the bullish candle in order to enter / stay in. Even better if price is greater than 50 SMA. Watch price action at 50 SMA and 200 SMA
The Filter is aimed to enter trade to have no more than 4% loss. All trades taken on this filter should have at least 1:2 ratio minimum gain or more. Its important to respect the stop loss rule.
Overall the filter looks for leaders in the last 3 months with at least 20% or more gain (you can chang it to 30% during solid bull run).
The 10 day SMA should be above 20 day SMA to indicate a short term and trend to a continued upside.
with no earnings in the next 2 weeks guarantees no surprise gap down of the stock and makes the stock at least 2 week hold candidate.
The stock should be on the up above 10 day SMA so that the entry is done on the up day.
As described by Gilbert Morales and Chris Kacher in their books on the O'Neil Disciple, the Pocket Pivot is an early buy point. This screener looks for strong stocks (with a high chartmill RS rank and near the 52 week high) with a pocket pivot off the 20-sma in the last 5 days that have made a pullback into the pocket pivot.
According to Mr. Morales, it is recommended to buy as close as possible to the low of the pocket pivot. Since this is a screener that puts pocket pivots in a breakout context, it is important for the trader to have a constructive base. Since this screener looks for stocks that are in 2% range to their 10-sma and 20-sma, some sideways consolidation should have taken place at these averages.
Based on VPA's concept of stopping volume, this screener looks for stocks in a downtrend that have completed a price reversal under increased volume, showing a strong close.
The Filter give the user a list of stock which are in uptrend and has recently retraced.
The stock picks out stocks which are negative on a given day so that the entry is done at a discount price.
It is important to make sure that the trade is followed according to a strict stop loss on the breach of the support.
In some occasions the stocks may break the support and continue downside so its key to keep stop loss. On entering any trade from this filter key is to see the nearest support line below the price and keep 1:2 profit and enter the trade.
The Trade needs to be taken with approximately 3-5% stop loss for a profit margin of 6-10%. This is a general guide but will vary based on stock volatility.
The Trader would be required to draw simple horizontal lines as support lines. Or use chartmill support lines for extra information to make sure the entry is done above the support and the support line is used as stop loss.
Screen for Long entries. Looking to isolate large number of US Companies with decent technical and setup ratings down to a select few for further analysis. All companies listed will be relatively close to horizontal support (possible demand zone) and should be fundamentally sound as well. Please note these companies are not actively breaking out but rather have the potential for a next move up.
BMF - Institutions buying on Tight Short Term Consolidation
Institutions are buying these stocks in a Tight Short Term Consolidation. Visually confirm that Large Player is Volume is rising during the consolidation.
Rubber Band Long ( Reversion to the Mean). Momentum trade.
As long as 50SMA remains angled up with price below. Use your preferred entry trigger, 50SMA is first TP level.
If 50SMA flattens or curls down, close the position !!!
As long as 50SMA remains angled down with price above. Use your preferred entry trigger, 50SMA is first TP level. If 50SMA flattens or curls up, close the position !!!
Stocks that have outperformed tend to continue outperforming. This screen identifies stocks with RS of 80 or higher with a trend that is gaining momentum.
This screnner is based on the buyable gap up criteria from the book "In The Trading Cockpit with the O'Neil Disciples" by Gil Morales and Chris Kacher. The deviating criterion is the average true range, this is calculated here as 0.6*ATR(14), where 0.75*ATR(40) is recommended, this is due the limitations.
How to handle this:
1. it occurs in a fundamentally good and/or leading stock after a consolidation phase
2. volume (EOD) > 1.5*volume(50)
3. gap > 0.6*ATR(14)
4. it should hold the daily low
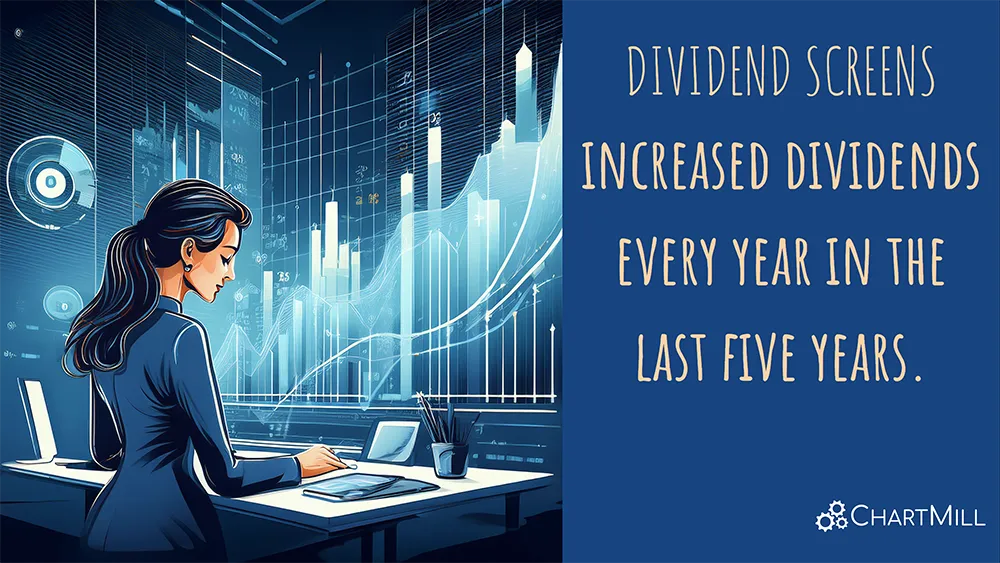
Dividend screens - Best dividend stocks whose dividends have increased every year for the past five years.
This is an extension of the “Best Dividends Stocks” trading idea where one additional filter was added that determines that the dividend has been increased year after year over the past 5 years.
REACCUMULATION PATTERN WITHIN STAGE 2 . THE WYCKOFF DEFINITION IS PRELIMINARY SUPPLY (PSY). BY DEFINATION WILL END IN A PRICE TOP AFTER THE PATTERN COMPLETES.