
Finding Stocks Ready to Break Out of Consolidations with Squeeze Plays (Bollinger Bands and Keltner Channels)
Introduction
A popular way for finding stocks ready to break out of a consolidation zone is by using the Bollinger band squeeze criteria. In the chartmill stock screener, we have various squeeze play filters. In this article we will explain the exact conditions for these filters and explain the squeeze play concept in detail.
Bollinger Band Squeeze: Trading in a narrow range.
The goal of the squeeze play filters is to find stocks that are trading in a narrow range. The narrow range indicates that the stock is forming some kind of consolidation or base. As long as the stock keeps on trading in this range it is not that interesting. Only when the stock breaks out of this zone there is a potential for an explosive move.
A popular misunderstanding is a confusion with short squeeze setups, remember for once and for all: there is no relation between squeeze plays (or Bollinger Band Squeeze) and short squeeze plays!
The squeeze play condition is met when the Bollinger Bands (14) are inside of the Keltner Channels (20,1.5,10). So two indicators are involved here:
- Bollinger Bands are bands around a moving average, the distance from the moving average is based on the standard deviation. The standard deviation changes as volatility increases and decreases. So the narrower the bands, the lower the volatility.
- Keltner Channels are placed around an exponential moving average. Instead of using the standard deviation, they use [the Average True Range (ATR)](/documentation/technical-analysis/indicators/254-The-Average-True-Range-ATR-Volatility-Indicator) as distance.
Because the Bollinger Bands are used, these setups are also sometimes referred to as "Bollinger Squeeze Setups". Typically, the standard deviation will be more sensitive to volatility than the ATR. Looking back at our condition we are looking for stocks where the standard deviation is less than 1.5 times the ATR.
Concept and Example
Typically, stocks are moving in bursts: you have consolidation zones followed by an explosive move. The goal of the squeeze play filter is to find these consolidation zones and to step in before or at the next explosive move.
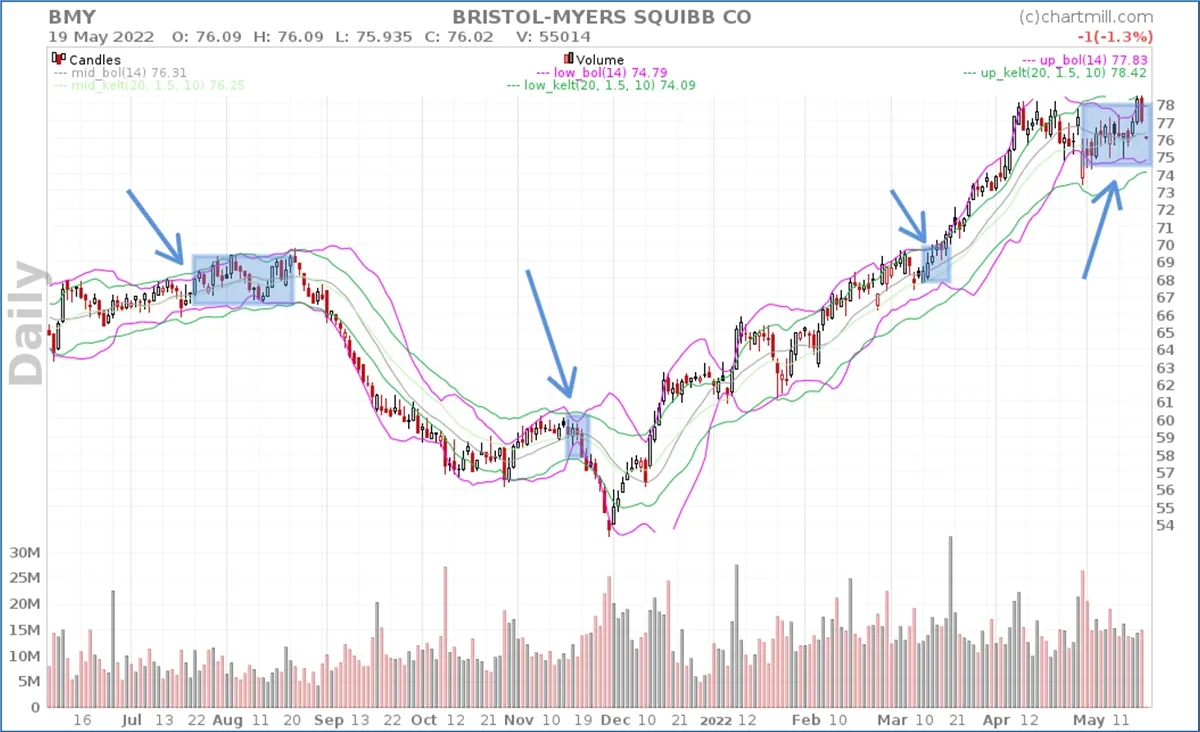
Looking at the chart above, we see a random stock that moved from around 24 to 52. You can see the different consolidation zones and the arrows indicate when the stock was marked as a squeeze play. Both Bollinger Bands and Keltner Channels were plotted on the chart to visualize when the squeeze play patterns were showing.
Squeeze plays explained by John Carter.
It is John Carter who introduced the term Squeeze Play and introduced the indicators we have available in our stock screener. To learn more, you can check out "this video on squeeze plays."
Bollinger Band Squeeze Stock Screener
In the stock screener, on the 'indicators' tab, you can find a filter list which is named 'squeeze play'. This is where all squeeze play related conditions can be found. As mentioned in the video above, the Momentum Oscillator may be used to determine the direction of the move. This indicator is part of some of the conditions.
The following options are available:
- Squeeze Play Daily Setup: This checks for the squeeze play condition on a daily basis. The Bollinger bands will be inside the Keltner channels.
- Squeeze Play Daily Short: This checks for a short signal of the Momentum Oscillator after a daily squeeze play setup. So in this case the Bollinger Bands already moved out of the Keltner channels.
- Squeeze Play Daily Long: This checks for a long signal of the Momentum Oscillator after a daily squeeze play setup. So in this case the Bollinger Bands already moved out of the Keltner channels.
- Squeeze Play Weekly Setup: This checks for the squeeze play condition on a weekly basis. The Bollinger bands will be inside the Keltner channels.
- Squeeze Play Weekly Short: This checks for a short signal of the Momentum Oscillator after a weekly squeeze play setup. So in this case the Bollinger Bands already moved out of the Keltner channels.
- Squeeze Play Weekly Long: This checks for a long signal of the Momentum Oscillator after a weekly squeeze play setup. So in this case the Bollinger Bands already moved out of the Keltner channels.
Interesting Combinations with other filters.
- Momentum squeeze play setups: This uses the trend intensity indicator to find squeeze plays in strongly trending stocks.
- Short squeeze play setups: This screen also uses the trend intensity indicator to find squeeze plays in stocks in a downtrend. We are looking for short opportunities here.
Possible other interesting combinations can be made with:
- Strong stocks or High relative strength stocks: find squeeze plays in strong stocks.
- Pocket pivots: show squeeze plays with some pocket pivots in the forming base.
- Effective Volume: find squeeze plays where large players are accumulating while the base is forming.
Even More squeeze plays on chartmill
A long time ago, something funny happened. We found out there was a bug in our calculation of the Bollinger Bands indicator. We fixed the bug of course, but a side effect of the fix was that we were finding squeeze plays that were apparently less nice than before. (Squeeze plays are based on Bollinger Bands, so it was to be expected that the results would be different).
So, because squeeze plays tend to give nice results, we introduced some slight variations in the squeeze play screener options. You can also find:
- Chartmill squeeze play setups. These are based on the buggy bollinger band implementation, which apparently works nice for squeeze plays.
- Original JC squeeze play setups. These are the squeeze plays using the standard bollinger bands as they were originally defined.
- Near Chartmill squeeze play setups. This version is a little bit less strict in the squeeze play definition. It find way more candidates that are almost squeeze plays.
