Update Stock Screener: Saving Custom Expressions
By Kristoff De Turck - reviewed by Aldwin Keppens
Last update: Apr 16, 2024
Custom Expressions are one of the most powerful applications in ChartMill and we continue to develop them. They offer very extensive possibilities to refine existing filters or create completely new filters that can recognize specific price patterns (this trading idea for example where two custom expressions were used to define a specific price reversal pattern in conjunction with the Bollinger Bands).
Until now, however, you could not save custom filters individually. They were part of a specific screen. If you wanted to use the same custom expressions in another screen you had to redefine them as custom expressions for the new screen.
But we have some good news! This has been updated and from now on you can save custom filters separately so that you can add them to any screen with just one click!
Follow along in the example below to show you how, we'll start from a simple basic screen:
- US stocks with a minimum price of $10
- Market capitalization of at least 300 million
- A minimum average trading volume of 500,000 shares traded per day
- whose price is maximum 5% below the highest 52-week price.
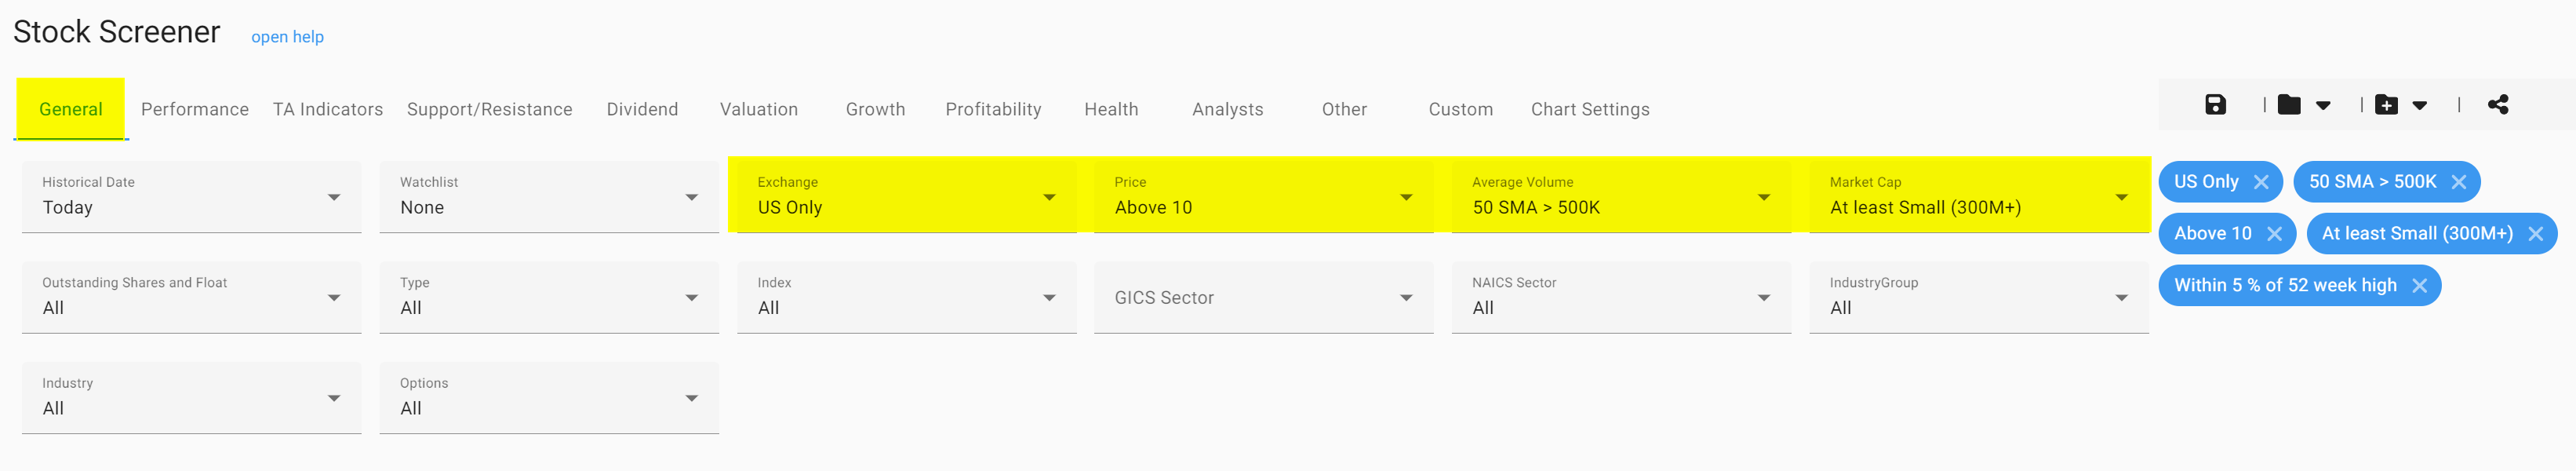
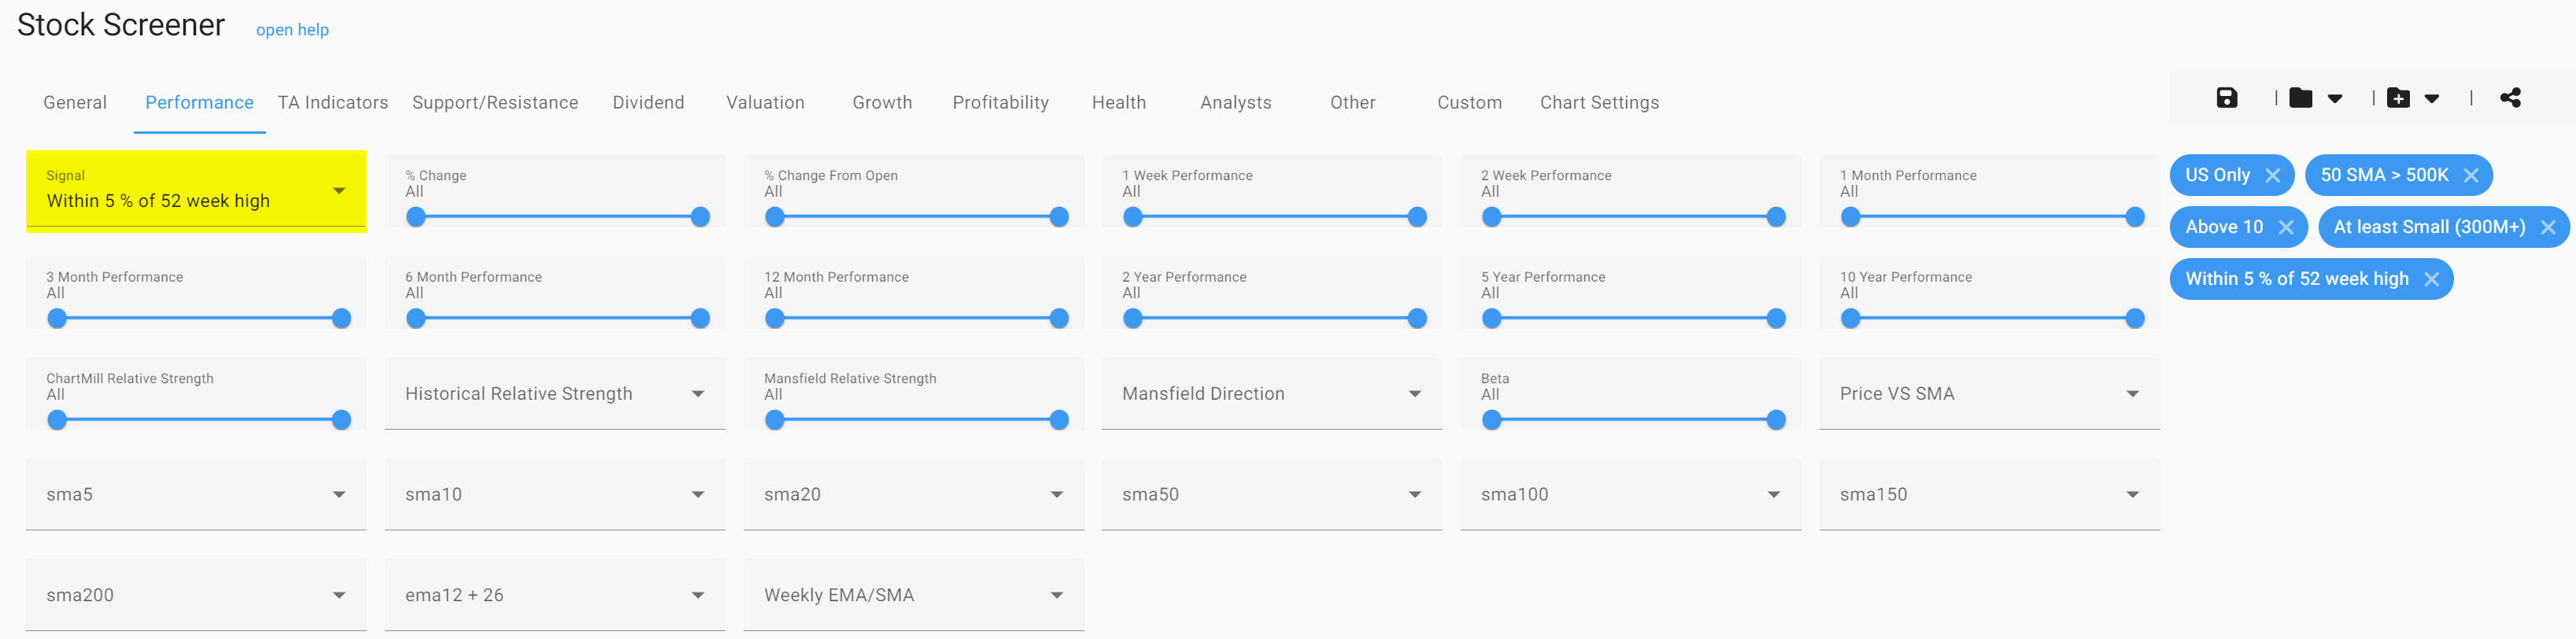
The filter 'within 5% of 52 week high' is a predefined filter that can be found via the Performance tab > Signal > 'Within 5% of 52 week high'.
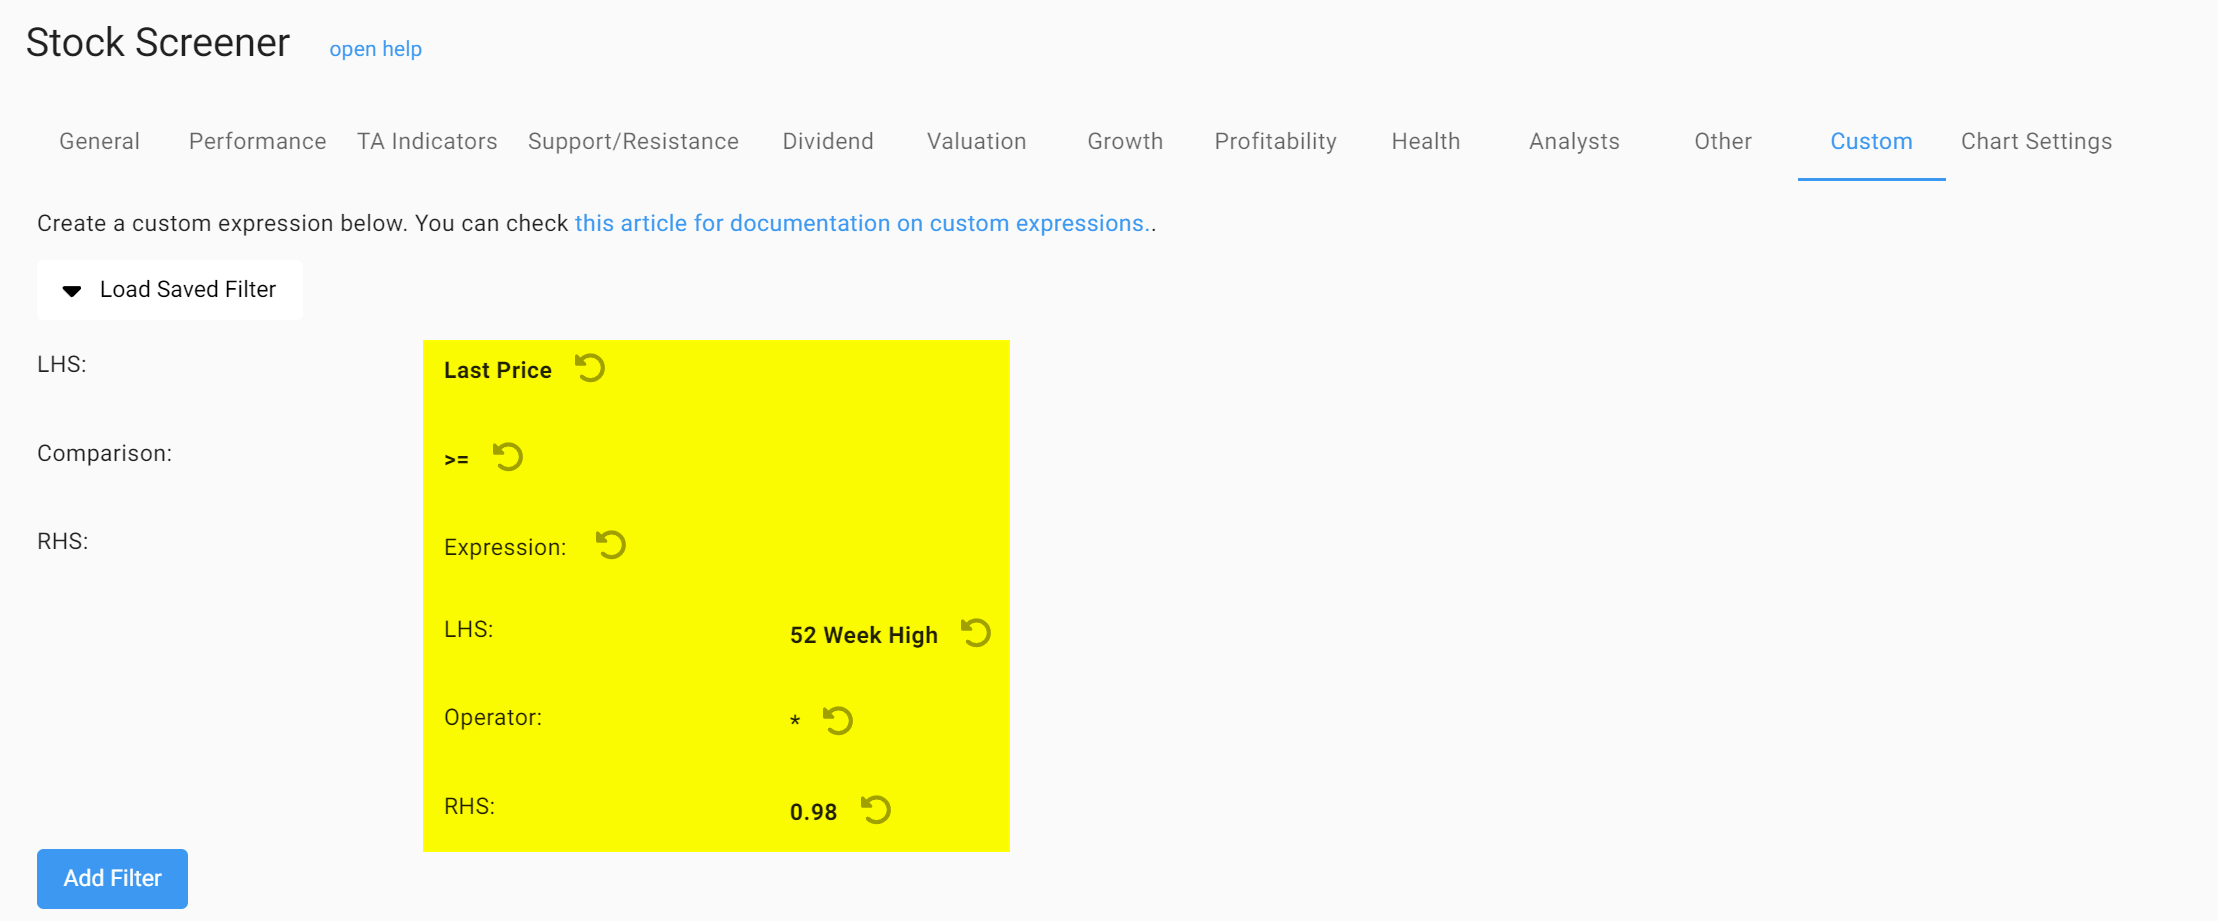
Suppose you want to further refine this to only stocks that are within 2% of their 52-week high? Although this option is not available as a predefined filter, it is perfectly possible by using a custom expression.
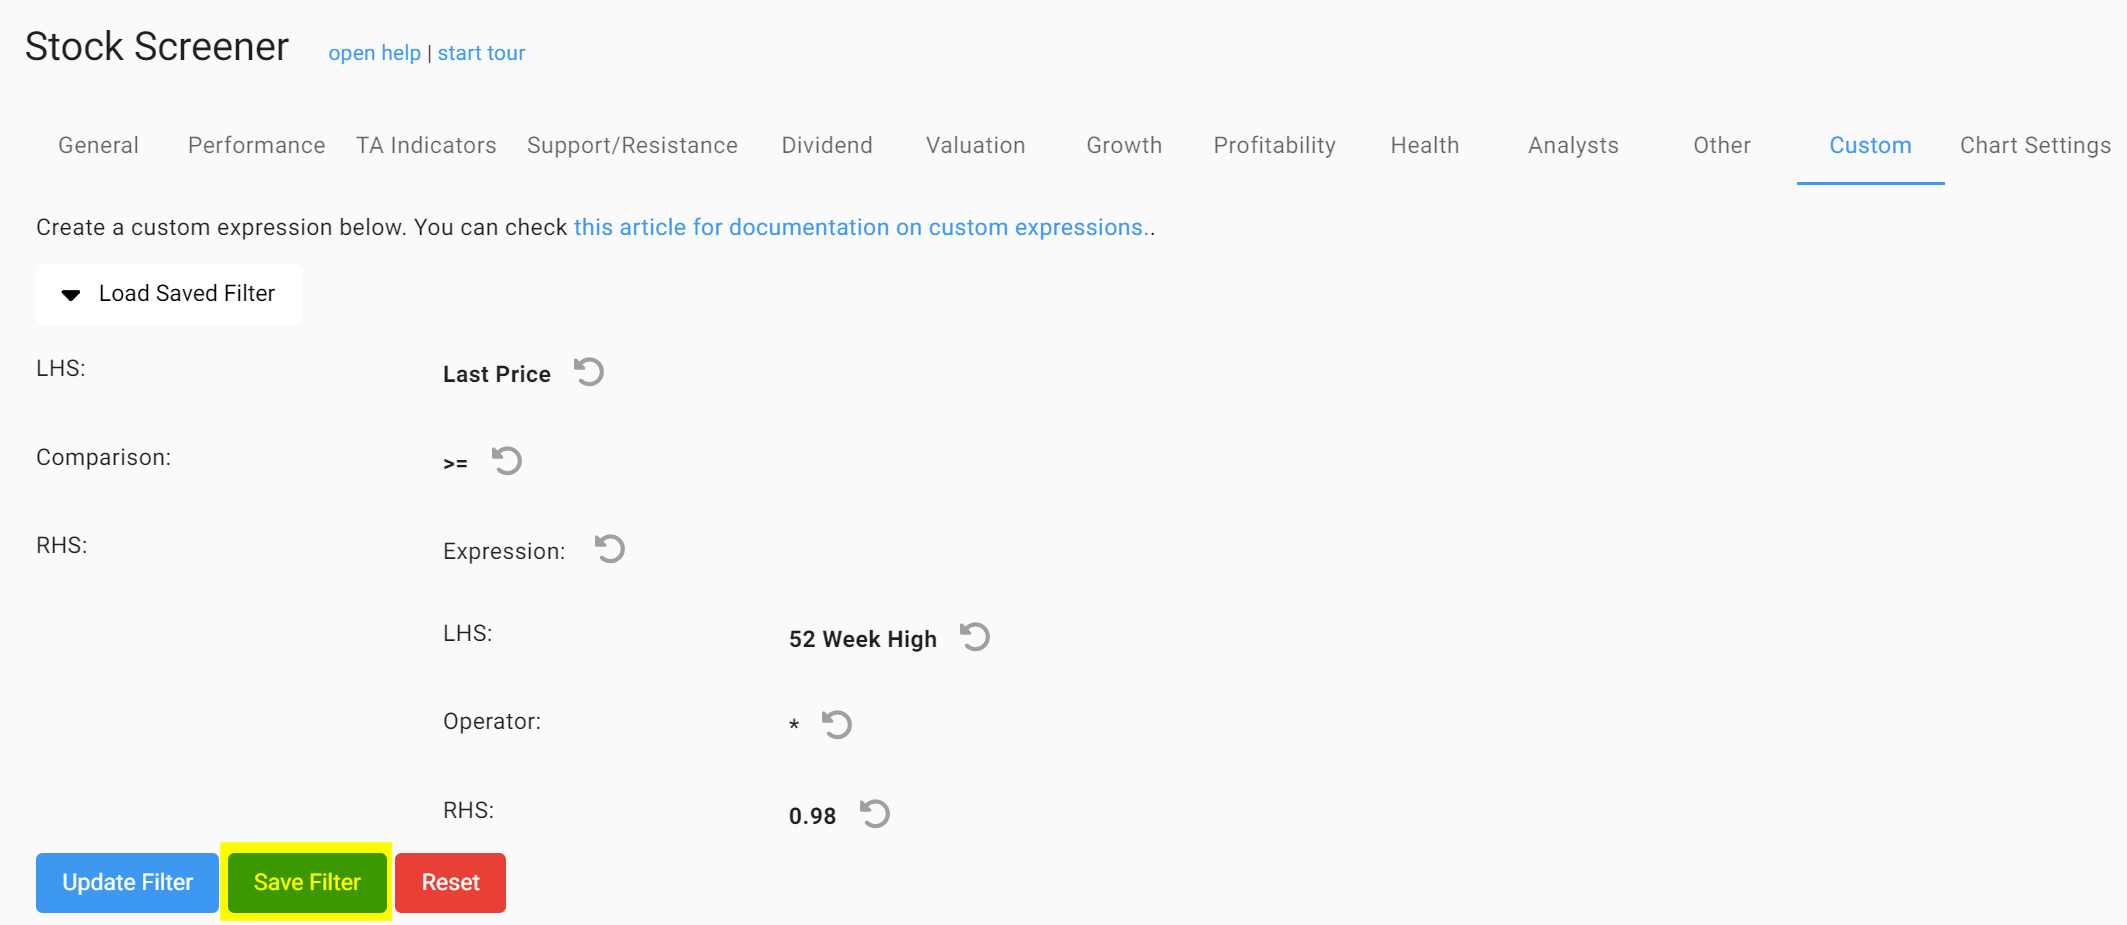
To do so, open the 'Custom' tab. In the next screen, next to 'LHS', open the dropdown menu and select 'Property', click on the inverted triangle again and then select 'Last Price'.
Now tap the menu next to 'Comparison' and select* '>='*
For the 'RHS' first select 'Expression'. In the new menu that opens, choose for the 'LHS' > 'property' > '52 week high'.
For the 'operator' select the '*' sign.
For the 'RHS', select 'constant' and enter a value of '0.98', than press 'enter'. By doing this I have just defined a price that is exactly 2% lower than the 52 week high price.
Your screen should now look like this:
Finally, click 'Add Filter'.
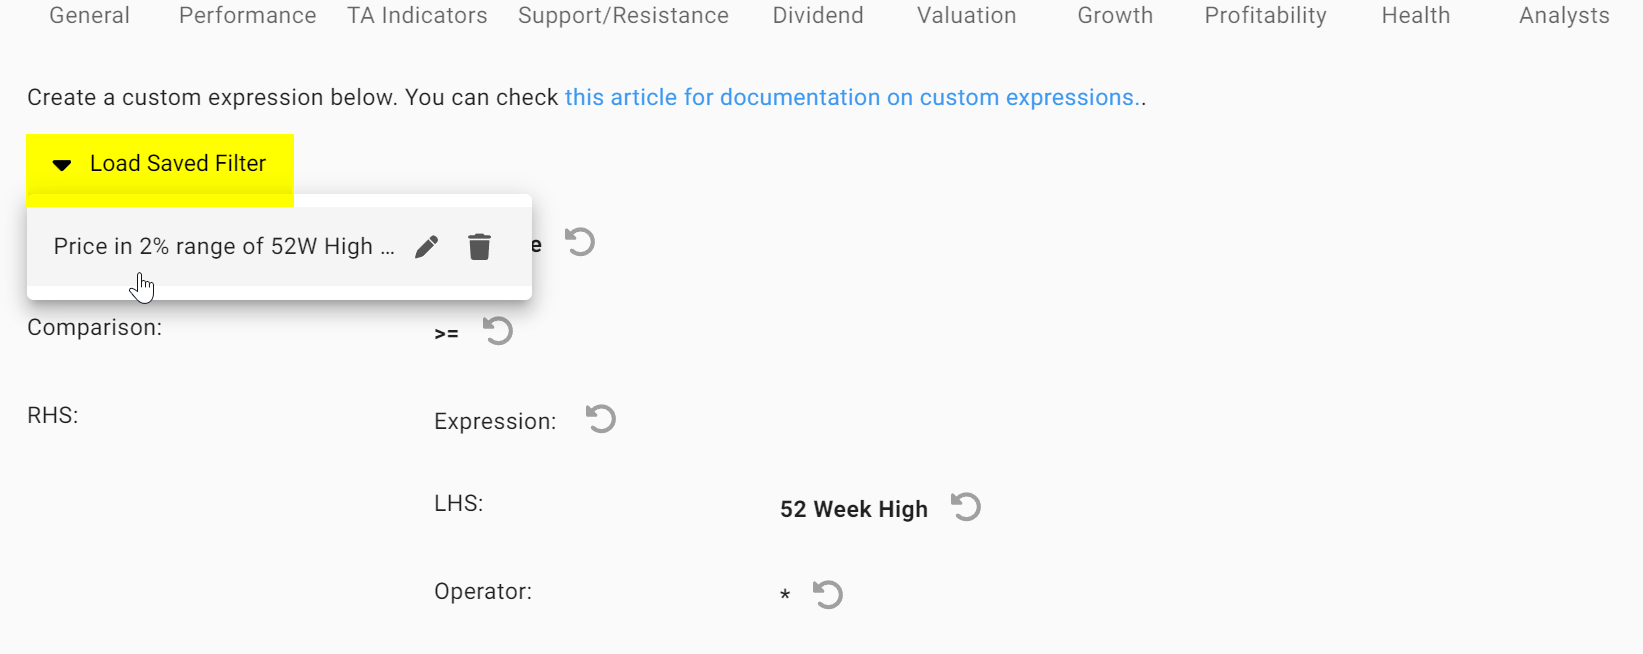
In the following screen, you can save this filter for future use. Click 'Save Filter' and choose an appropriate name. Click 'Save'.
Now open the 'Load Saved Filter' menu you will see your newly saved custom expression. You can now apply this filter to any watchlist, trading idea or screen.
You can just as easily modify an existing filter, to do so first click on the icon with the pencil next to the custom expression you wish to modify. Make the changes and click 'Update Filter' and then 'Save Filter'.
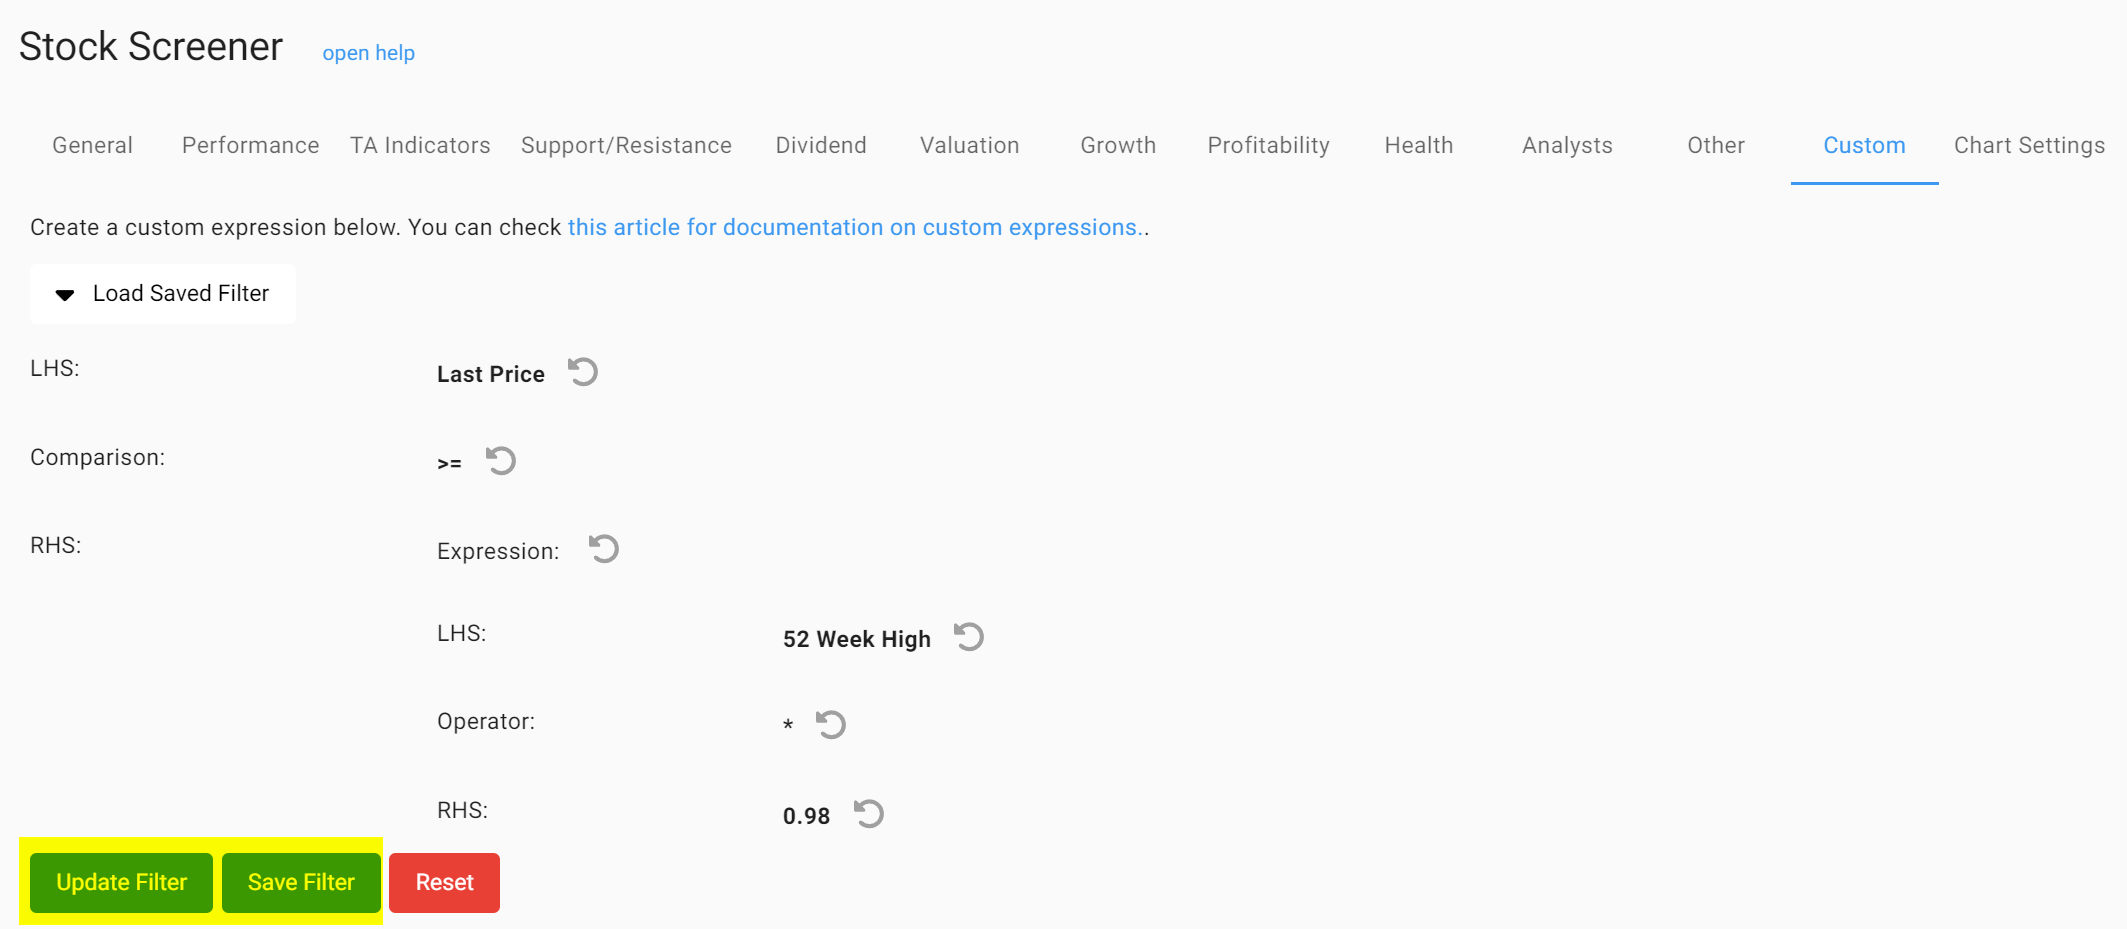
Attention, when making a change, always click 'Update Filter' first and only then 'Save Filter', otherwise the old formula will not be overwritten.
Happy Screening!
