The RSI Indicator: What Is It And How To Use It?
What Is RSI In Stocks?
The Relative Strength Index Indicator is probably one of the most popular technical indicators used by traders worldwide. It is a momentum oscillator, developed by J Welles Wilder, that captures the speed and change of price movements.
To this end, it is represented as a line chart on a scale of 0 to 100 where values lower than 30 are considered "oversold" and values higher than 70 "overbought. In this way, the indicator draws attention to potential turning points in the current trend which could lead to corrections in the existing long-term trend or even to real trend changes.
Welles Wilder is the creator of this (and many other) technical indicator(s). He first introduced this indicator in his well-known 1978 book "New Concepts in Technical Trading Systems".
Calculation
It is typically calculated using the following formula:
RSI = 100 - [100 / (1 + RS)]
where RS (Relative Strength) is the average of x days' up closes divided by the average of x days' down closes. The most common period is 14 days, but traders can adjust this value based on their preferences and trading style.
RSI Levels
Between 0 and 30: extremely oversold
A value below 30 indicates a severely oversold condition. Traders are watching for a possible change in the price trend where the existing bearish trend changes to a new bullish trend.
However, this is not a certainty. Always keep in mind that a strong downtrend with a lot of momentum can cause the indicator to remain in extremely oversold territory for a long time. Buying blindly because this value is below 30 is therefore not a good strategy.
Between 30 and 50: slightly oversold to neutral
A value above but close to the value of 30 is an indication of a slightly oversold condition. If the value is closer to 50, it is more likely to be neutral.
Between 50 and 70: neutral to slightly overbought
Above but near the value 50 is also neutral. However, if the value is close to the 70 level, it indicates a slightly overbought condition.
Between 70 and 100: extremely overbought
This is the area where the value is considered extremely overbought and where it is believed more likely that the bullish trend is losing momentum and there may be a real trend reversal to a bearish situation.
Nevertheless, the same observation as what we already addressed in the oversold situation applies here as well. A strong rise could lure many more buyers into the market, causing the Relative Strength Indicator to quickly skyrocket. This does not mean that the market cannot continue to rise strongly for an indefinite period.
Again, the warning remains that an open long position should not be automatically closed (or a short position opened) because the indicator is extremely oversold.
“Remember well that these ranges are only indicative and should never be used as pure trading signals. Without additional elements confirming the overbought or oversold situation, the chances of false signals are too high.”
Which Settings to Use?
Exactly which are the best parameters for this indicator is a purely personal choice that depends mainly on your strategy used and the timeframe in which it is executed.
The default settings are 14 periods with an upper limit at 80 and a lower limit at 30. Typical swing traders sometimes use 20 periods because this roughly corresponds to a 1-month trading period on the daily chart.
Another option is to set the upper and lower limits a little tighter at 80 and 20 respectively. This will result in fewer signals but they will become more reliable and generate fewer false signals.
Overbought vs. Oversold Levels
The horizontal axis shows the time and the vertical axis has a value from 0 to 100 (this is why the indicator is an oscillator). Above 50 the technical trend is positive, below 50 it is negative. It measures the speed and direction of a movement.
The general rule is that when the value is above 70, one speaks of an 'oversold' signal, which means that the price has already risen quite sharply in a relatively limited time and the chance of a (temporary) decrease increases. The reverse situation occurs when the value of the indicator falls below the level '30', resulting in an 'oversold' signal. The price of the share then fell quite sharply and the chance of a (temporary) counter-reaction increased.
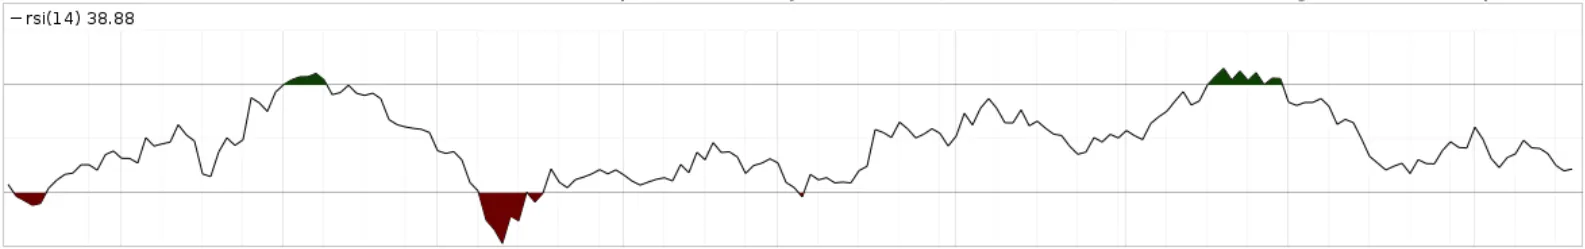
Visually the indicator looks like this, you can recognize the peaks above 70 and the troughs below 30:
The RSI shown in a chart of the company 'Cenovus Energy Inc' looks like this:
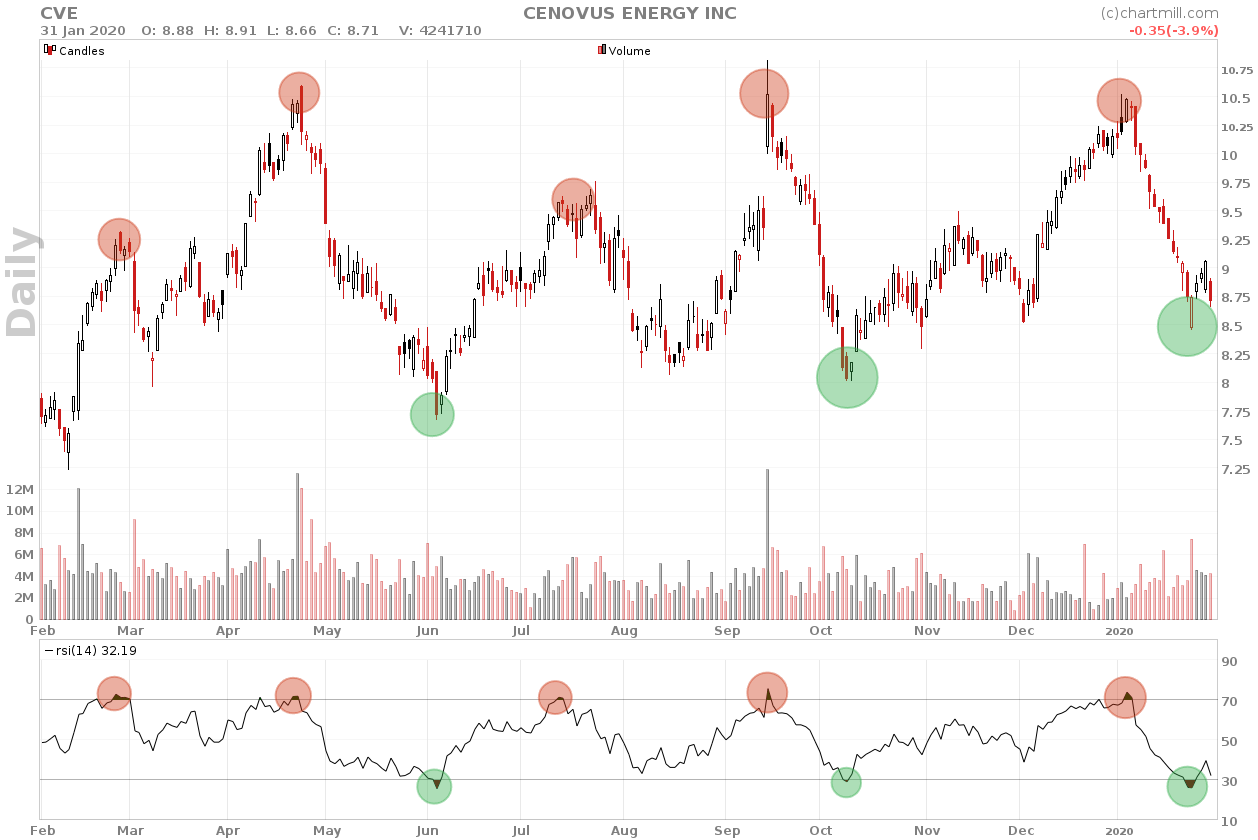
The red circles show sell signals and the green ones show the possible buy signals. Anyone who bought shares in a green circle and sold them in a red circle has made a very nice series of profit!
This chart shows that the rsi levels mainly provides good signals in markets that are moving sideways.
3 Different Ways To Use These Levels In a trading strategy.
In the previous section, we pointed out that the reliability of this indicator is highly dependent on the market phase of a stock or market.
We distinguish between the following phases:
- The price is located in a sideways channel (consolidation zone).
- The price shows a clear uptrend
- The price shows a clear downtrend
Sideways Price Channel
In a sideways price channel, we already saw that the classic buying and selling signals (buying if <30 and selling if >70) are relatively reliable.
The share price fluctuates roughly between $10.75 and $7.50 in a wide lateral price channel. The price falls or rises every time one of the two limits is reached. In this case, the RSI displays accurate signals.
Rising trend
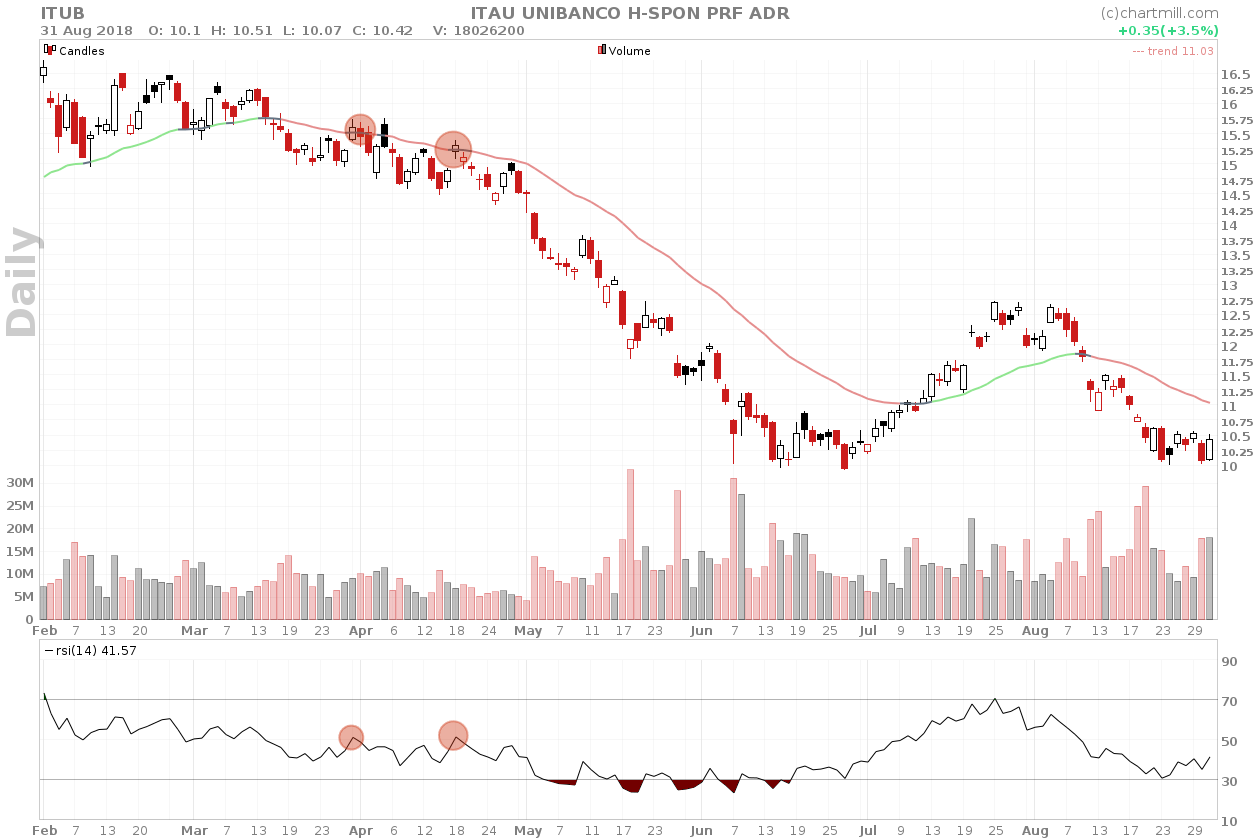
In a stock with a clear uptrend, the classical use is much less successful. The sharp upward trend on the graph below is immediately noticeable to the naked eye and is also indicated by the ChartMill Trend Indicator (green line in the price chart).
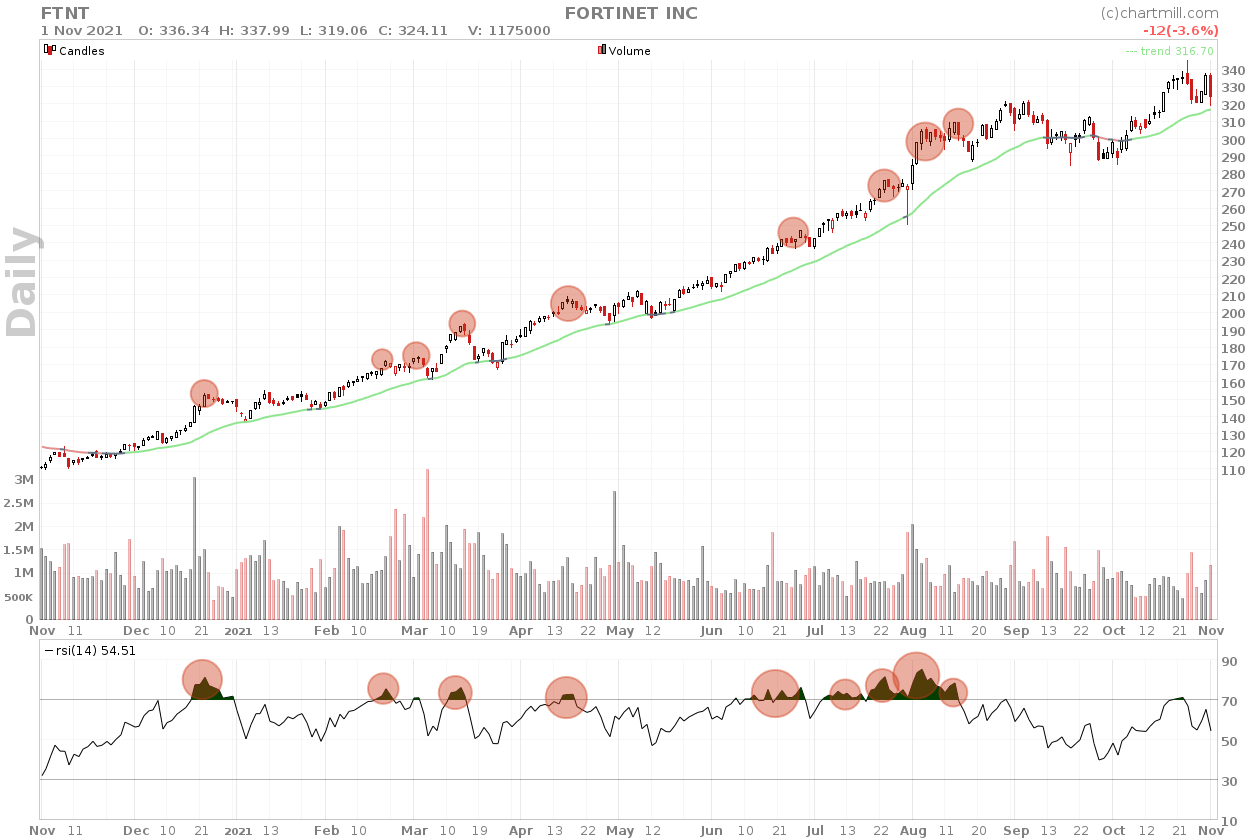
As long as the trend continues to increase, it is advisable to simply ignore the sell signals. In such cases, you can try to pick up the stock in the event of a temporary fall in the upward trend.
Luckily you can also use this indicator for that purpose. In the chart below we show the same chart but the sell signals were ignored and we have indicated the moments when the value dropped below the 50 level.
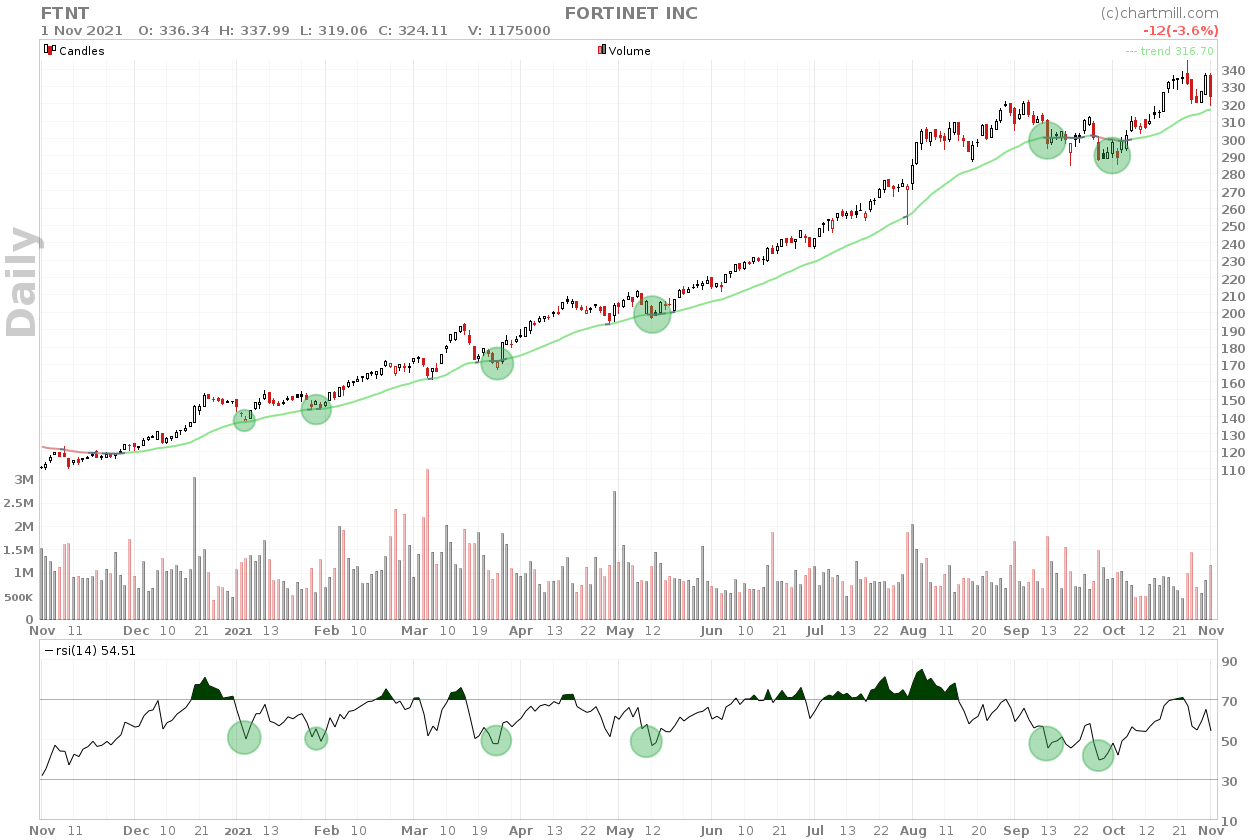
Buying when the RSI falls below 50 in an upward trend gives very good results and allows you to increase positions within one stock.
Declining trend
As with the upward trend, the RSI can also be used to short the stock in a sharply downward trend if the price of the stock temporarily recovers. In the chart below we have indicated the points where the ChartMill Trend indicator shows a downward trend (red line) with an occasional price upturn where the trend indicator becomes neutral (grey color) but never positive (green color).
At those moments in the graph, the indicator showed a sell signal as the value exceeded 50.
“In stocks that show a strong price trend (up or down), the classic lower and upper levels (30 and 70) in many instances are too extreme. In that situation, the 50 level is much more useful to identify overbought or oversold periods.”
The Power of Divergences: discover new price trends in an early stage.
Divergence means that there is a difference between the price evolution on the chart and the movement of the indicator.
Since such divergences frequently occur when an existing long-term trend is coming to an end, they are used by active investors to recognize early changes in long-term price trends and thus open new positions in the direction of the reversing trend.
A distinction is made between bullish (positive) and bearish (negative) divergence.
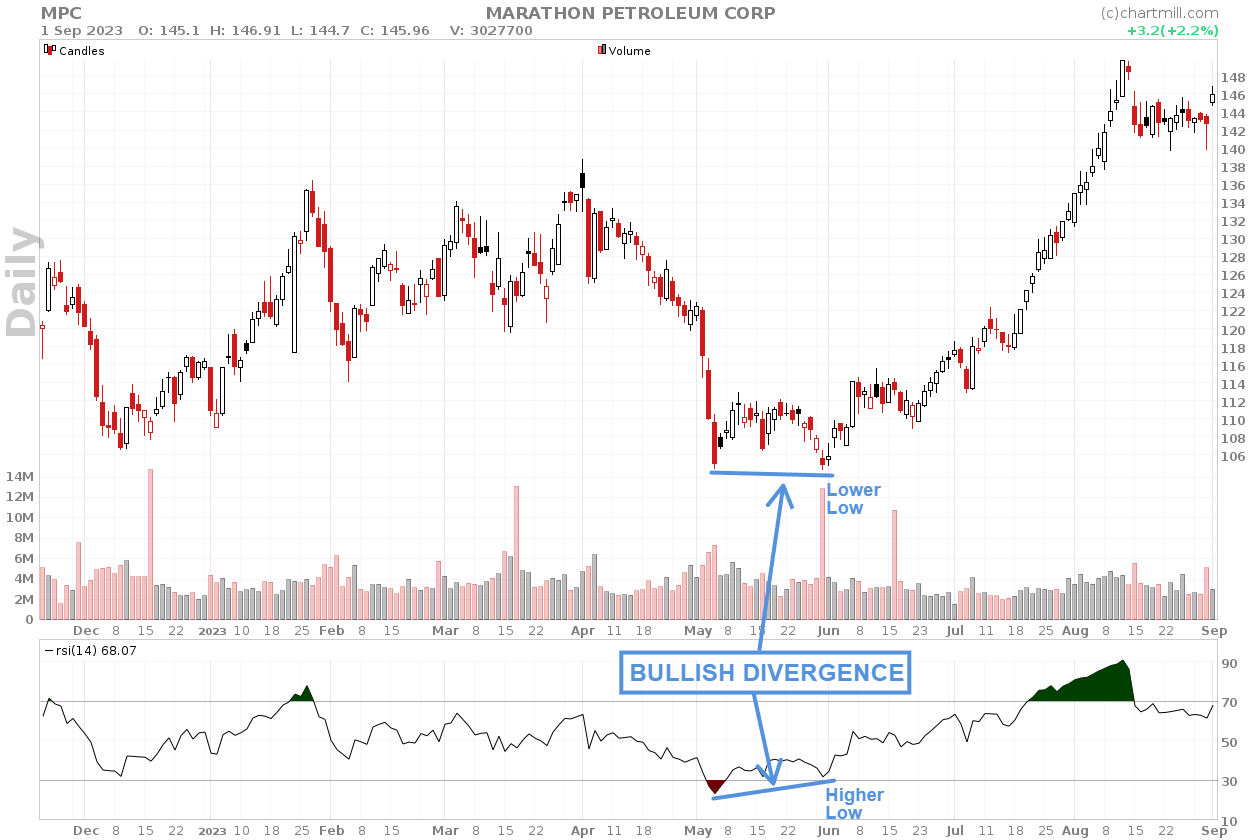
Bullish Divergence RSI
A bullish divergence occurs if the price chart still shows lower bottoms while the opposite occurs in the RSI chart line. This is a sign that the strength and momentum of the falling price movement is decreasing - at least temporarily - and thus increasing the likelihood of an interim price upturn.
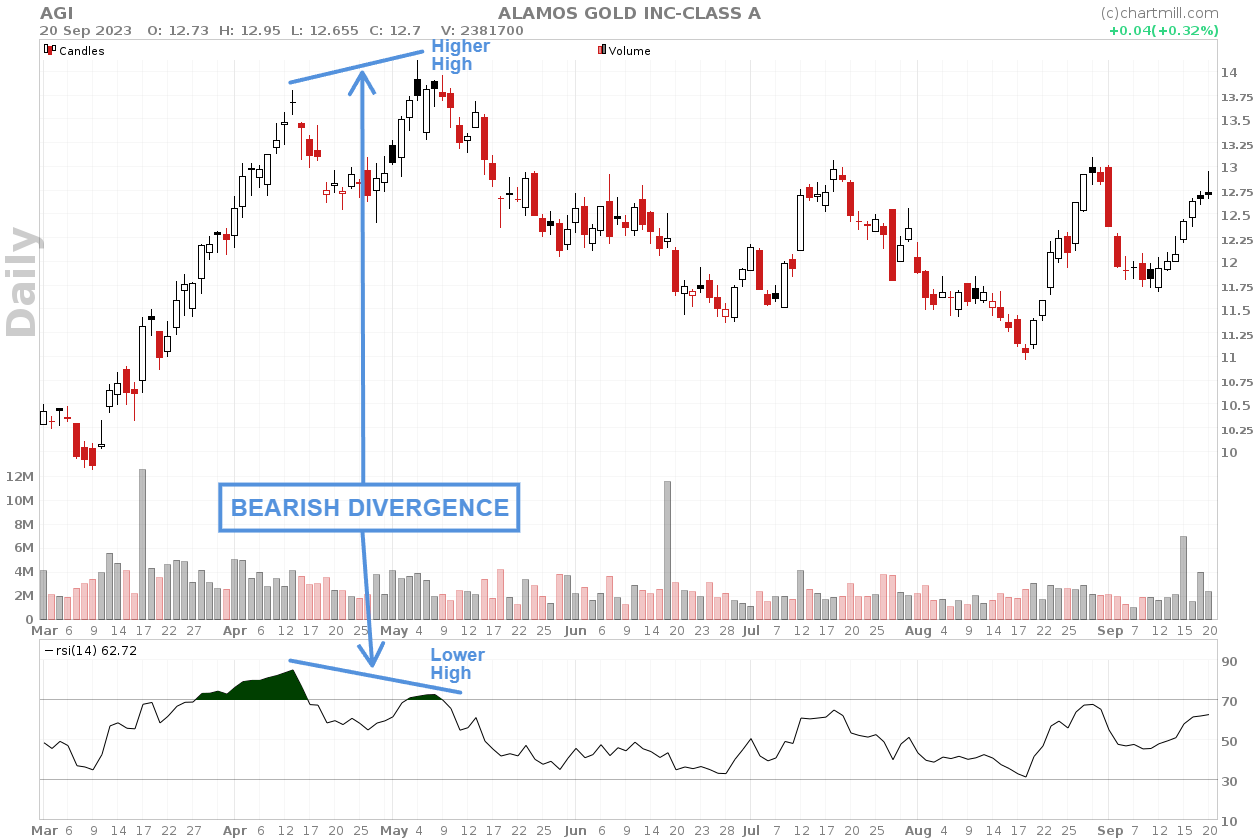
Bearish RSI Divergence
A bearish divergence occurs when lower tops are visible in the indicator while the price is still moving higher. This indicates that the strength and momentum of the rise are waning - at least temporarily - and that the possibility of an (intermediate) price decline is possible.
Hidden Divergences: taking advantage of temporary price changes in existing trends
This form of divergence is a derivative of the classic divergence and occurs mainly in stocks that show a clear upward or downward trend.
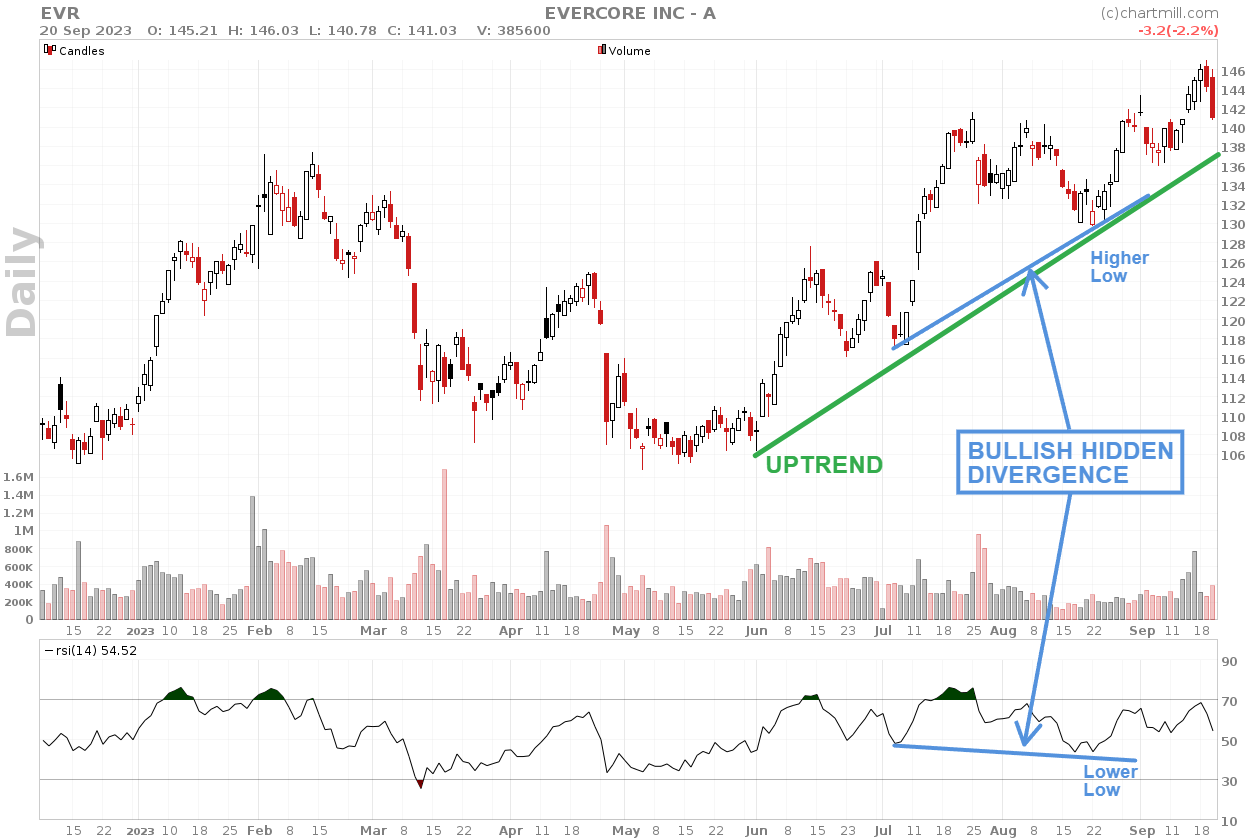
The hidden divergence becomes visible the moment the price experiences a temporary decline in a bullish trend or a temporary recovery in a downtrend.
The example below shows the chart of Evercore stock which has been in an uptrend since early June 2023. The most recent price dip led to a new higher low in the price but as far as the RSI is concerned, a lower low was formed which resulted in a bullish hidden divergence.
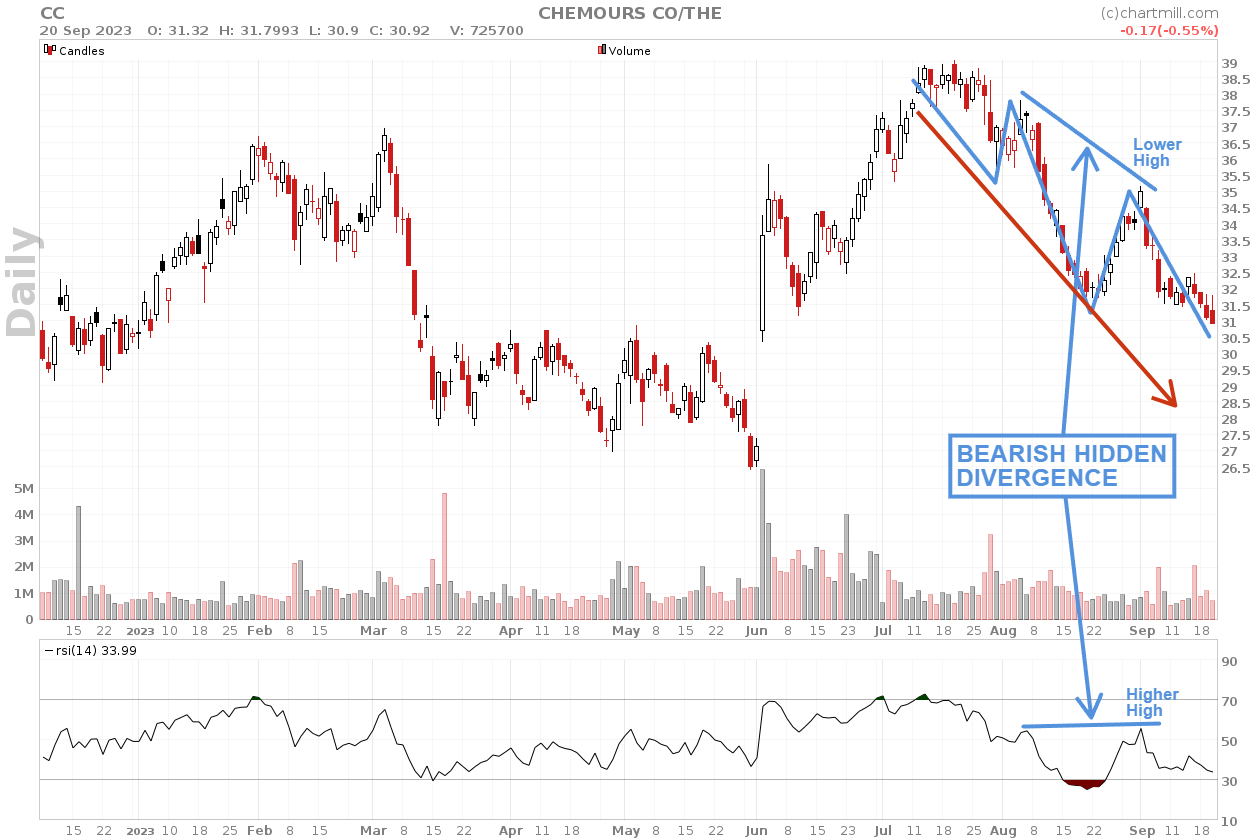
A similar hidden divergence can also be seen in a downtrend. Chemours stock reached a top between July and August after which the price fell and several successive lower highs were formed. However, the most recent lower high in the price gave a higher low in the indicator, also recognized as a bearish hidden divergence.
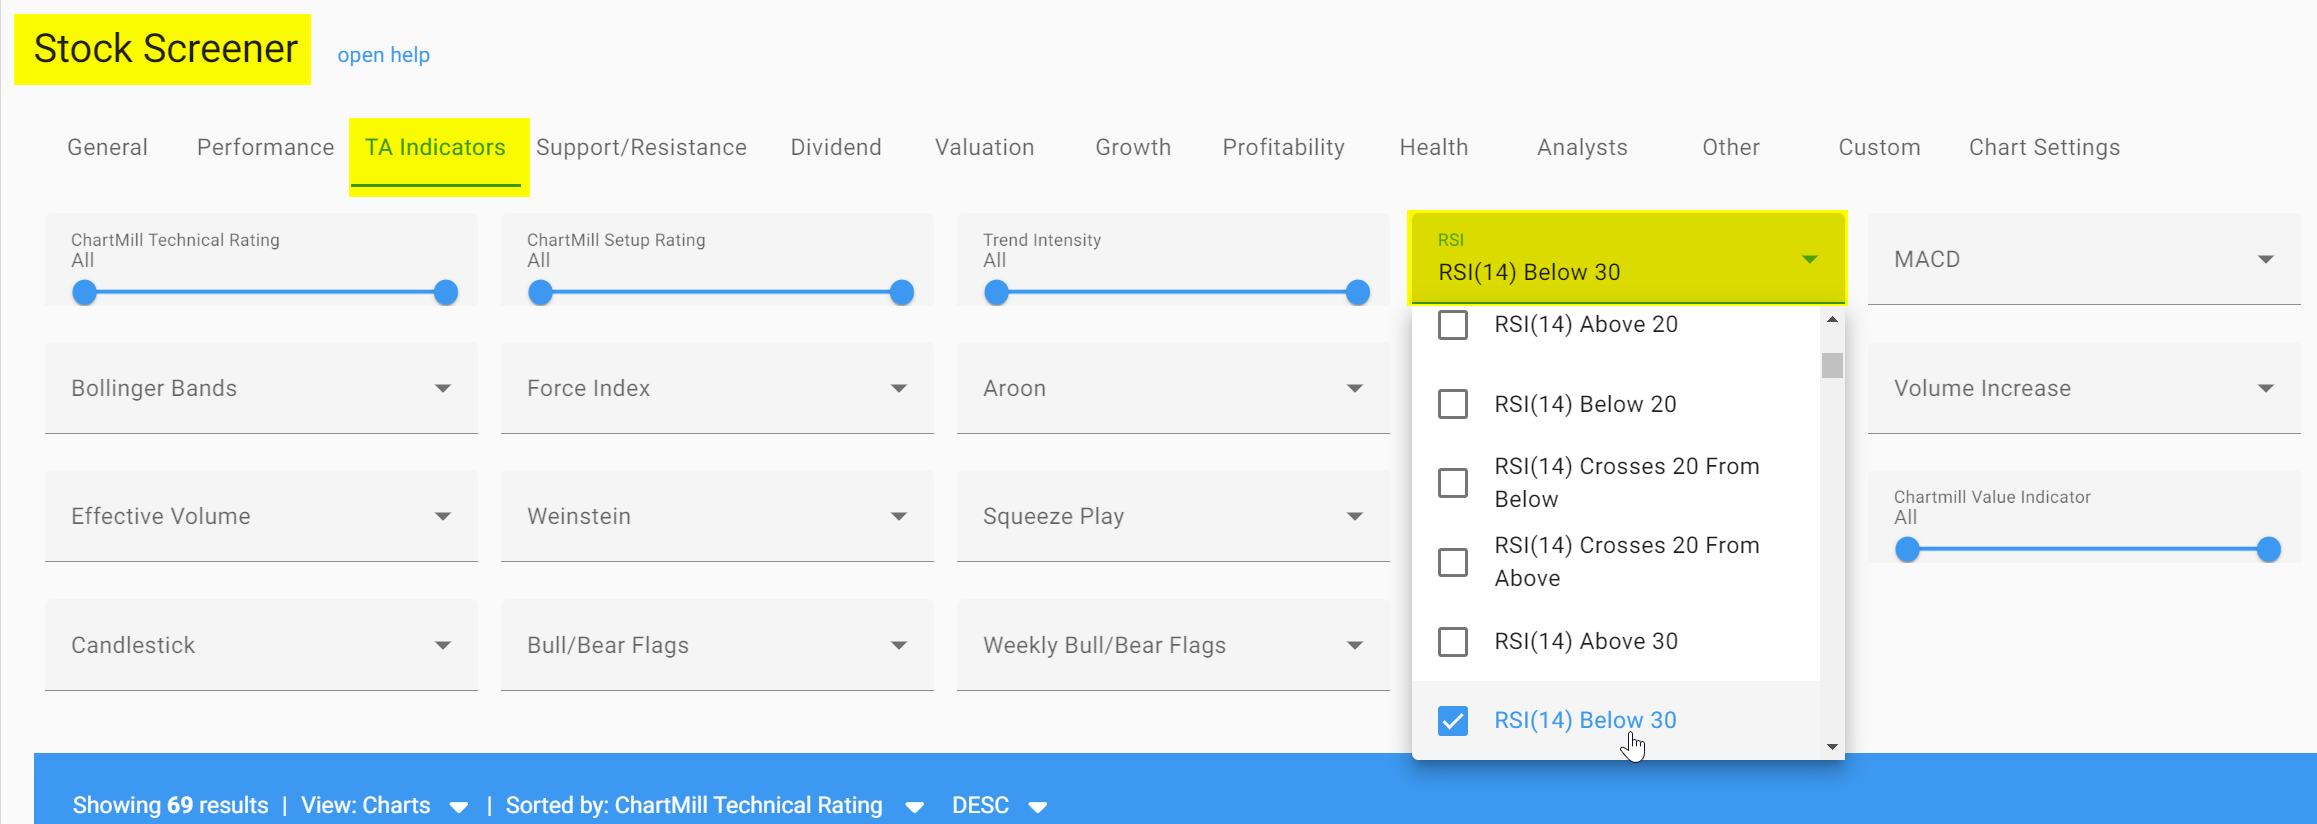
Using the RSI in ChartMill
Available in ChartMill as an indicator on the stock charts page but also as a screening filter on the stock screener page.
You can simply add the indicator by clicking on the plus sign and then opening the drop down menu under 'select indicator to add'.
On the stock screener page you will find the indicator as a screening filter under the menu TA indicators. You can choose between two specific intervals, 14 or 2. Multiple screening variants are possible.
- The indicator above or below a certain value.
- The indicator that crosses a certain value up or down
FAQ
What’s The Difference Between RSI And Relative Strength?
"RSI" and "Relative Strength" can sometimes be confused with each other because they both include the term "Relative Strength." However, they refer to completely different concepts:
The Relative Strength Index is a technical indicator used to measure the strength and momentum of a financial instrument's price movements. It is an oscillator that ranges from 0 to 100. RSI compares the magnitude of recent gains with recent losses over a certain period, usually 14 days. It helps traders identify overbought and oversold market conditions, potential trend reversals, and divergence between price and momentum.
Relative Strength (in the context of investing), is a measure of how one investment or asset class performs relative to another. It is a tool used in portfolio management and asset allocation. As such, it is not an indicator like RSI. Relative Strength can be calculated by dividing the performance of one asset class (or investment) by the performance of another over a period of time. It is used to determine which assets are relatively strong (outperforming) or relatively weak (underperforming) compared to a benchmark or another asset.
The similarity lies in the use of the term "Relative Strength," but the applications and calculations are completely different.
What's the difference between RSI and Stochastics-RSI?
The Stochastic-RSI - like the regular Stochastic indicator- is a momentum indicator used primarily to identify overbought or oversold levels. The fact that the term RSI has been added means that this Stoch RSI is a derivative of the ordinary RSI indicator. The difference with the ordinary Stochastics indicator is that the Stoch RSI relies on the RSI values and not on the price of the underlying asset.
However, the formula used to calculate the value remains the same.
Is The RSI A Good Indicator?
The Relative Strength Index is a valuable tool in technical analysis, but it has some limitations that traders and investors should be aware of.
For example, it is often used to identify overbought (above 70) and oversold (below 30) conditions. However, these levels do not provide certainty. Indeed, markets can remain in these extreme conditions for extended periods, and relying solely on the RSI for entry and exit points can (and will) regularly result in false signals.
The same applies to the so-called divergence signals (when RSI and price move in opposite directions). This is an indication that points to a potential reversal but it is not always reliable. Such divergences can also persist for quite some time, leading to missed trading opportunities or premature entry.
Moreover, the effectiveness will vary depending on the period chosen (usually 14 days). Shortening the period makes the indicator more sensitive but may produce more false signals while lengthening the period reduces sensitivity but may lead to delayed signals.
None of this means that the signals cannot be valuable when combined with other technical or fundamental information.
Can RSI Also Be Used For Daytrading?
Yes, it’s quite popular among day traders. It is a versatile technical indicator that can be applied to various timeframes, including intraday charts, making it suitable for day trading strategies.
Day traders can adjust the period to suit their trading style and the asset they are trading. Smaller periods (e.g., 9 or 5) are more sensitive and suitable for very short-term trades, while longer periods (e.g., 14 or 21) are better for slightly longer intraday trades.
Other Articles Related To RSI
2 Day RSI Trading Strategy
The strategy is specifically aimed at active traders who hold positions for several days to at most several weeks. Read more...
How To Use RSI For Swing Trading? A Checklist
In this article, we go over the different steps needed to successfully use this indicator in a swing trading strategy. Read more...
Understanding the Stochastics RSI Indicator
The Stoch-RSI is an outlier. The indicator uses the formula of the stochastic indicator and applies it to the values of the RSI indicator. Read more...