

(All data & visualisations by ChartMill.com)
Daily Market Trend Analysis – September 29, 2025 (After Market Close)
Short Term Trend
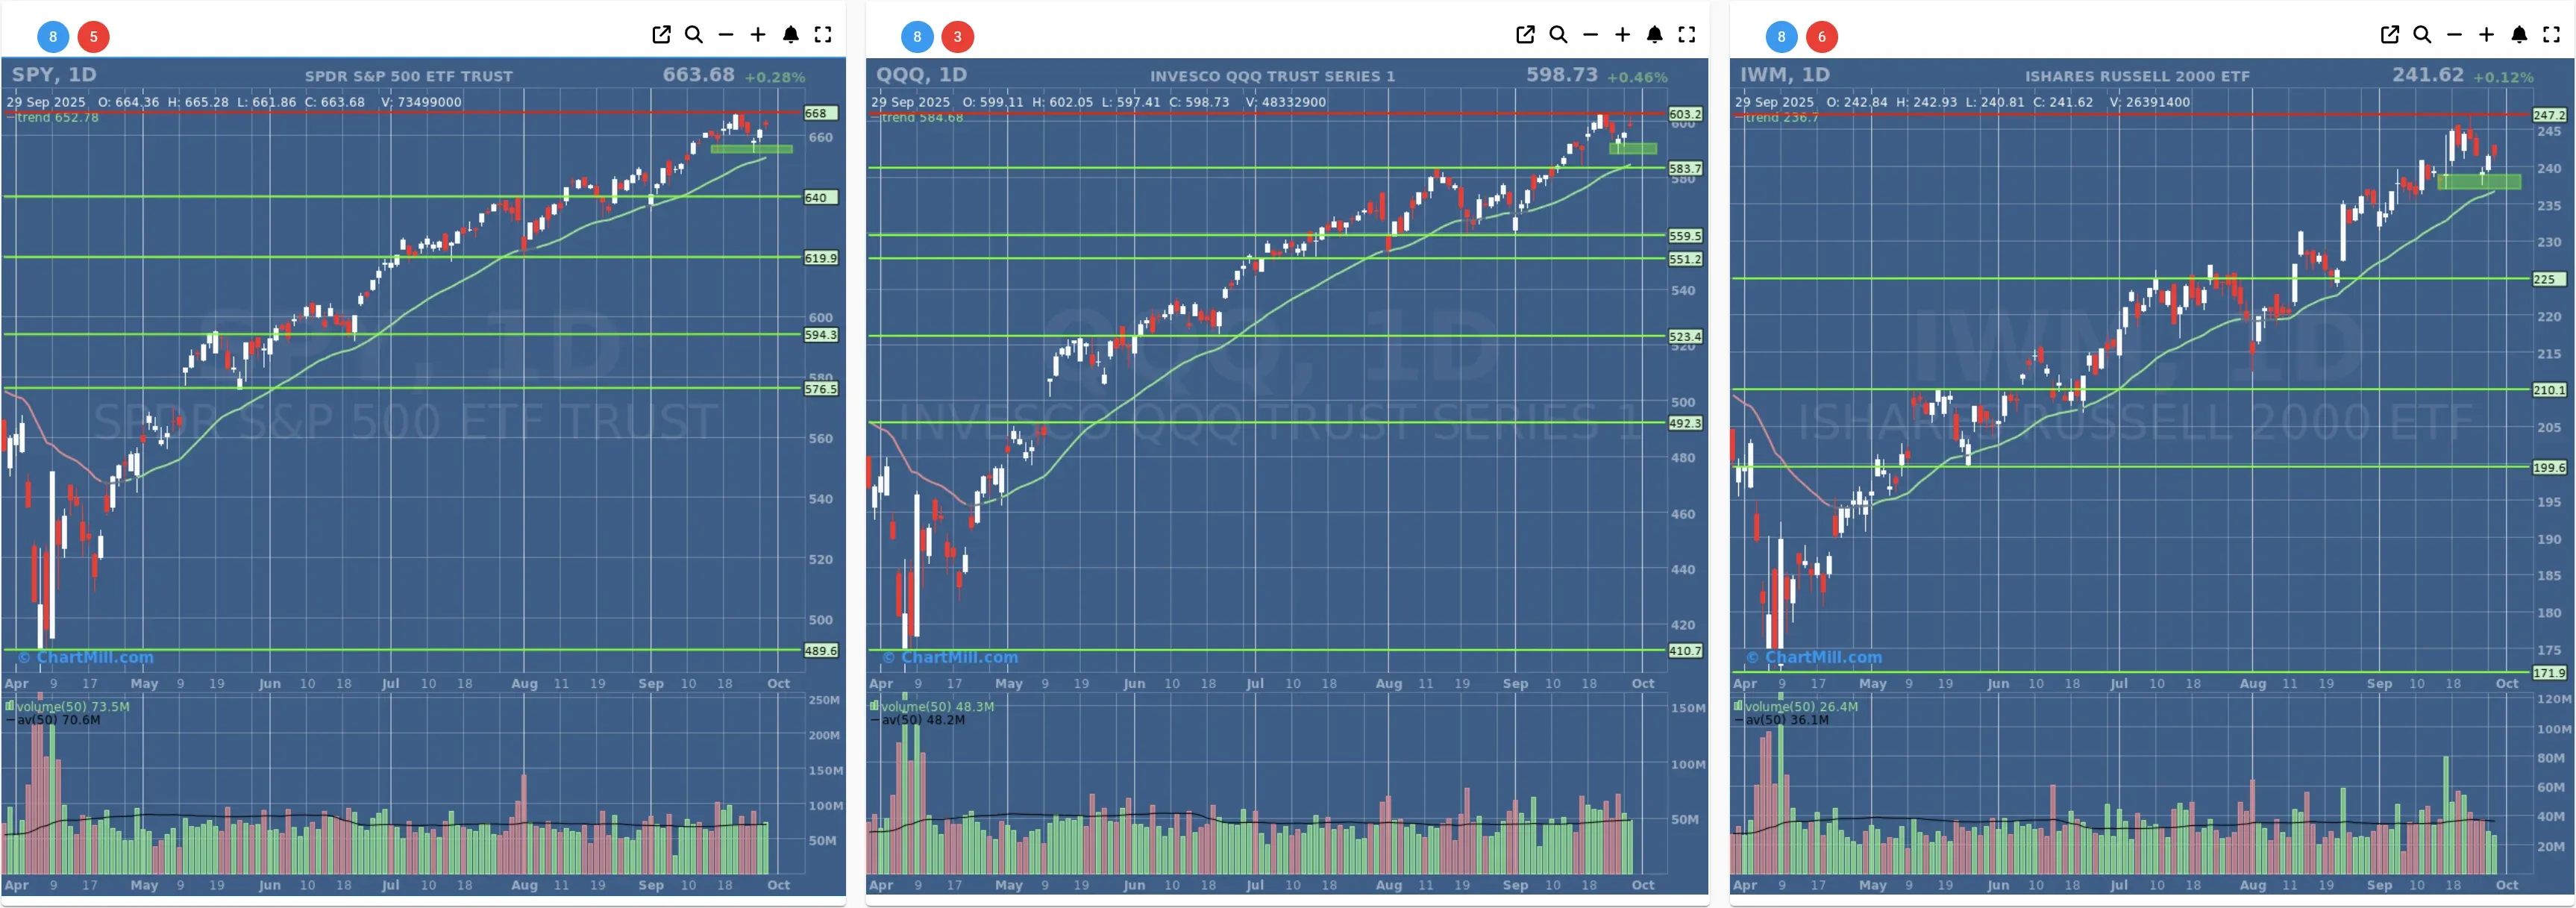
- Short-Term Trend: Positive (no change)
- Next Support at $660 - $650
- Next Resistance at $667
- Volume: At Average (50)
- Pattern: Up Day - Gap up - Doji Candle
- Short-Term Trend: Positive (no change)
- Next Support at $590
- Next Resistance at $603
- Volume: At Average (50)
- Pattern: Up Day - Gap up - Doji Candle
- Short-Term Trend: Positive (no change)
- Next Support at $235
- Next Resistance at $245
- Volume: Below Average (50)
- Pattern: Up Day - Gap up
Long Term Trend
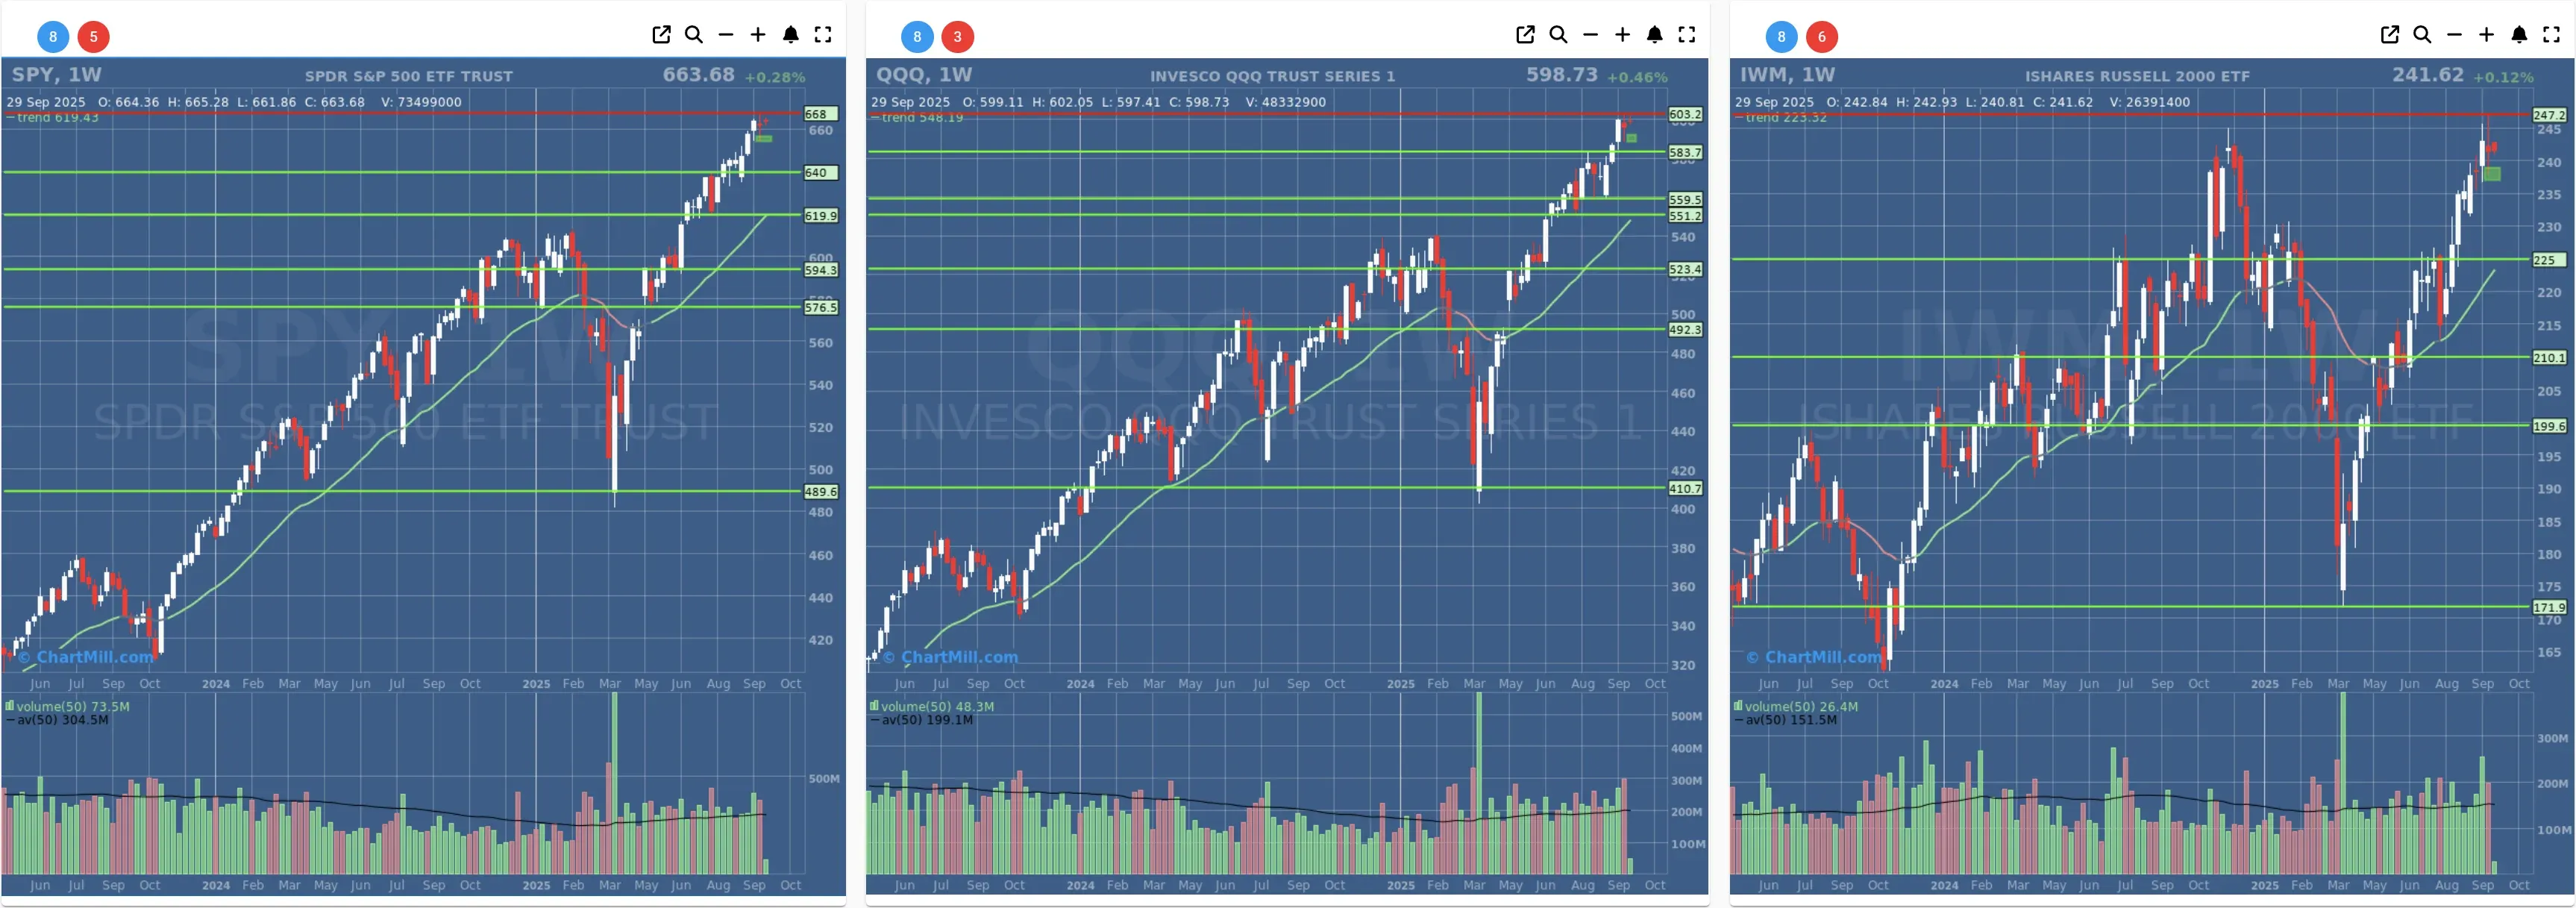
- Long-Term Trend: Positive (no change)
- Long-Term Trend: Positive (no change)
- Long-Term Trend: Positive (from neutral)
Daily Market Breadth Analysis – September 29, 2025 (After Market Close)
On Monday, September 29, breadth metrics showed a slight cooling after Friday’s strong recovery, but overall conditions remain balanced. Short-term momentum softened, while longer-term structural strength is still intact, keeping the trend tilted toward neutral with a positive bias.
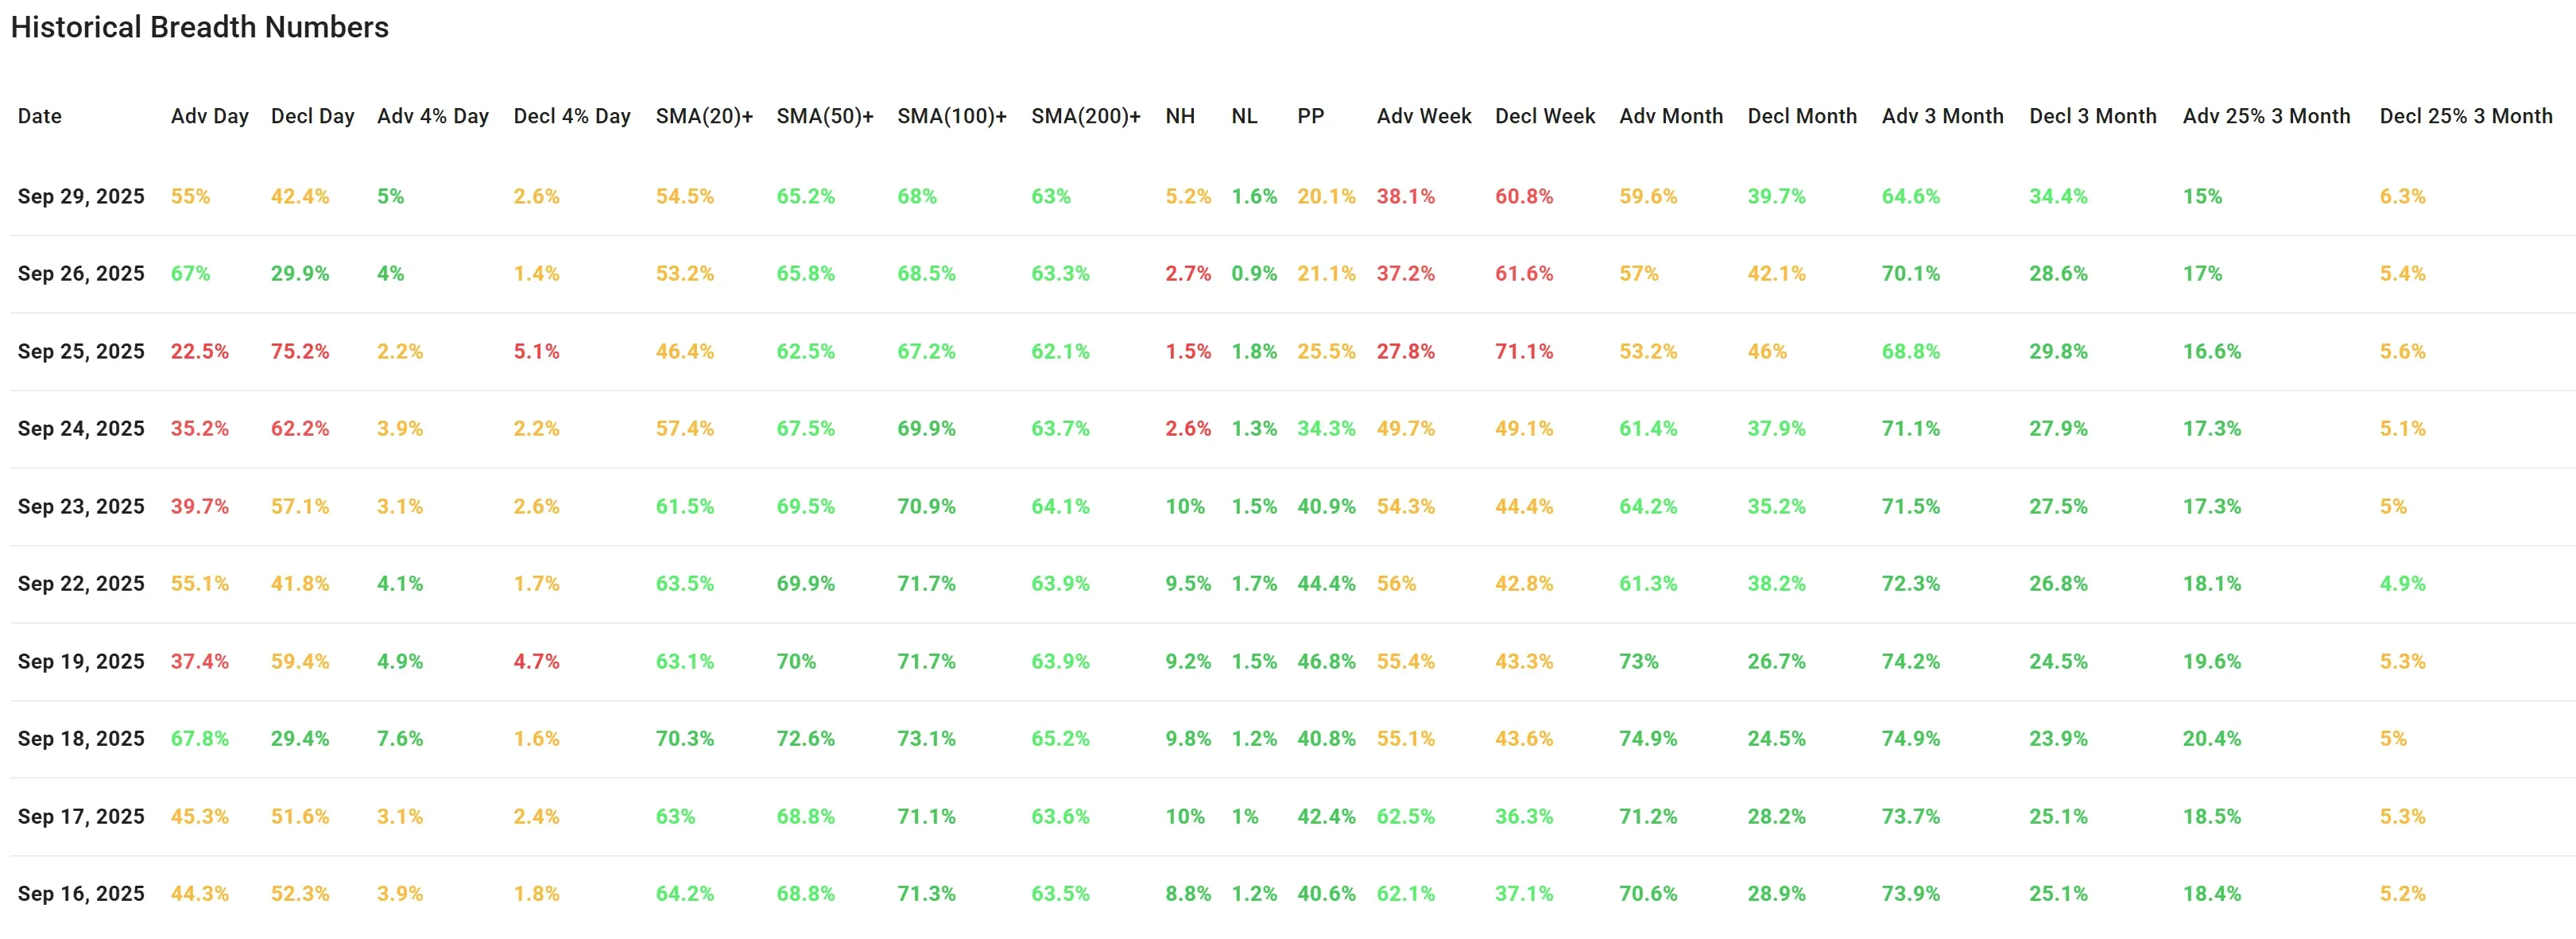
Daily Advances vs. Declines:
Advancing stocks came in at 55%, down from Friday’s 67%, while decliners rose to 42.4%. The market still leaned toward the positive side, but the intensity of buying cooled.
Big Movers (±4%):
Large advancers and decliners stayed muted (5% vs. 2.6%), showing stability without outsized volatility.
Short- to Medium-Term Averages:
Stocks above their 20-day SMA improved slightly (54.5% vs. 53.2%), while the 50-, 100-, and 200-day SMA participation slipped marginally. This signals a bit of short-term resilience but modest consolidation in broader participation.
New Highs vs. New Lows:
New highs expanded to 5.2% (vs. 2.7% Friday), while new lows stayed contained at 1.6%. This suggests underlying strength is still supporting selective leadership.
Weekly and Monthly Breadth:
The weekly view remained cautious, with 38.1% advancers vs. 60.8% decliners. On a monthly horizon, advances held at 59.6%, comfortably ahead of declines at 39.7%, pointing to medium-term balance.
Three-Month View:
Advancers above 3 months slipped notably from 70.1% to 64.6%, showing some broad-based cooling. Still, only 6.3% of stocks are down more than 25% over three months, keeping downside risks contained.
Comparison with Friday, September 26
Friday marked a decisive rebound after Thursday’s selloff, with breadth strongly skewed toward buyers.
Monday’s session saw some of that strength ease off, as advancing participation moderated. However, the fact that new highs improved and downside extremes stayed limited suggests the market is consolidating rather than reversing.
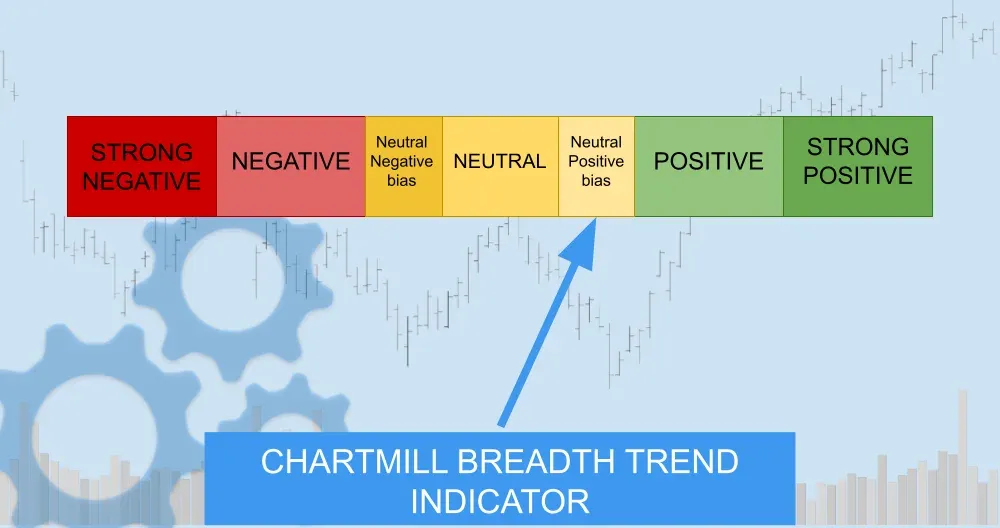
Conclusion
The breadth picture on Monday cooled compared to Friday’s rebound but remains balanced overall. Short-term enthusiasm eased, yet medium- and long-term indicators continue to confirm resilience.
Market breadth points to consolidation rather than weakness, keeping the overall trend slightly tilted to the upside.
Breadth Trend Rating: Neutral with a Positive Bias
Kristoff - ChartMill
Next to read: Wall Street Lights Up as Cannabis Stocks Blaze Higher, Biotech Melts Down