The MACD Indicator - Moving Average Convergence and Divergence
The MACD or Moving Average Convergence and Divergence Indicator is a very popular indicator in technical analysis. The MACD indicator is used to determine the strength, direction and duration of a trend and is supported in the ChartMill Stock Screener and ChartMill Stock Charts
The MACD in the stock charts
Just like the RSI Indicator, the MACD also belongs to the family of momentum indicators in technical analysis. These indicators measure the strength of the existing trend and provide insight into whether a trend is intensifying or decreasing.
In the stock charts you can simply add it to your charts by selecting it from the indicator list. Once the indicator is added, the price chart looks like this:
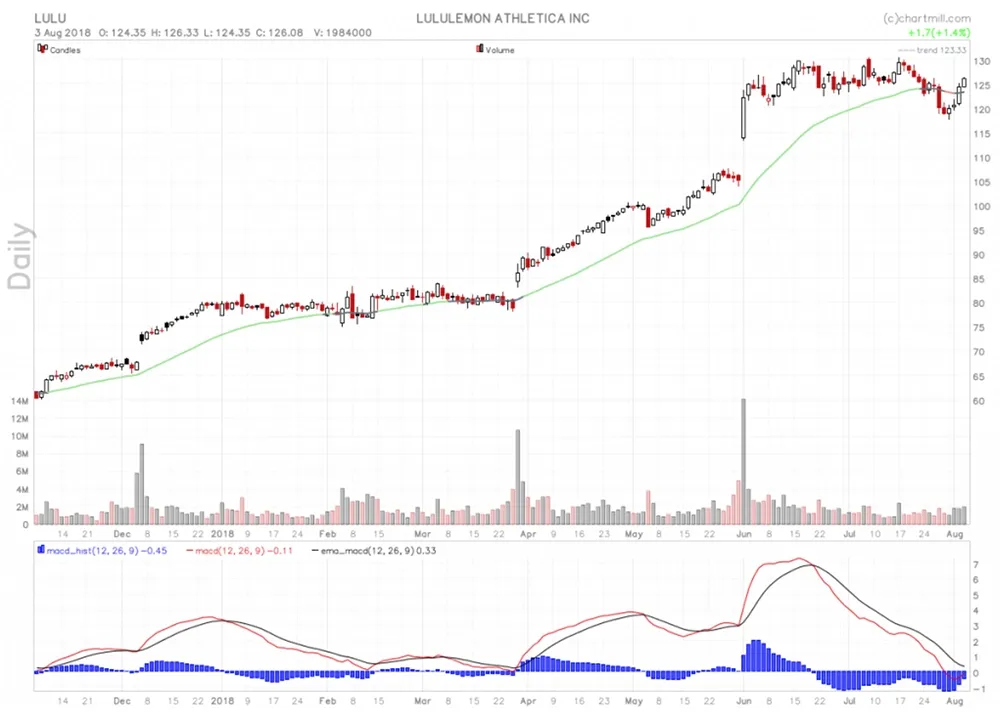
The indicator is positioned below the price chart and consists of two lines (red and black). Underneath, a lot of blue bars are visible, which together form the MACD-histogram.
MACD Stock Screener
The ChartMill Stock Screener supports filtering on various MACD properties. You can find the filters under 'MACD' on the indicators tab:
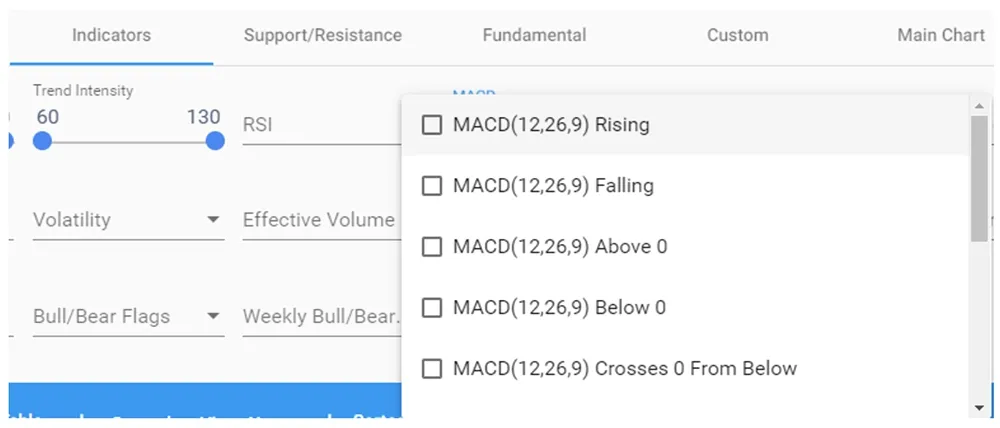
You can create filters both on the daily or weekly macd(12,26,9) signals. The practical usage of these signals is explained below.
Determine trend strength with the MACD indicator
The red line is the MACD line, which is created using two exponential averages (based on closing prices), the EMA12 and EMA26 (EMA = Exponential Moving Average). The MACD line is created by calculating the difference of the EMA12 - EMA26. The black line is the signal line and is created by calculating a 9-day EMA over the red line. The histogram shows the difference between the MACD and the signal line. If you look at the graph above, you will notice that the histogram is positive (value > 0) if the red line (the MACD line) is above the black line (signal line).
If an ascending movement gains in strength, this will also be shown in the histogram because the blue bars become higher. The opposite occurs when an upward trend movement loses strength, the blue bars will become shorter. The same goes for the intensity of a falling price trend and as soon as the MACD line falls below the signal line you will see the blue bars appear below instead of above the zero line.
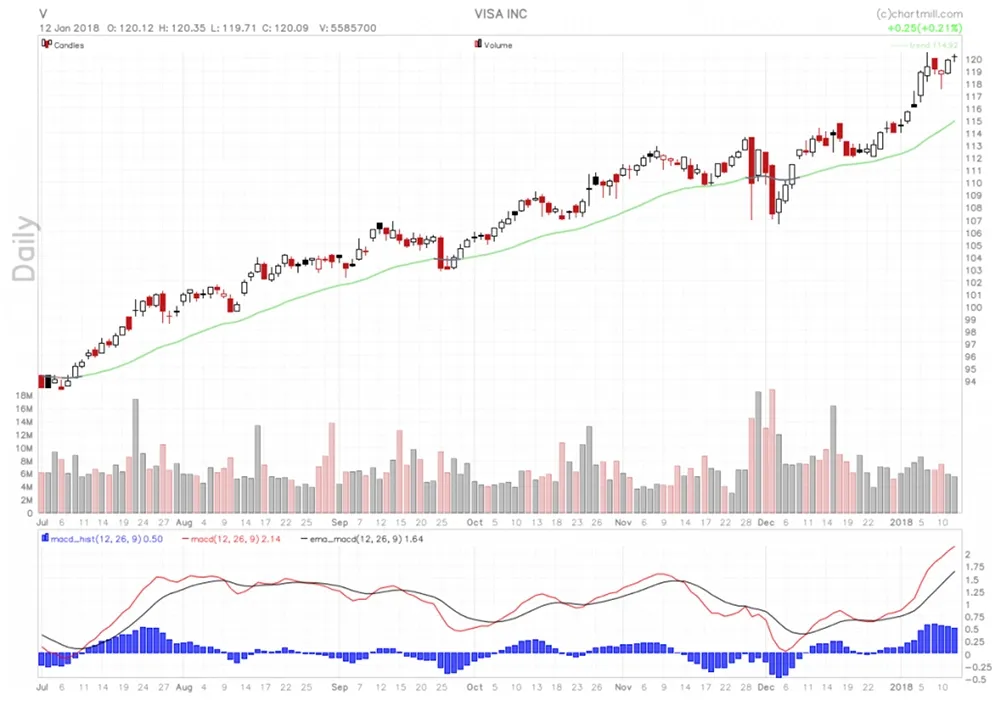
The MACD displays buy and sell signals when there is an upward or downward crossing between the red and black lines. The results that the indicator gives for going long or short are not in themselves sufficient to allow trading on the basis of these results alone. There are, in fact, many false signals. The example chart below clearly shows what we mean.
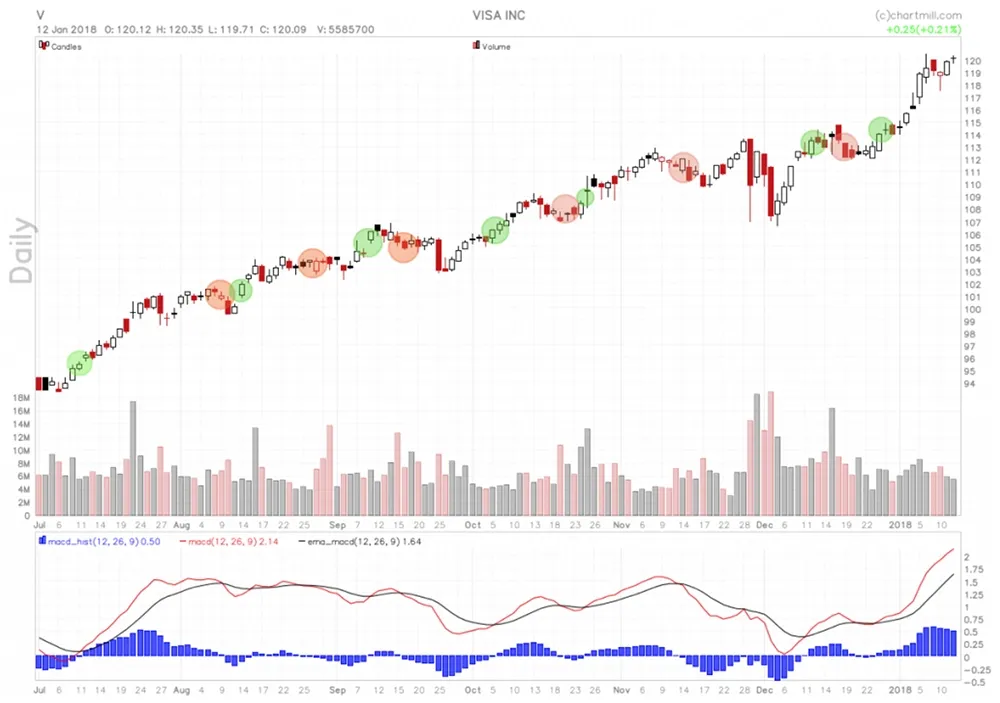
The green circles are the moments when the red MACD line crosses the black signal line upwards. These are buy signals. The red circles indicate the sales signals, i.e. when the red MACD line crosses the black signal line downwards. As you can see, not all signals are equally reliable. In the graph above it is quite clear that none of the sales signals were really successful. In the next section we will use a specific tool in combination with the MACD indicator, which will make the reliability (and therefore also the usability) of this indicator a lot better!
Avoiding false MACD signals with the ChartMill Trend Indicator
We already covered exactly what the MACD indicator does and how you can use it as a momentum indicator. However, we also indicated that by no means all buying or selling signals are equally successful! Fortunately, there is a simple way to detect these false signals to a large extent in advance and thus also to avoid them.
Avoiding false signals
Looking back at the graph above it is quiet obvious that - just like any other technical indicator - the MACD is not a 'Holy Grail' indicator either. What's more, by relying solely on the pure buying and selling signals of the MACD, you'll eventually lose money, not only because the indicator itself is not reliable enough, but also because you'll be doing mass trades with all the associated costs...
The red dots on the price chart show the sell signals of the MACD indicator, despite the fact that the price continues to rise. As a trader you prefer to ignore them, unfortunately you don't know in advance whether such a signal will be false or successful.... That does not mean, however, that the MACD indicator is completely useless; we simply need to find a way of ensuring that we can avoid a large proportion of the false signals beforehand. In this article we use the ChartMill Trend Indicator for this purpose.
The ChartMill Trend Indicator as an extra filter
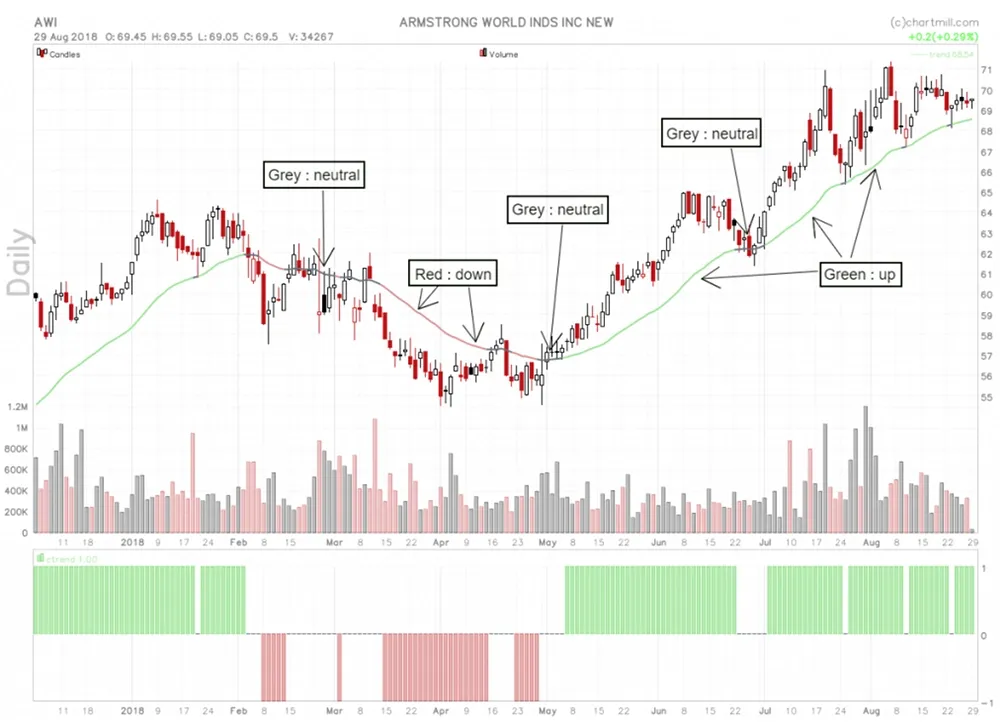
The ChartMill Trend Indicator is an exponential moving average line that roughly represents the trend of the share. You can display it as an overlay on a chart or as a bar indicator underneath the chart. If the indicator is green, the price rises, the line is red when the price falls and grey means that the price zone is neutral.
Remember, in particular, that the ChartMill Trend Indicator reflects the current trend of a price chart. When applied to the first graph of the VISA share in this article, we get the following chart:
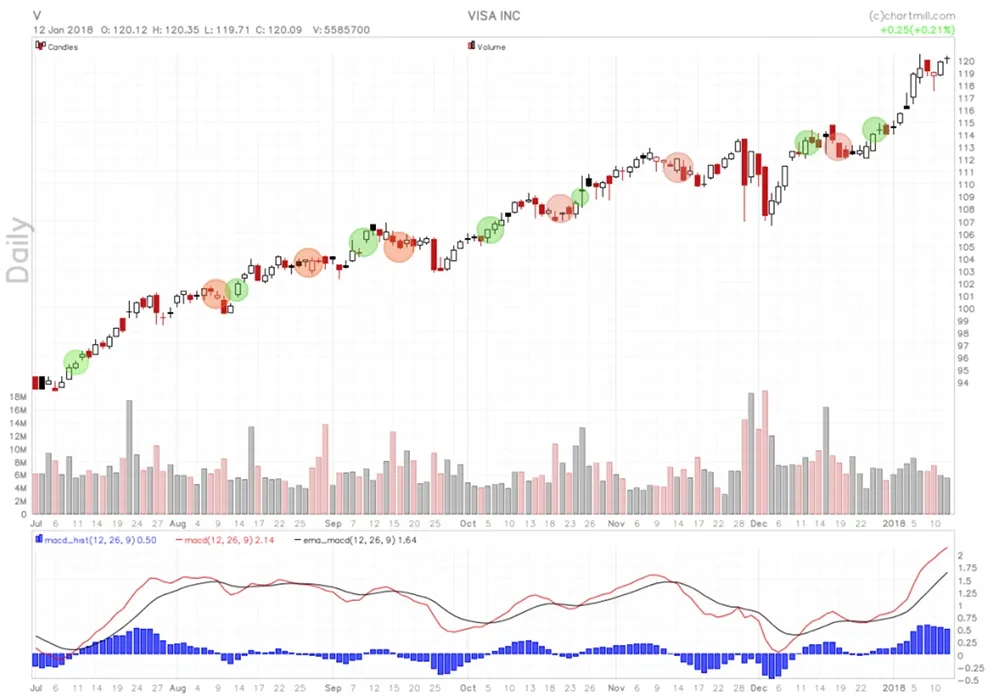
As you can see on the graph above, we are clearly facing an upward trend as far as the VISA company is concerned. Because the ChartMill Trend Indicator clearly shows the existing trend, we can use it as an extra filter for our MACD indicator. As a rule, we will ignore all MACD sales signals if the ChartMill Trend indicator is green! If we apply that rule to the first graph of this article we get this :
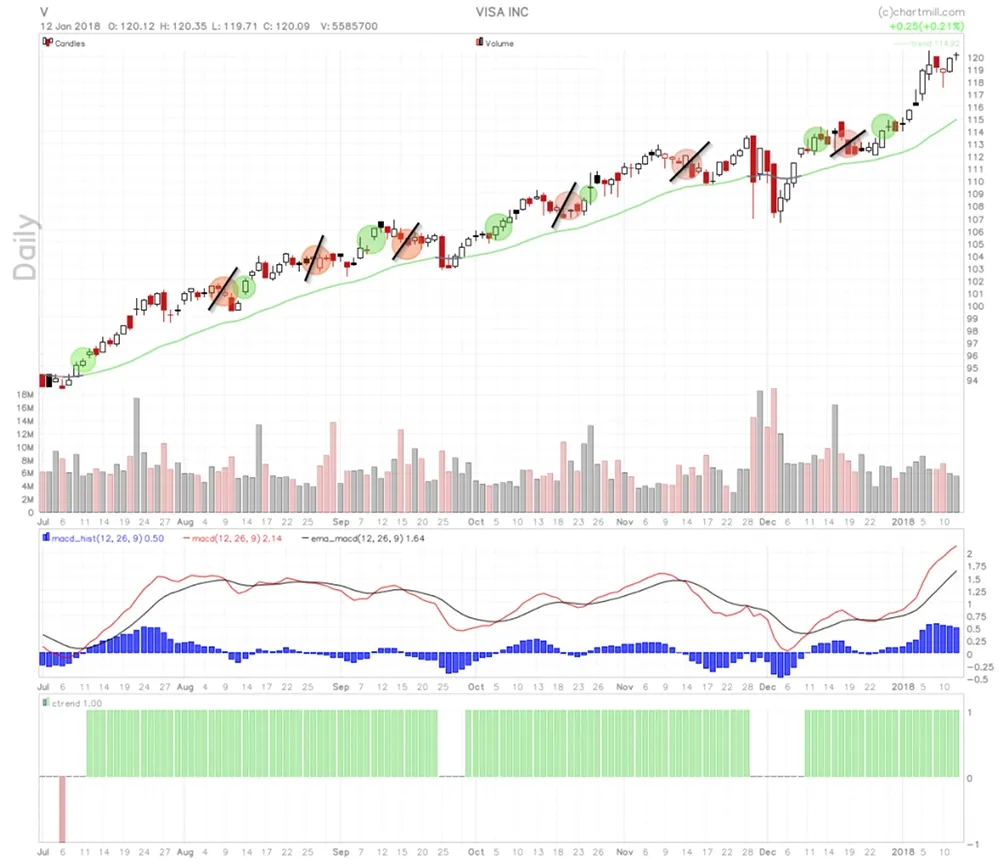
Indeed, by applying the ChartMill Trend Indicator in this case (which by its green color indicates that the trend of the stock is increasing) we manage to avoid all the false sell signals of the MACD. The same method can of course also be applied if the trend of the stock is clearly decreasing (ChartMill Trend Indicator is red) and the MACD indicator generates buy signals.
Conclusion
As with all other technical indicators, as far as the MACD indicator is concerned, you can never simply use all the signals as buy and sell triggers. There are simply too many (false) signals. An additional indicator that indicates in which trend the stock is and then uses this information in combination with the MACD signal ensures that already a lot of false signals are filtered out.