
Technical Breakout Setups
The Technical Breakout Setups will filter for stocks with a good Technical Rating and a good Setup Rating, leading to a list of breakout setups in the best performing stocks in the market. Both the Technical Rating and the Setup rating are proprietary ChartMill indicators, which we will discuss in more detail here and in the linked articles. Also check out the General Trading Tips, which gives some general pointers.
Trading made easy
Trading can be very complex. Technical analysis can be very complex too. But they could be really simple, easy and clear. At chartmill we create tools that makes technical trading easy (and profitable!). When you are trading, there are typically 2 questions you need answered:
- Which stock should I buy?
- When should I buy it?
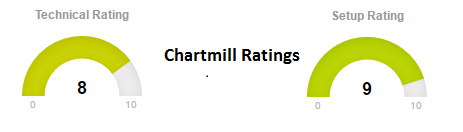
For answering these questions, we introduced the chartmill Technical Rating and the Setup Quality Rating. The analyzer nicely shows these ratings on a single page and also explains why the rating applies.
In this article we will demonstrate how these ratings can be used to answer the which and the when questions.
Which stock should I buy?
Well, in short you want your stock to be technically solid. For determining the technical health of a stock, we introduced the 'Chartmill Technical Rating'. Every stock in our database has a technical rating assigned to it which is updated every day after the trading day. The technical rating is a simple number between 0 and 10 where 0 is assigned to the worst stocks and 10 to the bests. You can say:
- Stocks with a rating between 0 and 3 will be in a downtrend
- Stocks with a rating between 4 and 6 will be going somewhat sideways
- Stocks with a rating of 7 or above will be in an uptrend.
Also note that the technical rating will not change too much on a day to day basis. Improvements in rating only happen gradually. The example below how the technical rating can evolve over time:
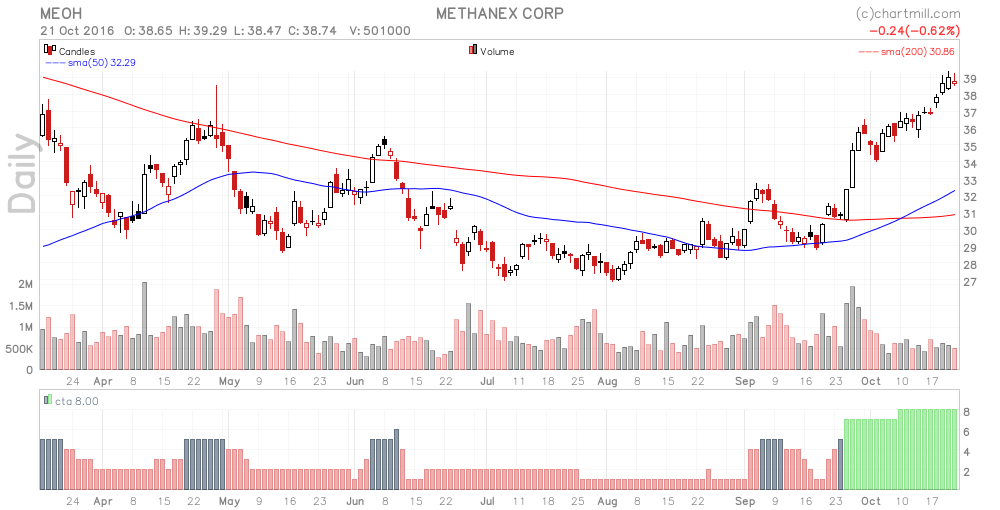
You can see that over time, the technical rating varied between 2 and 6 when the stock was going somewhat down and sideways. Very recently, the stock started improving and now we see a rating above 7.
When should I buy it?
So the technical rating tells you whether a stock is technically solid, where 'solid' means it is rising. However, just having a stock that rises is not a reason to just jump on it and buy it. What you need is a good entry point. You never want to jump on a stock that has just risen 10 or 20% as you will have a good chance that right after you buy, a correction will start. So you want to look for consolidation zones, where the stock has been trading in a stable range for some time and you want to buy when it starts its next move.
This is why we introduced the 'Chartmill Setup Quality Rating'. The setup quality is also a number between 0 and 10 which indicates the level of consolidation we currently see in the stock. The higher the number, the more tight is has been trading in the recent period. When trading has been tight, it means you have a clear area of support and you can easily find a nice place to put your stop. ( = where you take a loss when the breakout does not happen).
Stock typically move in bursts: you have periods of fast progress and periods of consolidation. It is only in these breakout periods that we want to be in the stock, as this is where gains can be produced fast. A nice example can be found in the picture below:
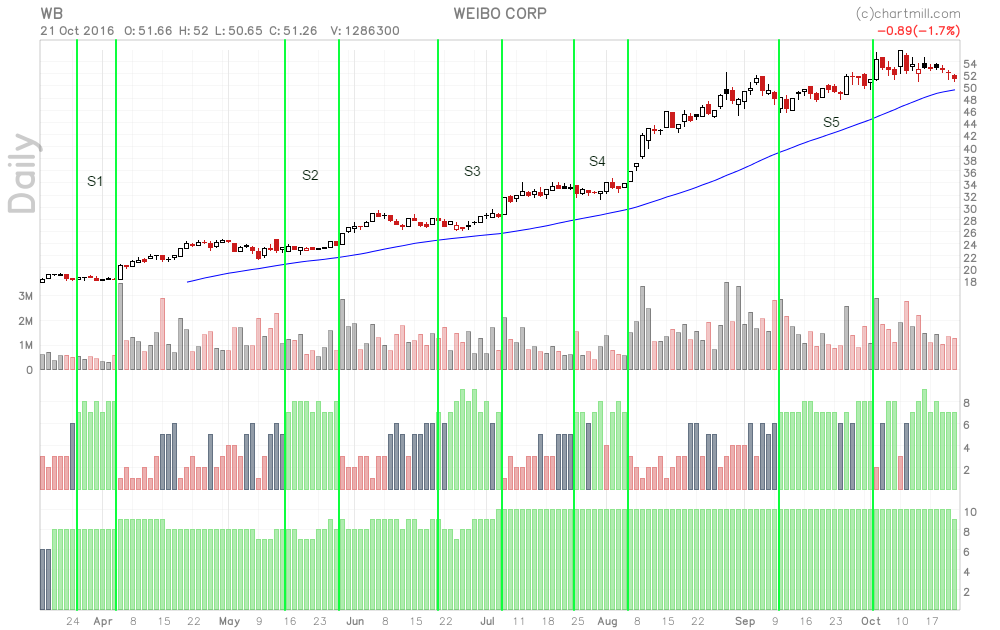
The first indicator just below the chart is the historical chartmill setup quality rating, the last one is the historical technical rating. We can observe:
- The technical rating for the stock has always been above 8. So the whole time, this was a technically solid stock.
- The periods with a decent setup quality have been marked on the chart as S1, S2, S3, S4 and S5. These periods identify when the stock could have been bought.
- The first 4 periods of high setup value have lead to nice profits.
- For the last period (S5), some kind of breakout happened, but the stock came back into a consolidation.
One important thing to note is that a high setup quality rating does not mean that you should just buy the stock immediately. It means there will be a nice place to be found on the chart for a buy stop order. You should only buy if the actual breakout also happens. (Sometimes the breakout point will never be reached and in this case you will also not lose anything, you only need to cancel your order).
Stock Screening for Technical Breakout Setups.
The Technical Breakout Setups Screen finds stocks which meet the following criteria:
- Chartmill Setup Quality > 7: This ensures some kind of consolidation is going on at the moment.
- Chartmill TA Rating: Rating >= 7: This ensures the stock is technically solid and has its trend in the right direction.
- ATR > 1: This is just added to avoid stocks which are not moving anymore. (Often after a buyout the stock trades flat at a fixed level, we want to filter out these stocks).
Some additional filters for mimimum price and volume are added by default. You can change these to your own preference, together with the desired market and other general filters.
Example result from the screen
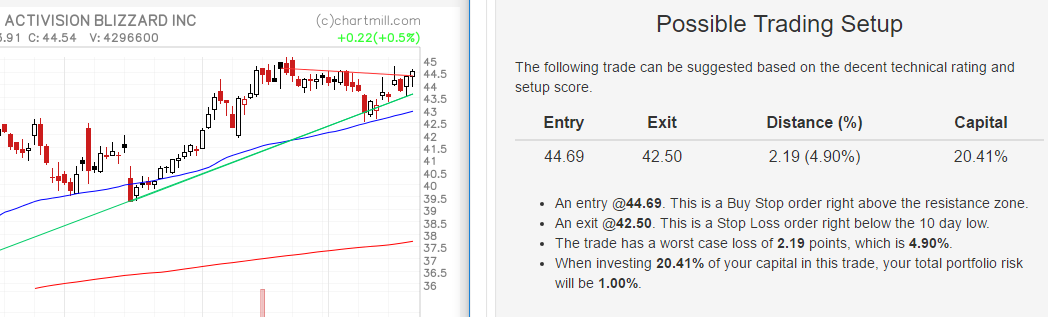
In this case, the stock ATVI shows a nice consolidation pattern (setup quality of 9) and is a technically solid stock (technical rating of 9). The possible setups suggests an entry above 44.69 and an exit below the 10 day low. Depending on your trading style, you could even put the stop a bit tighter.
As you will also read in our General Trading Tips, there are a few points to be noted here:
- Although the screen will find nice setups, there is never any guarantee of what will happen. Always make sure to use stops and check for pending news or earnings releases
- Manual filtering is always needed. The goal of the screen is to give you a list with potential nice setups. It is up to you to validate these and to find the best ones. The screen just does 90% of the work.
- The possible trading setup is an automatically generated example. This is not trading advice and it is advised to find your own entry and exit points based on your personal strategy. Our position sizing tool can be a great help here. Also, the generated trading setup can be rather aggresive. The stop distance can be tight, which means a high change of getting stopped out. You should adjust so that it matches your own strategy.
- The example setups, as shown in the screenshot above, are available in the analyzer module.
Running the screen.
Good news! Fresh setup setups can be found every day. You can easily find them in the analyzer module or you can run it in the Technical Breakout Setups Screen in our stock screener.
The analyzer is a simplified stock screener, which is a very good starting point if you find the full screener a bit too intimidating. The analyzer provides a full report on every stock, including:
- An analysis of the technical health of the stock.
- An analysis of the setup quality of the stock.
- An analysis of the support and resistance area's.
- A concrete trade suggestion based on the analysis.