Advanced Stock Screener for Technical and Fundamental Analysis
Everything You Need for Stock Screening and In-Depth Analysis
ChartMill is an advanced stock screener and analysis platform designed for traders and long-term investors.
Filter stocks using powerful technical and fundamental criteria, analyze charts and financial statements, track earnings estimates and discover new opportunities — all in one integrated workflow.
Comprehensive Screening
Use our advanced stock screener to filter markets with powerful technical and fundamental criteria to quickly identify trading and long-term investment opportunities.
Fundamental Analysis Tools
Analyze valuation ratios, profitability metrics, financial health indicators and earnings data to assess the long-term strength of any company.
Advanced Technical Analysis
Explore price trends, relative strength, chart and candlestick patterns using a wide range of professional technical indicators.
Education and Resources
Access detailed documentation, strategy guides and educational videos to improve your stock screening and analysis skills.
Customizable Screens and Views
Start with pre-configured screens or build your own. Customize filters, columns and chart layouts to match your workflow.
Risk Management and Alerts
Use our position sizing tools, watchlists and real-time alerts to manage risk and stay informed about market opportunities.
Stock Analysis
Each stock profile page provides a detailed overview of price action, technical indicators, valuation metrics, financial statements, earnings estimates and proprietary analysis reports.
Make informed decisions using structured reports and clearly organized data that combines technical trends, financial strength and valuation analysis.

Fundamental Analysis Report
Every stock includes a comprehensive Fundamental Analysis Report, updated daily and structured around profitability, growth, financial health, valuation and dividend quality.
Proprietary ratings summarize each dimension, allowing you to quickly assess the fundamental strength of any company.

Technical Analysis Report
The Technical Analysis Report evaluates short- and long-term price trends, relative strength, support and resistance levels, and key chart and candlestick patterns.
A proprietary Technical Rating and Setup Rating help quantify trend strength and consolidation quality.

Earnings Estimates
Access long-term analyst estimates for EPS, revenue, EBIT and EBITDA, including calculated growth rates and acceleration metrics.
Track earnings surprises and estimate revisions over time to monitor improving or weakening expectations.

Advanced Stock Charts
Analyze price action with automated support and resistance detection and a wide range of professional technical indicators.
Annotate charts, switch to full-screen mode and use integrated position sizing tools to refine your trade planning.

Analyst Ratings and Price Targets
Review analyst ratings, price targets and historical upgrades and downgrades.
A summarized Buy % Consensus rating provides a quick overview of overall analyst sentiment and can be used as a screener filter.

Advanced Technical Metrics
- Relative Strength indicators
- Pocket Pivots and Effective Volume
- Support and Resistance Zones
- Chart and Candlestick Patterns
Advanced Fundamental Metrics
- Earnings Surprises and Estimate Revisions
- Growth Acceleration Metrics
- Industry and Sector Rankings
- Long-Term Profitability Metrics (ROA, ROE, ROIC)
- Piotroski Score and Altman Z-Score

Financial Statements
Access up to 10 years of annual and quarterly financial data, including GAAP and non-GAAP earnings, with historical trend visualization.
Ownership and News
Analyze insider and institutional ownership, transaction history and the latest company news.
Trading and Investment Ideas
ChartMill includes a large library of pre-configured stock screens designed around proven technical and fundamental criteria.
These screens are built on structured technical and fundamental metrics, allowing you to quickly identify opportunities while maintaining full control over your selection criteria.

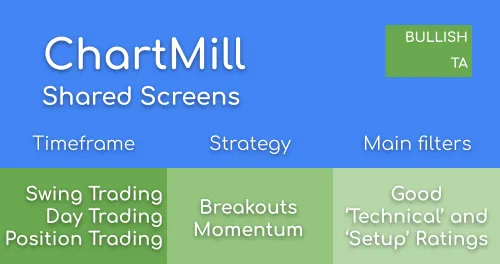
Breakout Screens - Good Technical and Setup ChartMill Ratings
Squeeze Play Setups
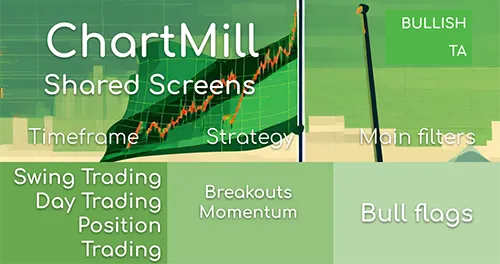
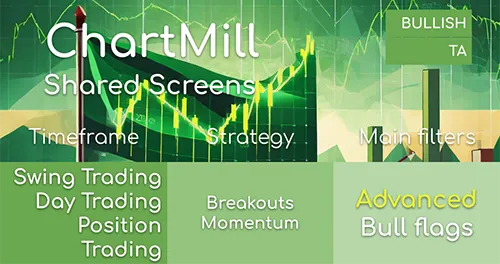
Bull Flags
High Tight Flag
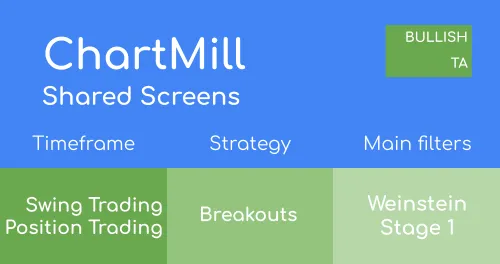
Weinstein Stage 1 Setups

Mark Minervini - Trend Template
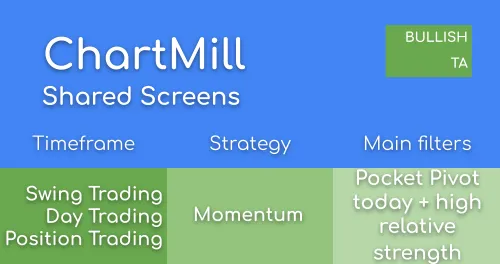
Momentum Screens - Pocket Pivot Today in Strong Stocks (high relative strength)
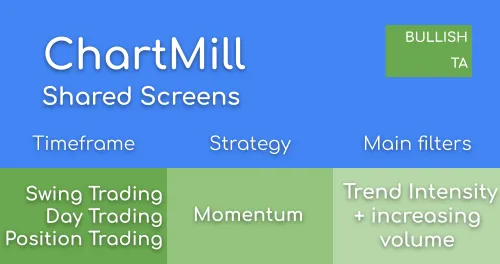
Momentum Screens - High Trend Intensity on Increased Volume
Momentum Screens - Pocket Pivot Today in Strong Stocks (high relative strength)
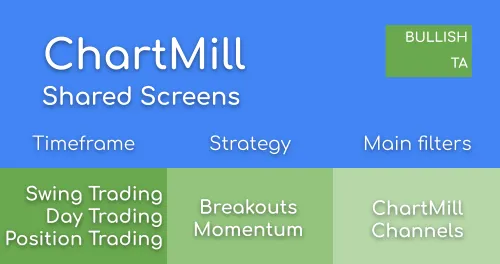
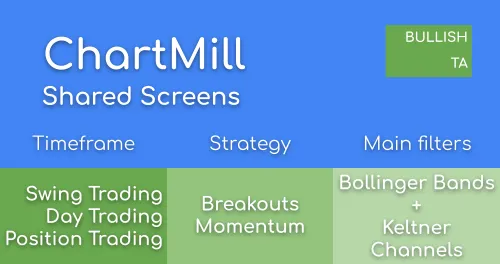
Breakout Screens - Finding Narrow Trading Ranges using ChartMill Channels

Peter Lynch Strategy
Terry Smith: Quality at fair price

The little book that makes you rich - growth stocks
Compounding Quality Screener
Caviar Cruise Base - Searching for Quality
Valuation Screens - Undervalued Stocks
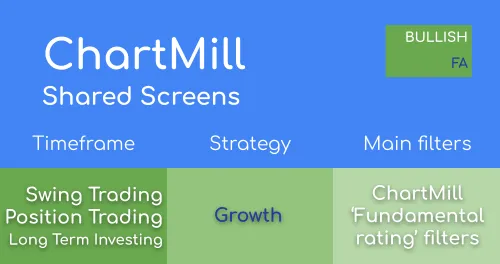
Growth Screens - Affordable Growth Stocks
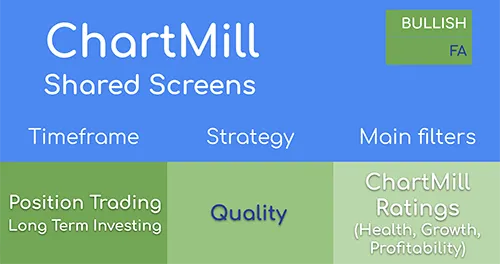
Finding Quality with ChartMill Ratings
Powerful Stock Screening Tools
At the core of ChartMill is a professional-grade stock screener designed to help traders and investors identify opportunities efficiently.
Filter, sort and analyze stocks using structured technical indicators, fundamental metrics and analyst data — then customize how results are displayed.

Technical Stock Screener
Use a wide range of technical filters to identify breakout, pullback and momentum setups.
Screen by relative strength, moving averages, performance trends, proprietary ChartMill ratings, support and resistance levels and automated chart pattern detection.
View results as charts to quickly scan multiple setups and evaluate price action efficiently.

Fundamental Stock Screener
Apply comprehensive fundamental filters to find stocks that meet your investment criteria.
Screen for valuation, profitability, financial health, earnings growth, dividend quality and more.
Whether you focus on growth, value, quality or income investing, the screener provides structured metrics to support your decisions.

Analysts Filters
Filter stocks based on analyst ratings, price targets, forward estimates, earnings surprises and estimate revisions.
Custom Filters
In addition to thousands of predefined filters, you can create custom screening expressions using advanced logical conditions and formulas.

Flexible Views
Choose from a wide selection of predefined table and column views, displaying the technical and fundamental metrics most relevant to you.
Custom Views
Create personalized result layouts with the data and charts that match your workflow.
Learn and Grow
The platform is developed by market professionals with decades of experience in both active trading and long-term investing.
Our continuously expanding knowledge base includes in-depth articles, practical screening examples and educational videos to support your development.
Complete Market Analysis Platform
Choose Your Investing Approach
Explore dedicated guides tailored to your trading or investing style:
Partner With Us
If you run a community, newsletter or educational platform, learn how you can partner with ChartMill through our affiliate program.
