

(All data & visualisations by ChartMill.com)
Daily Market Trend Analysis – September 26, 2025 (After Market Close)
Short Term Trend
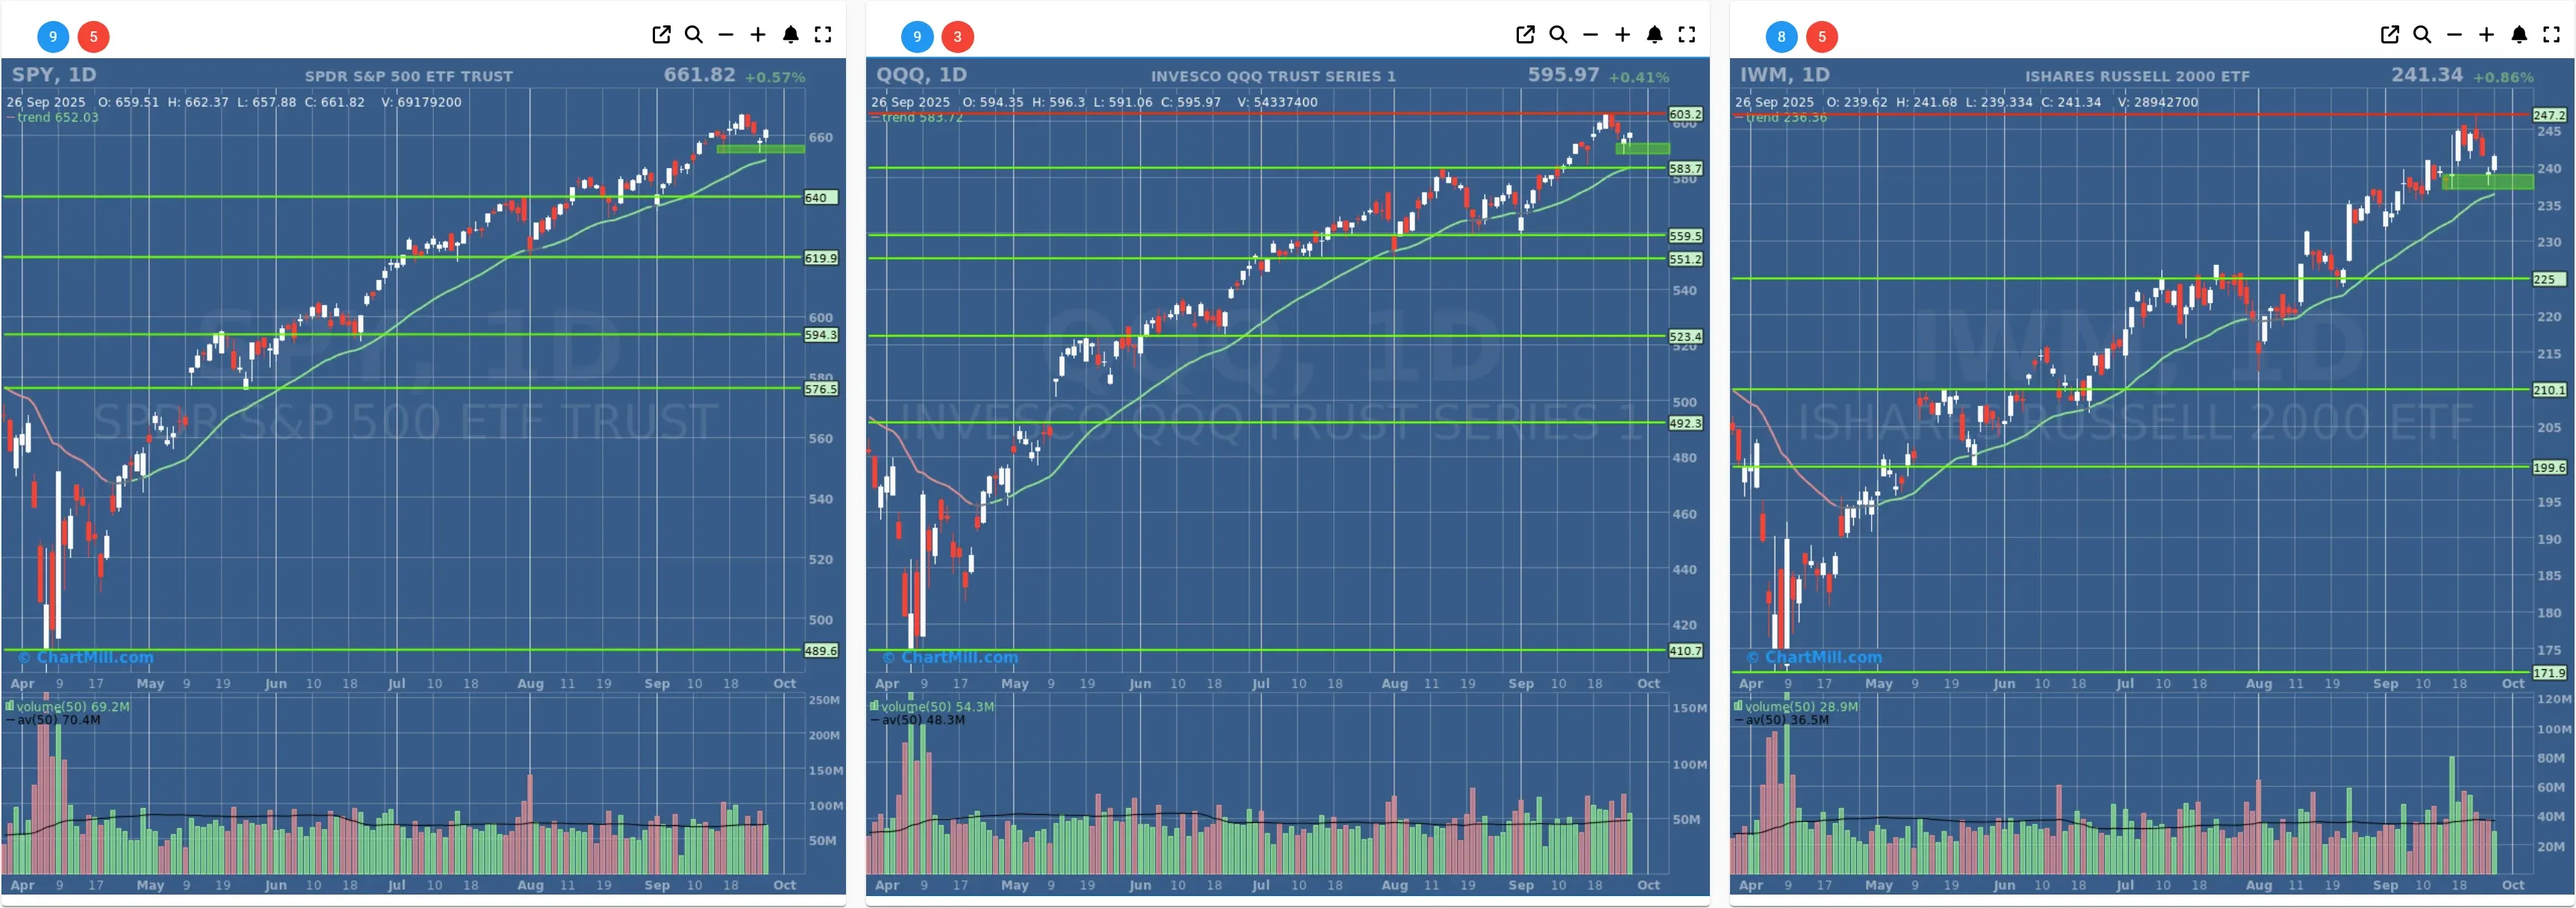
- Short-Term Trend: Positive (no change)
- Next Support at $660 - $650
- Next Resistance at $667
- Volume: At Average (50)
- Pattern: Up day- Reversal Pattern
- Short-Term Trend: Positive (no change)
- Next Support at $590
- Next Resistance at $603
- Volume: At Average (50)
- Pattern: Up day- Reversal Pattern
- Short-Term Trend: Positive (no change)
- Next Support at $235
- Next Resistance at $245
- Volume: Slightly Below Average (50)
- Pattern: Up Day - Gap Closing - Reversal Pattern - Strong Close
Long Term Trend
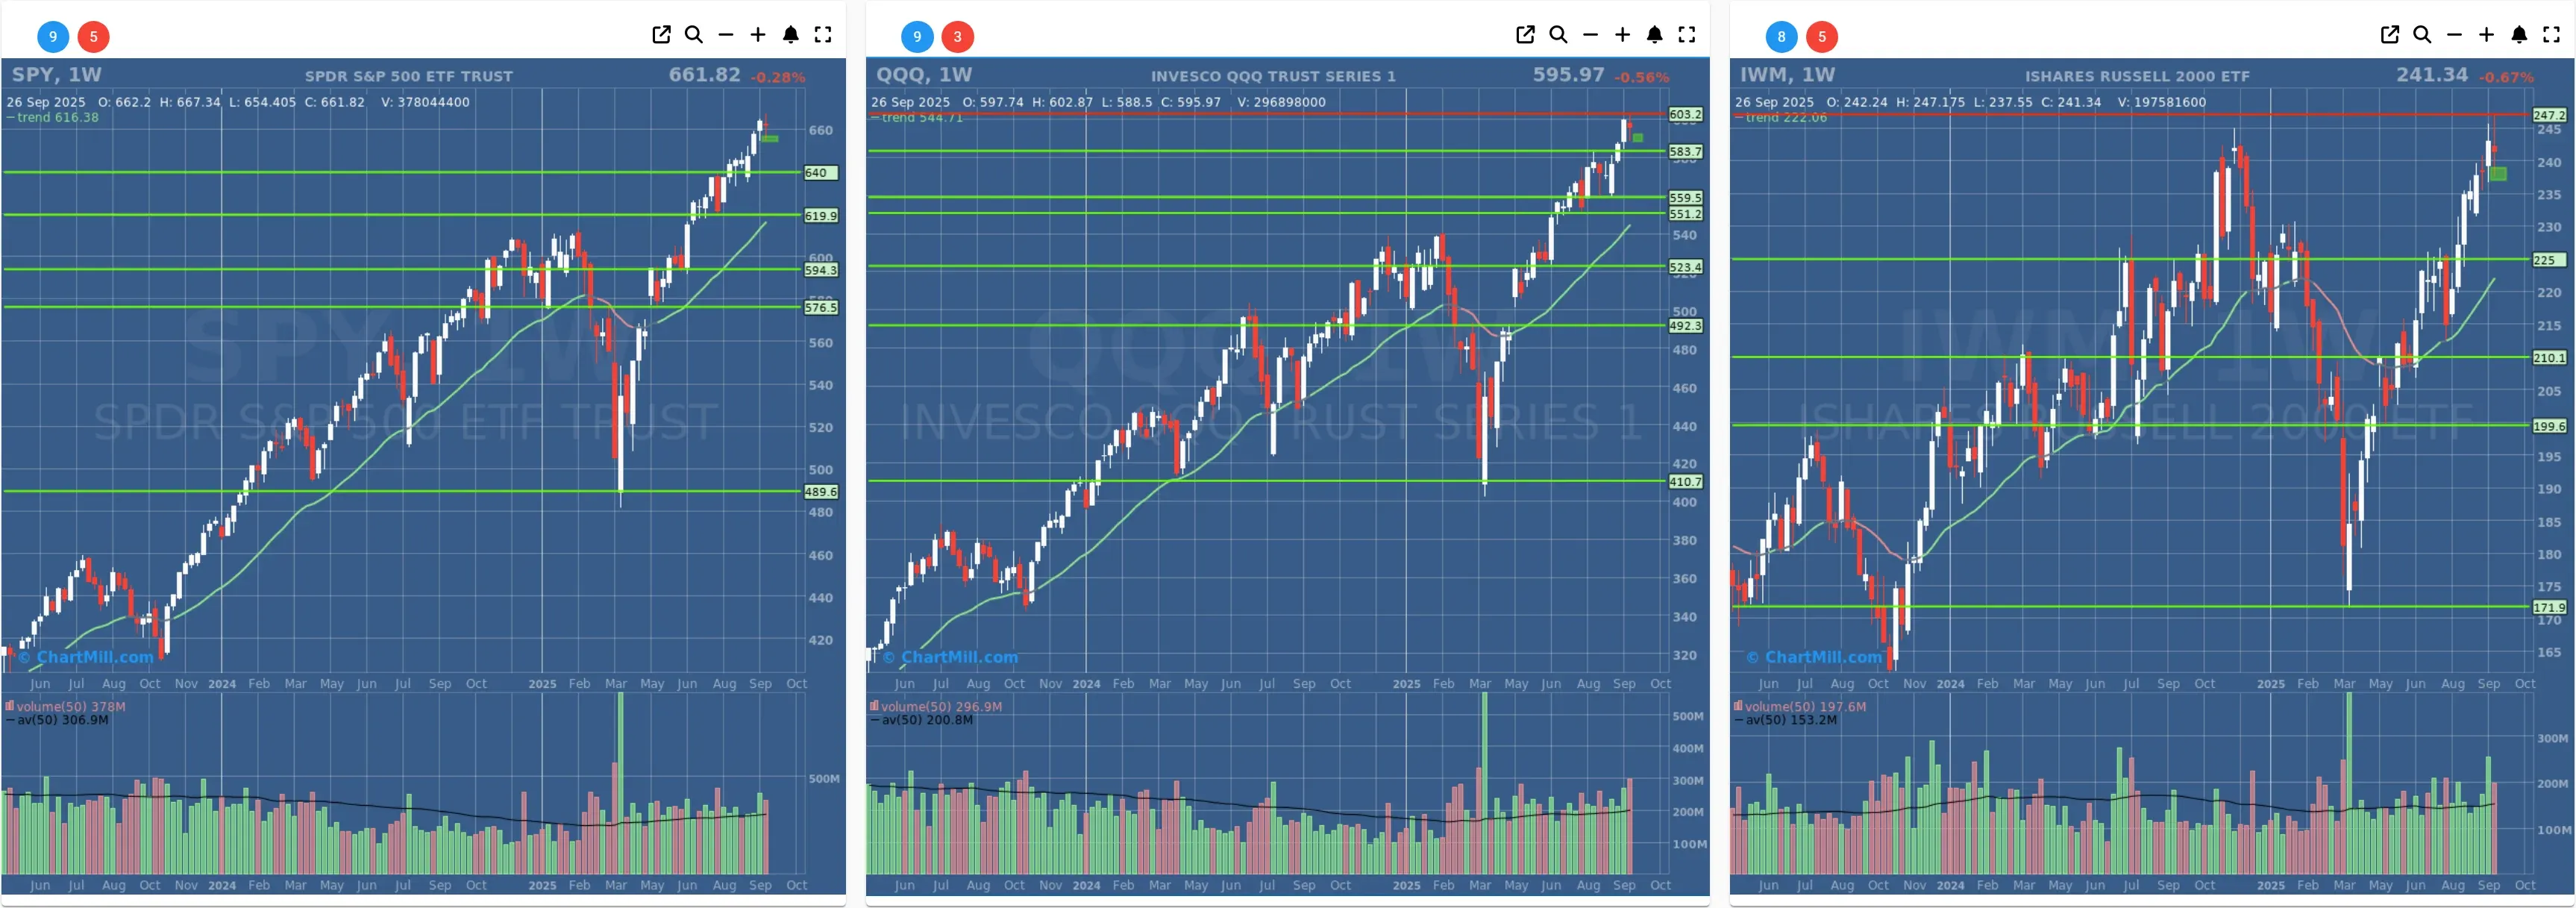
- Long-Term Trend: Positive (no change)
- Long-Term Trend: Positive (no change)
- Long-Term Trend: Positive (from neutral)
Daily Market Breadth Analysis – September 26, 2025 (After Market Close)
Following Thursday’s bleak breadth profile, Friday’s session offered a strong counterpunch.
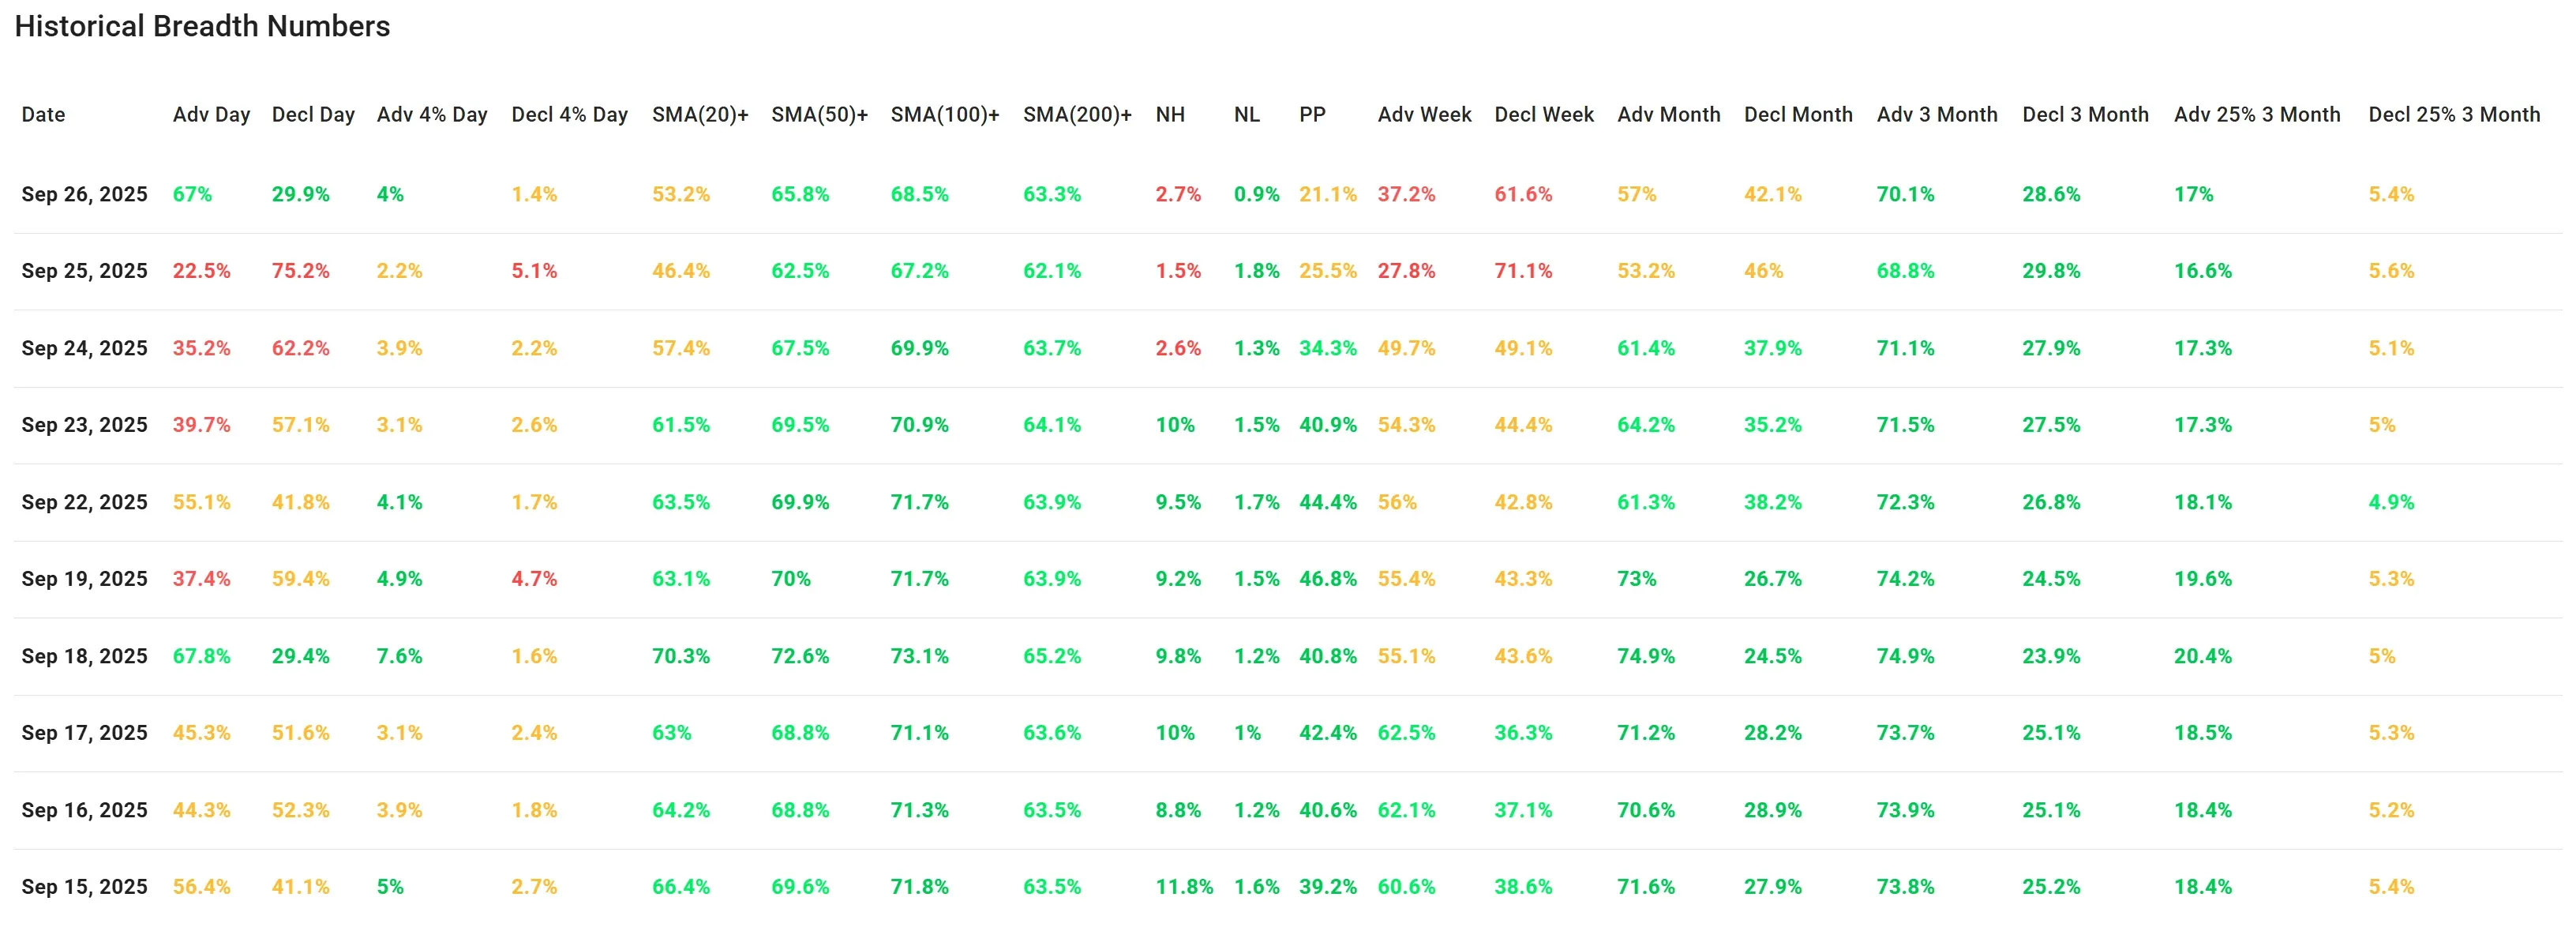
The percentage of advancing stocks jumped to 67%, sharply reversing Thursday’s 22.5%, and more closely aligning with the strength seen on September 18.
The improvement wasn’t just in headline advancers but also extended into more meaningful upside moves, 4%+ gainers rose to 4%, and decliners with 4% losses dropped to just 1.4%, both showing stabilization in short-term price action.
Short-Term Breadth: Improvement Across the Board
The percentage of stocks trading above their short-term moving averages recovered:
-
SMA(20)+ moved from 46.4% → 53.2%
-
SMA(50)+ up slightly from 62.5% → 65.8%
-
SMA(100)+ rose from 67.2% → 68.5%
-
SMA(200)+ ticked up to 63.3%
These upward moves suggest broad-based participation in Friday’s bounce — not just isolated sector strength.
New Highs vs. New Lows: Still Fragile
While Friday brought a slight increase in New Highs (NH) to 2.7%, the figure remains tepid and lower than the early September peak.
New Lows (NL) fell to 0.9%, offering some relief after edging up on Thursday.
Weekly and Monthly Breadth – Stabilizing, But Cautiously So
-
Advancing Week remains soft at 37.2%, though improving from Thursday’s 27.8%
-
Declining Week dropped to 61.6% (from 71.1%), suggesting the selling pressure slowed
-
Advancing Month rose to 57%, the highest level since September 19
-
Declining Month fell to 42.1%, continuing its reversal from Thursday’s 46%
Overall, the weekly and monthly metrics indicate a pause in the downward pressure, but they haven’t convincingly turned the tide yet.
Three-Month Breadth Metrics – Holding Ground
Longer-term breadth held steady:
-
Adv 3 Month: 70.1% (slightly down but still strong)
-
Decl 3 Month: 28.6%
-
Adv 25% 3 Month: 17%
-
Decl 25% 3 Month: 5.4%
No deterioration here, but no meaningful upward thrust either.
Conclusion:
Friday’s data show a convincing one-day rebound in breadth, reversing Thursday’s sharp decline and restoring short-term participation. However, key metrics like new highs and longer-term momentum still indicate fragility under the surface. Breadth needs sustained improvement in the early part of next week to confirm this as more than just a one-day reflex.
Breadth Trend Rating: Neutral
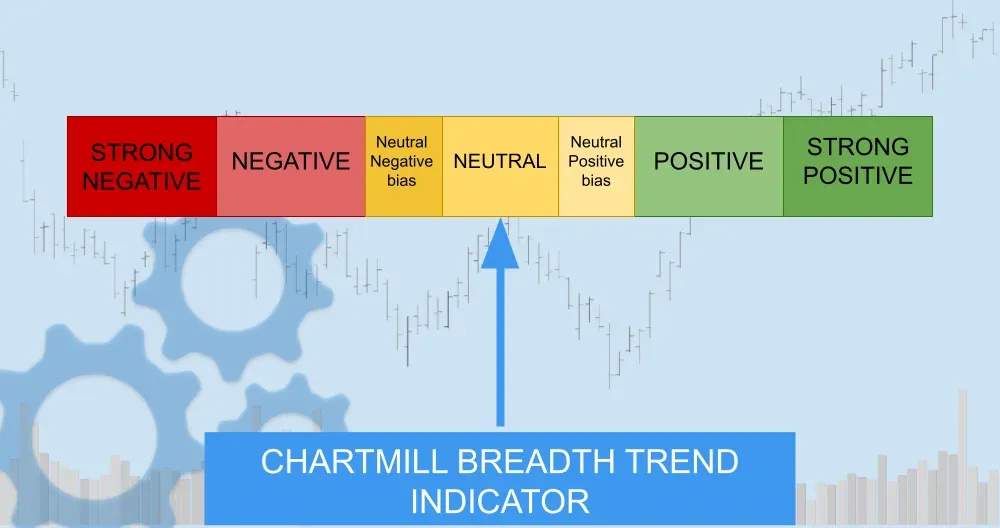
Despite Friday’s strength, the rebound appears reactive rather than trend-defining. Market participants should look for follow-through early next week to confirm this shift has legs.
Kristoff - ChartMill
Next to read: Wall Street Ends Losing Streak as EA and Intel Shine