Stan Weinstein stage analysis in chartmill
 Stan Weinstein's book 'Secrets for Profiting in Bull and Bear Markets' is without doubt one of the classics books traders and investors read. If you did not read it yet, we can certainly advise it.
We have support for Weinstein's methods in both the charts and the screener. This article will describe this.
Weinstein stage analysis
One of the concepts from the book that became classic is the definition of the four stages a stock can be in. This is shown on the picture below, taken from the book:
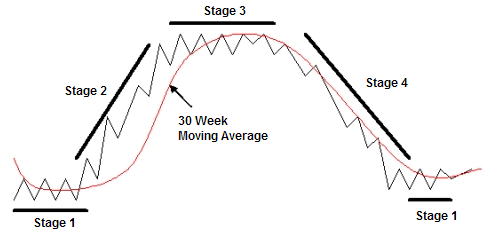
These stages basically classify the different periods in the lifetime of a stock. An important thing to understand is that Weinstein uses weekly charts and identifies the current stage based on the direction on the 30 week moving average.
We introduce the 'Chartmill Weinstein Stage Indicator' along with the 'Chartmill Weinstein Stage Length Indicator', available in our charts. As indicated by their name, these indicators will display the current Weinstein stage a stock is in and the length (in weeks) of the current stage. Check out the example below:
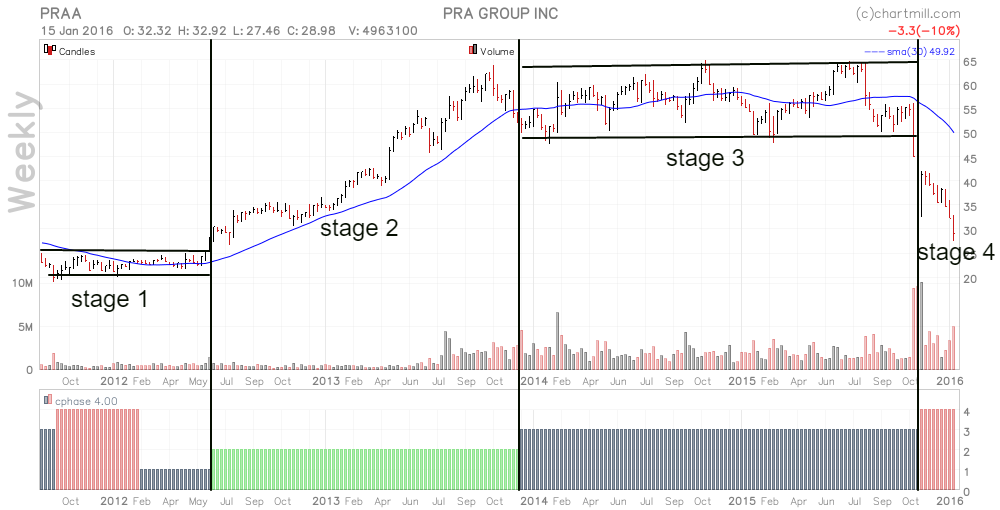
The chart is a very good example of Weinstein's theory and shows a very clean separation of the different stages. Unfortunately, in real life stocks do not always behave as they should ;-)
- Stage 1 is similar to Stage 3. Both are basing stages and the true stage level can only be identified after the next phase starts.
- After a stage 2 (Advancing) a basing period can occur. This can be both a 'Stage 3 distribution' period as an 'Intermediate Stage 1 Accumulation' period. Or in other words: typically an advancing stage will have intermediate basing stages after which the advance continues.
- For our indicator, we will define the stage depending on the previous stage. A Stage 1 always follows a Stage 4 decline and a Stage 3 always follows a stage 2 advance. (Even when after the fact it turns out to be an intermediate stage).
- Real life stocks do not always enter a long lasting single stage. Often you will see the indicator switch stages for shorter periods.
Other Weinstein chart settings
When you want to follow the trading method of Stan Weinstein, the following indicators could be useful on your WEEKLY charts:
- The long term 30 week simple moving average.
- The 'Chartmill Weinstein Stage Indicator'.
- The 'Chartmill Weinstein Stage Length Indicator'.
- Mansfield Relative Strength. This indicator shows how the stock's relative strength is improving or decreasing compared to the general market. This is also a key indicator used in Weinstein's work.
- Chartmill channels. These are mostly useful in basing stages to indicate the boundaries of the base. Also check out this article on Weinstein setups and chartmill channels.
This is a chart with these indicators. You can easily save these settings if you want to reuse them later.
Weinstein Stages Stock Screener
All these indicators are available in our stock screener. Many combinations are possible of course. You can find the Weinstein filters on the indicators tab, under the name "Weinstein".
These "Weinstein" filters allow you to select the stage. Additionally you can also filter on a minimum stage length.
- Our trading ideas page contains the Weinstein Stage 1 Setups screen. This screen looks for stage 1 stocks that are in this stage for over 30 weeks.
- The screen 'Weekly chartmill Channel breakouts' is also dedicated to finding long breakouts on weekly charts from a basing stage.