Tensions in the Middle East have taken a sharp turn in recent days. Following targeted U.S. military strikes on Iranian nuclear facilities, global markets are reacting to the renewed risk of escalation.
While geopolitical conflicts often cause short-term volatility, they also create significant trading opportunities, especially in specific sectors that historically benefit from instability.
In this short article, we explore how this crisis could impact the stock market, and where swing traders and investors can find potential setups during this uncertain time.
The Situation: U.S. Strikes on Iran
On June 22th, 2025, U.S. forces launched limited but strategic strikes on multiple Iranian nuclear-related sites, citing intelligence that suggested an imminent weapons development milestone. The Iranian government has condemned the strikes, and retaliatory rhetoric has intensified.
This sudden escalation has three immediate consequences in the financial markets:
-
Increased oil price volatility, Iran is a major OPEC player; any threat to regional stability can spike crude prices.
-
Heightened demand for defense assets, fear of conflict boosts expectations for defense spending.
-
Safe haven buying, investors often rush into gold and gold-related assets during geopolitical turmoil.
How Markets React to Geopolitical Crises
Historically, conflicts like the Gulf War, the Iraq War, and tensions with Iran in 2019–2020 have caused sharp but temporary stock market reactions.
-
Broad indexes often dip initially, but recover within weeks if the conflict doesn’t escalate dramatically.
-
Commodities like crude oil and gold spike.
-
Defense, energy, and precious metals stocks tend to outperform the broader market in the short term.
This type of environment is ripe for swing traders, those looking to capitalize on directional moves over a few days to a few weeks.
Swing Trading Setups in the Current Crisis
Here are three sectors to focus on, with specific stocks currently showing strong technical setups:
Energy (Oil & Oil Services)
Iran controls strategic shipping lanes like the Strait of Hormuz. Disruption or fear of it can spike oil prices, lifting oil producers and service companies.
Top Setups:
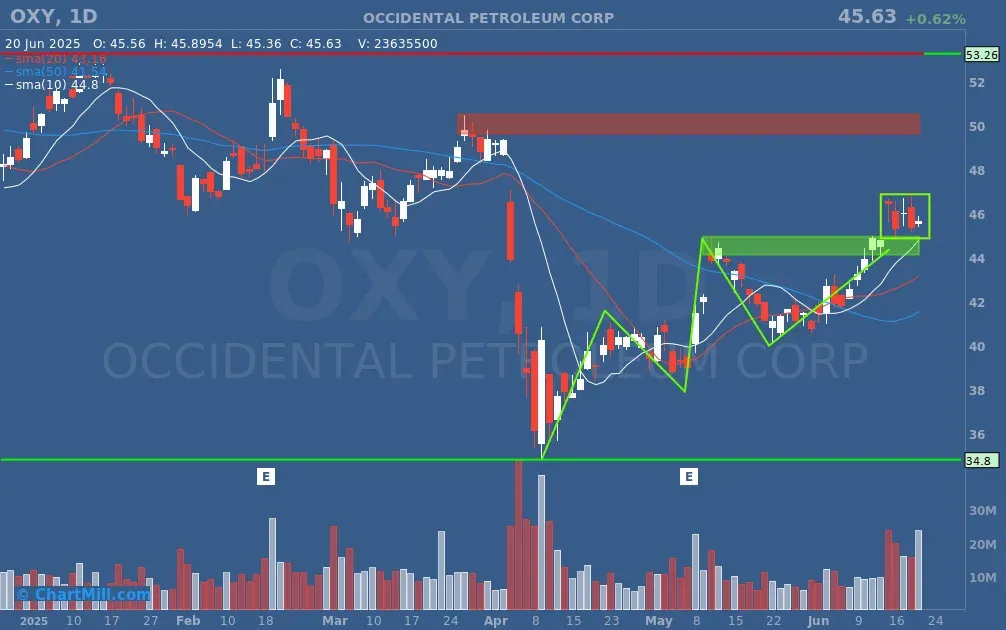
Occidental Petroleum (OXY): A narrow trading ranges setup near $46 with room to $53.26 resistance. Volume is stable, and price action is strong above key moving averages.
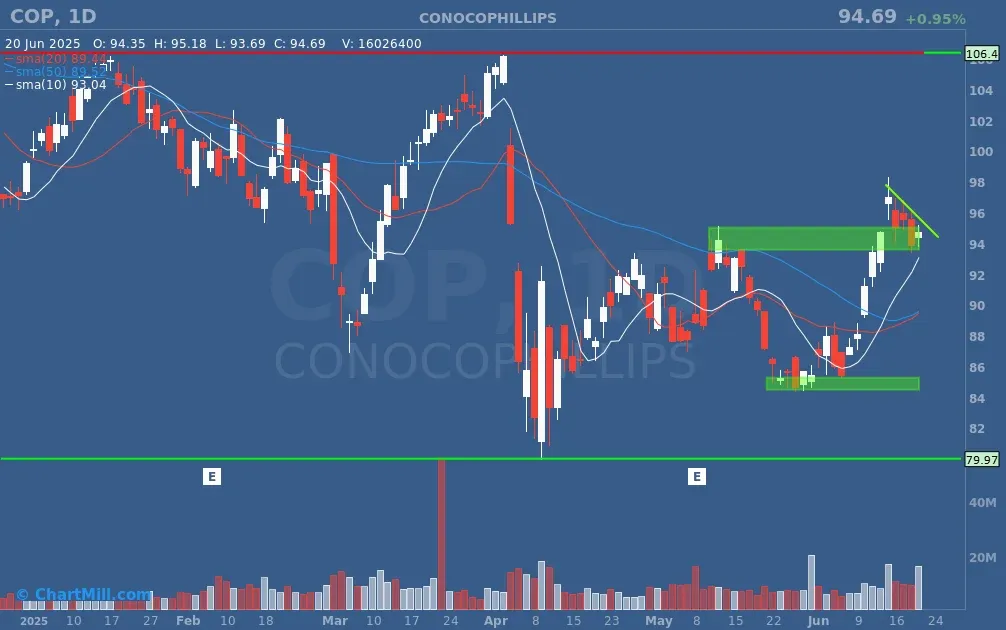
ConocoPhillips (COP): Broke above a tight base and is now forming a bull flag. A breakout above $95 could trigger the next leg higher.
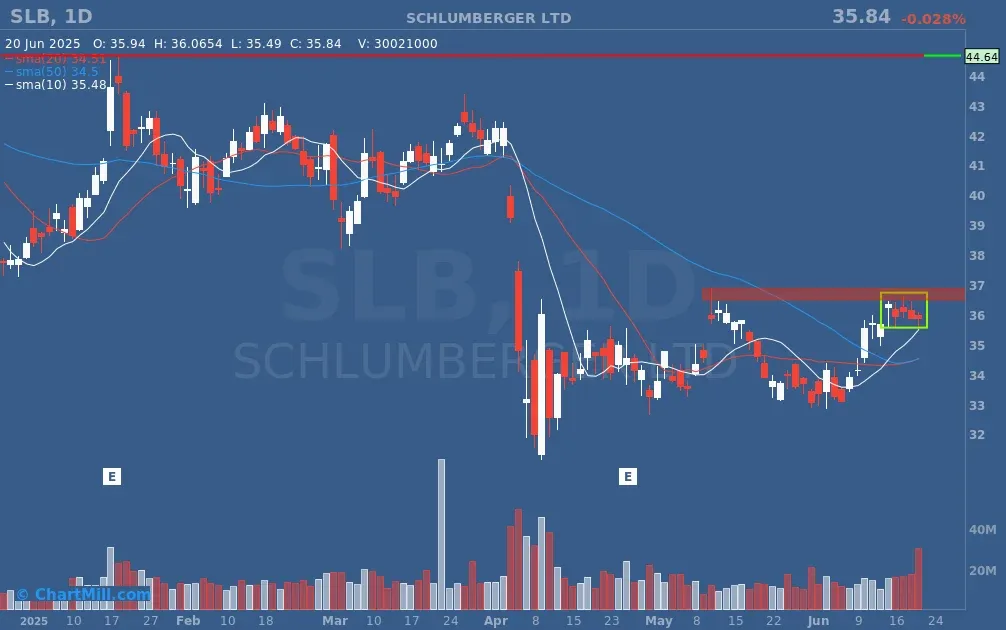
Schlumberger (SLB): Consolidating under resistance, a breakout above $37.00 could target mid-$40s if crude spikes further.
Gold & Precious Metals
Gold acts as a safe-haven asset during geopolitical and financial stress. Mining stocks often move more aggressively than the metal itself.
Top Setups:
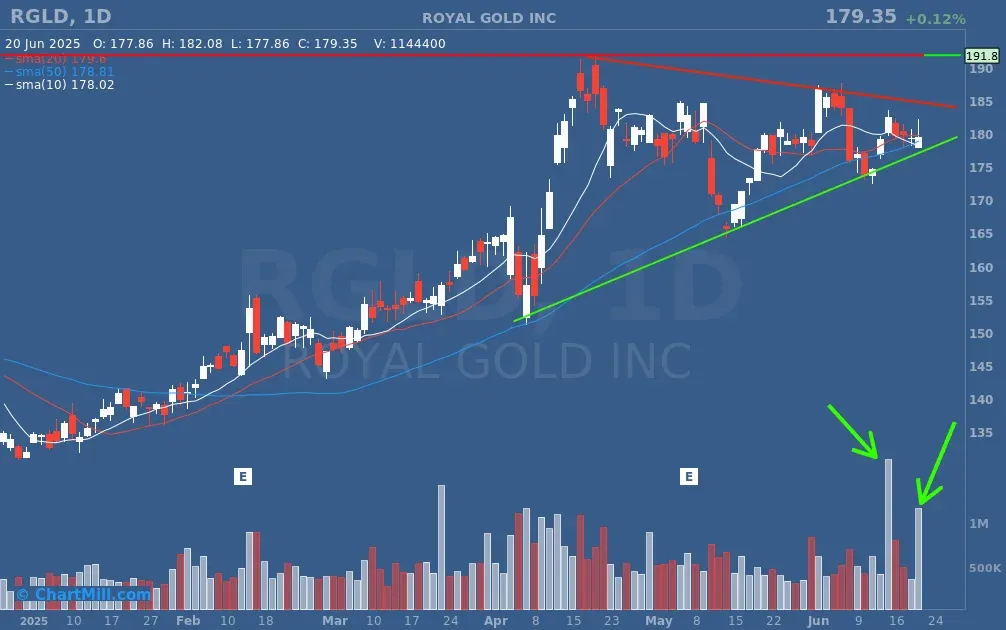
Royal Gold (RGLD): Coiling within a symmetrical triangle. Volume surges suggest institutional buying. A breakout above $182–185 could target $191.80.
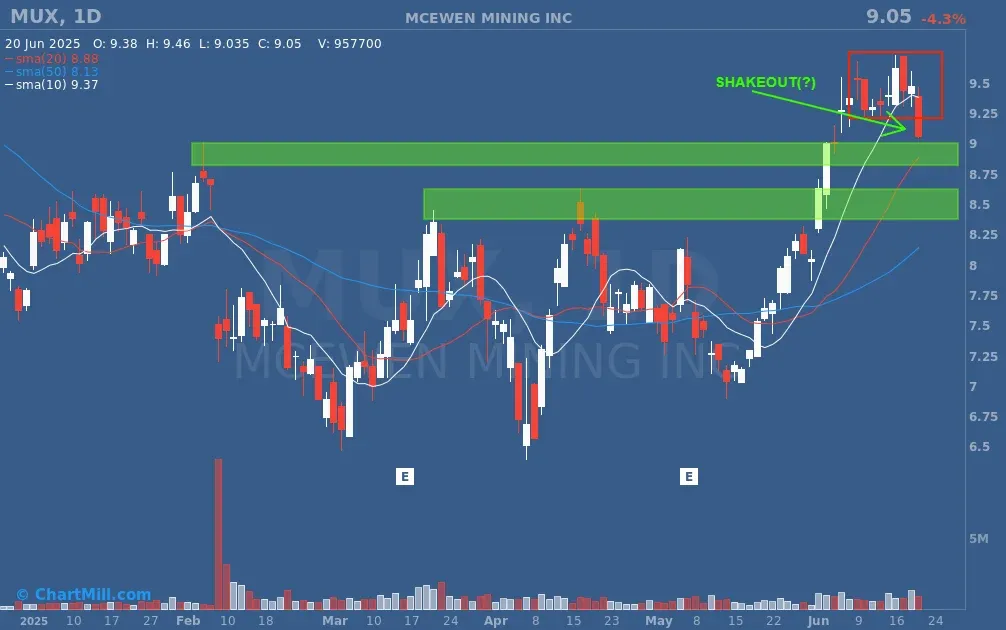
McEwen Mining (MUX): A potential shakeout near recent highs may present a second-chance entry. Watch for a reclaim of $9.25.
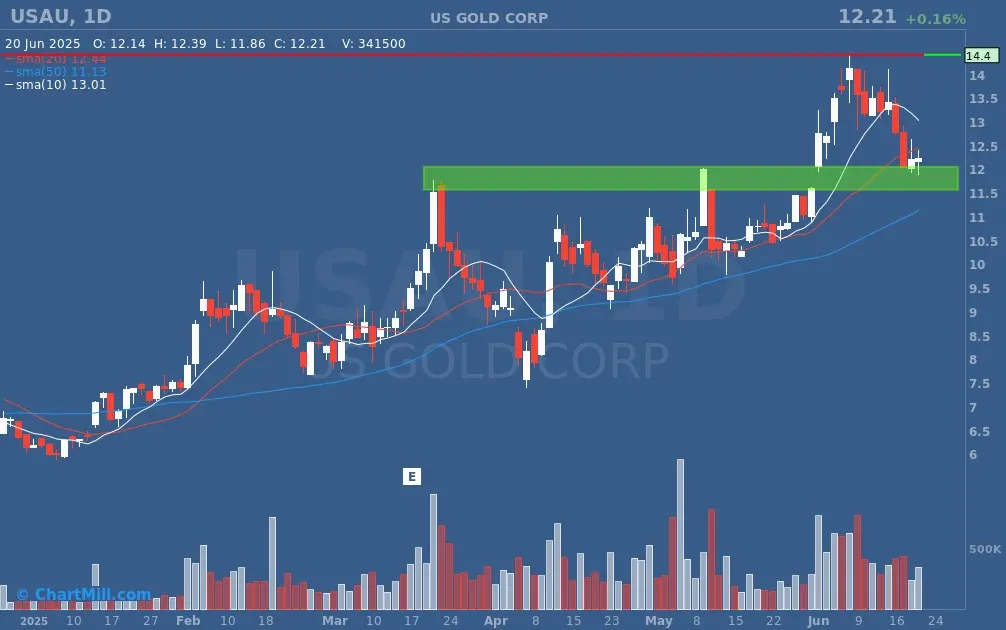
U.S. Gold Corp (USAU): Pulling back to retest the breakout zone around $12. A bounce here would keep the uptrend intact.
Defense & Aerospace
Rising military tensions often lead to increased defense budgets, new contracts, and renewed investor interest in companies serving the military-industrial complex.
Top Setups:
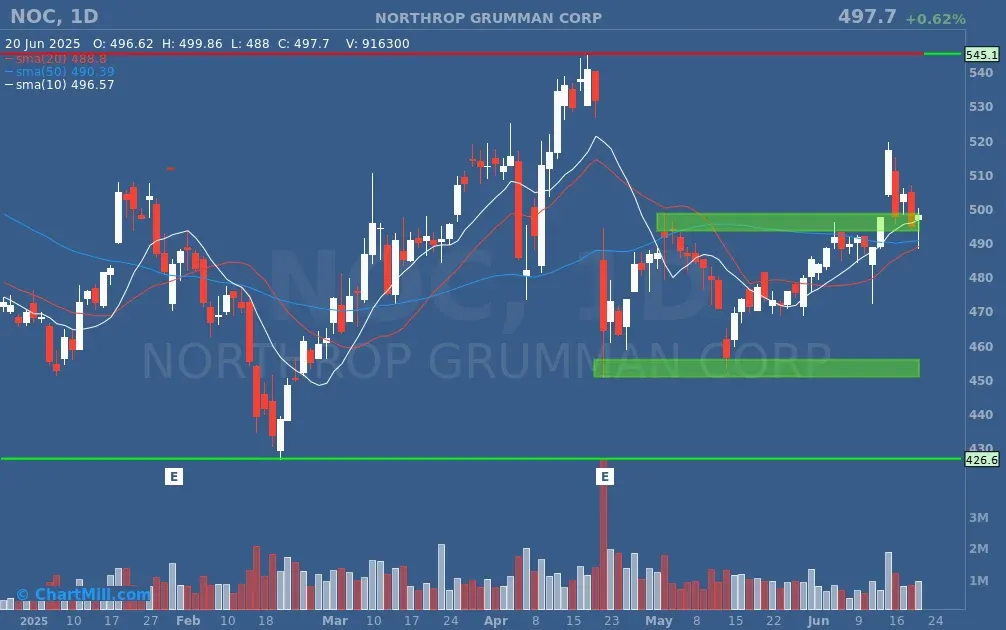
Northrop Grumman (NOC): Testing a recent breakout around $495–500. A hold here with volume could push it toward its $545 resistance.
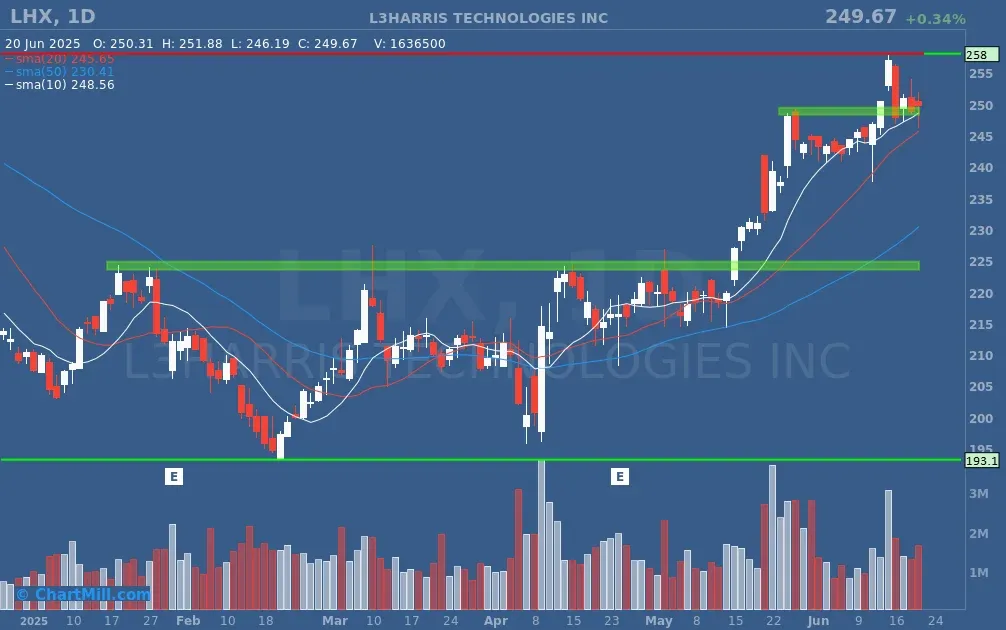
L3Harris (LHX): Strong move above multi-month resistance. Currently consolidating just above $250, showing a doji candle at the SMA(10) level, a clear pullback setup.
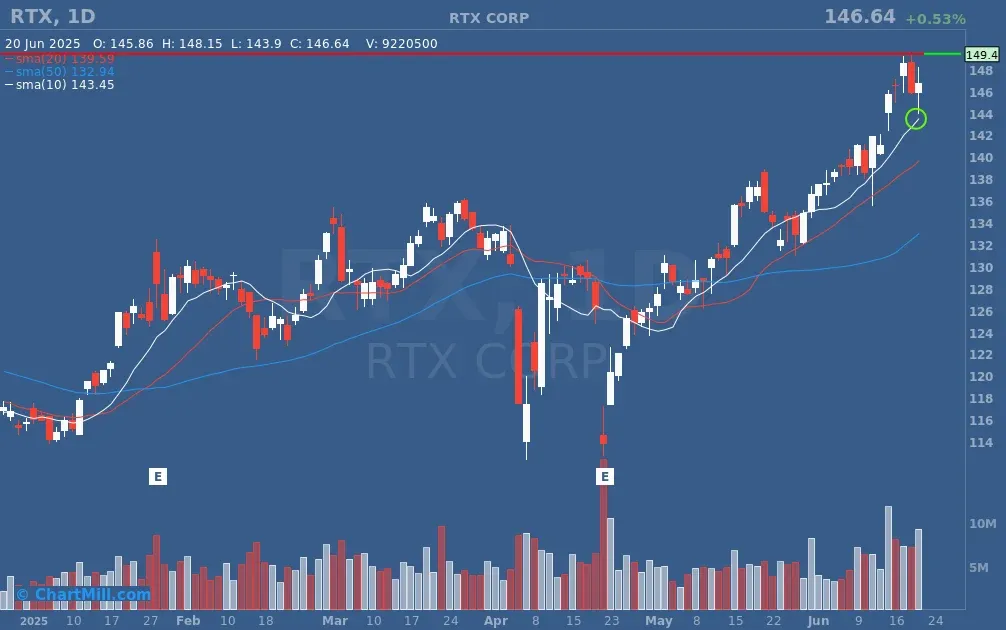
RTX Corp (RTX): Recently hit new highs, just tested the rising SMA(10). Holding above $143.50 keeps the setup intact.
How to Trade This Volatility
This kind of situation can be emotionally charged and fast-moving. Here's how swing traders and short-term investors can navigate it:
-
Focus on Sector Strength Use tools like relative strength rankings and sector-based screeners to zero in on the strongest stocks.
-
Look for High-Probability Patterns Breakouts from bases, bull flags, and tight consolidations near key support/resistance levels tend to offer the best reward-to-risk setups.
-
Manage Risk Aggressively Volatility cuts both ways. Use tight stop-losses, manage position size, and be ready to take profits quicker than usual in uncertain environments.
-
Follow News Closely Geopolitical headlines can shift market sentiment rapidly. Be aware of new developments, they can turn a winning trade into a loser, or vice versa, in hours. Stay on top of the headlines with our daily Market Monitor updates (News, Trends & Market Breadth).
Markets hate uncertainty, but prepared traders love volatility and this conflict is delivering both. While it's impossible to predict exactly how things will unfold between the U.S. and Iran, the historical playbook and the current technical setups give traders a clear roadmap.
Stay nimble, trade the setups (not the headlines) and remember: Risk comes first, profit comes second.
The ChartMill Team