

(All data & visualisations by ChartMill.com)
Daily Market Trend Analysis – October 7, 2025 (After Market Close)
'Off' day for the US indices
Short Term Trend
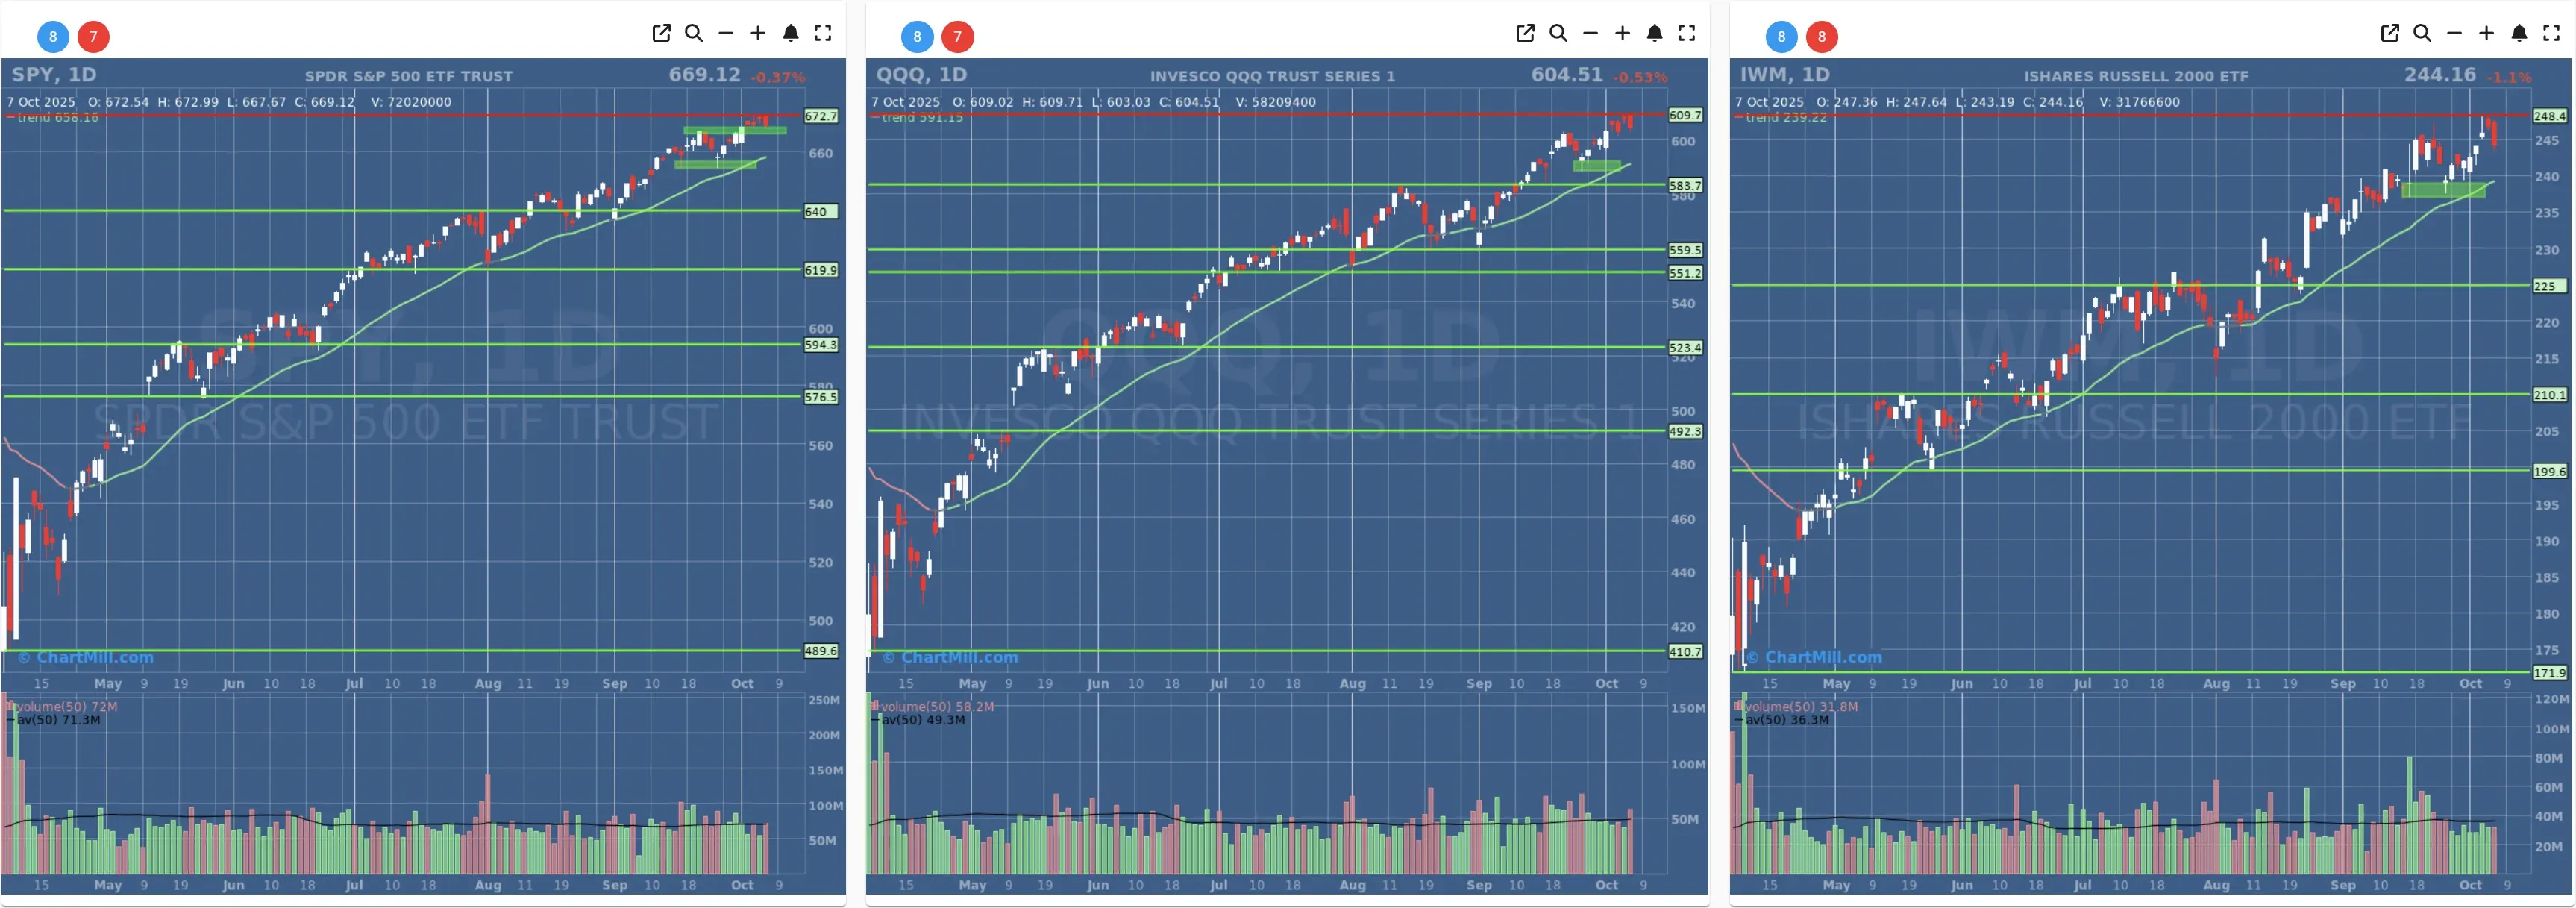
- Short-Term Trend: Positive (no change)
- Next Support at $666 - $660
- Next Resistance at /
- Volume: At Average (50)
- Pattern: Down Day - New Intraday High - Bearish Engulfing Pattern
- Short-Term Trend: Positive (no change)
- Next Support at $600
- Next Resistance at /
- Volume: Slightly Above than Average (50)
- Pattern: Down Day - New Intraday High - Bearish Engulfing Pattern
- Short-Term Trend: Positive (no change)
- Next Support at $235
- Next Resistance at $247
- Volume: Slightly Lower than Average (50)
- Pattern: Down Day - Weak Candle
Long Term Trend
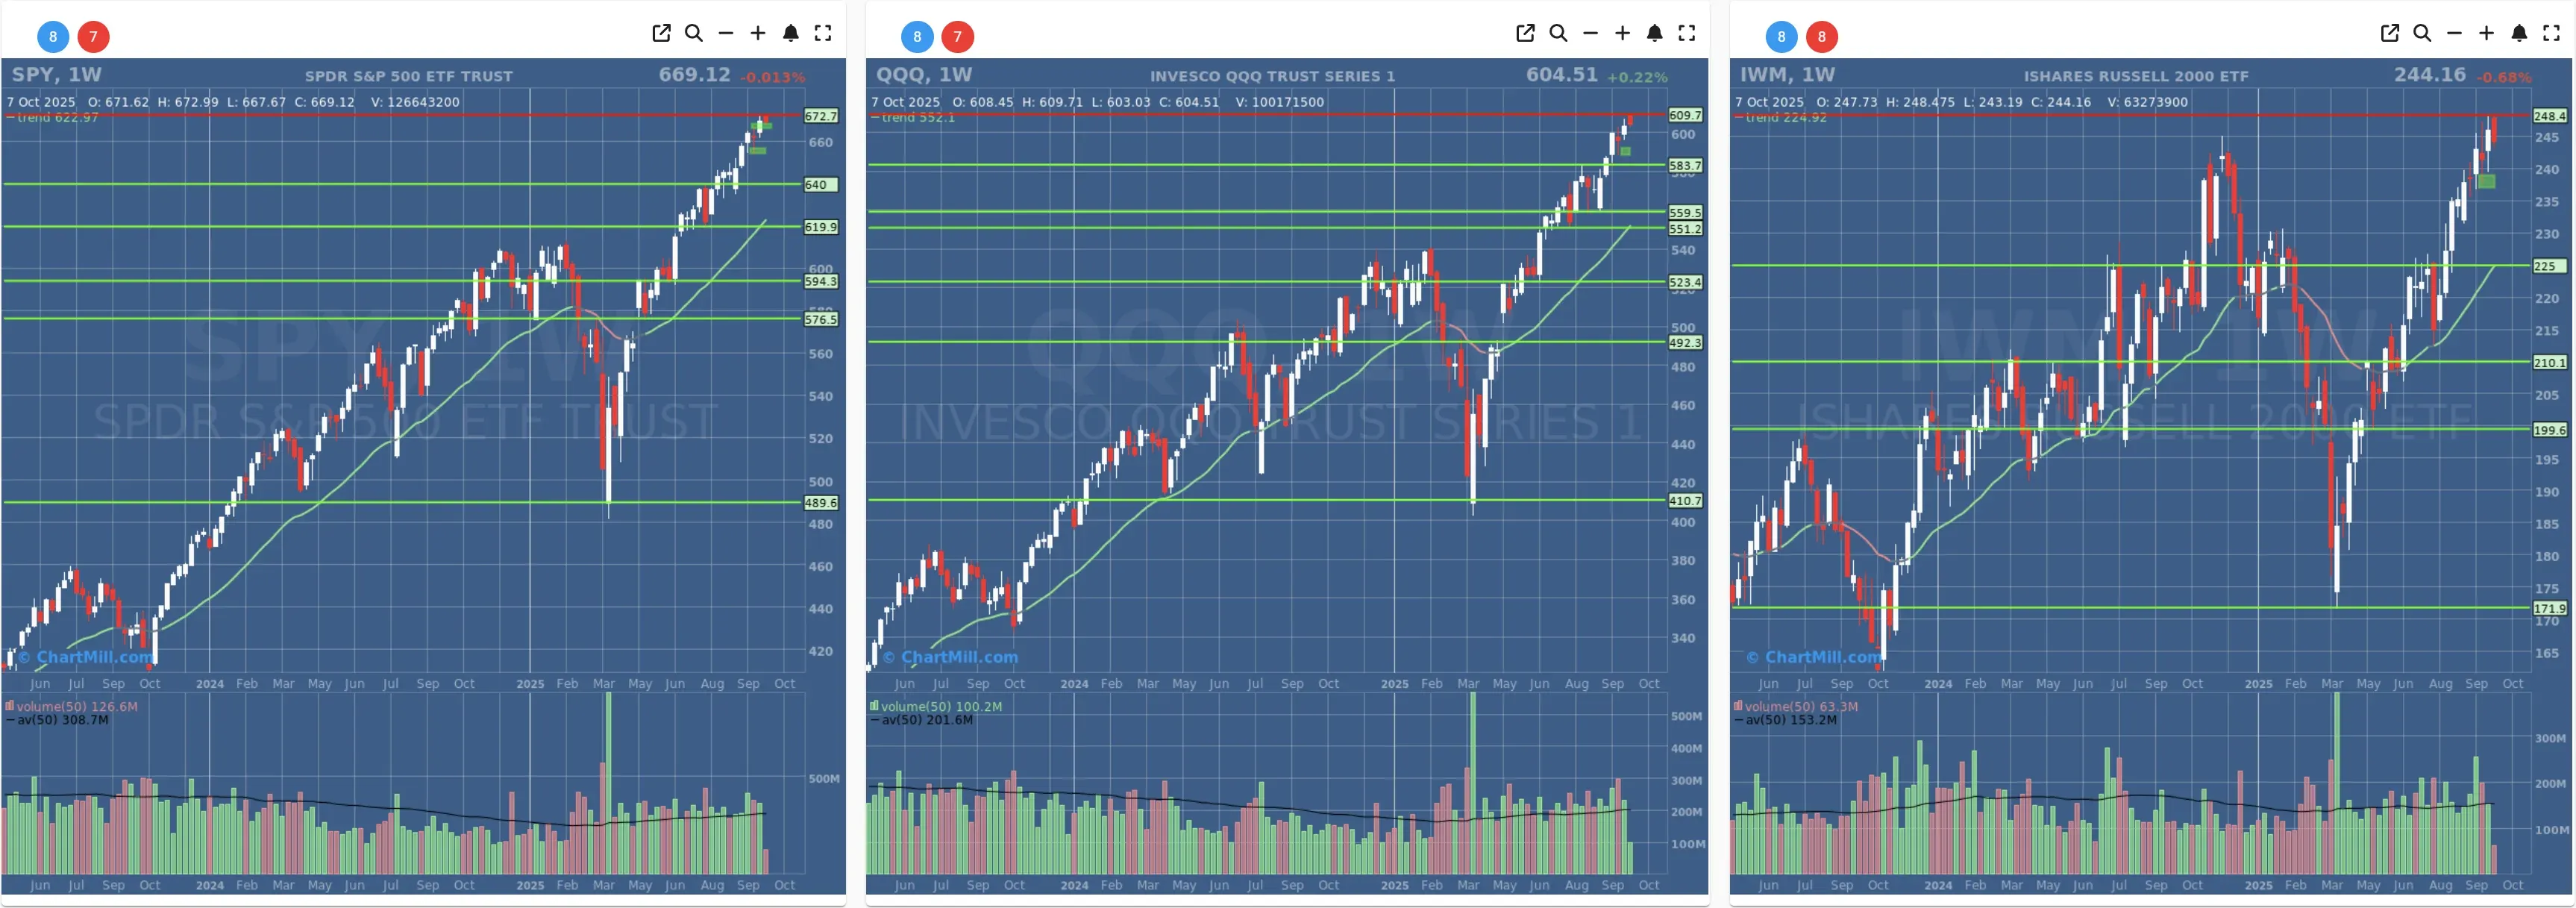
- Long-Term Trend: Positive (no change)
- Long-Term Trend: Positive (no change)
- Long-Term Trend: Positive (from neutral)t Close)
After a relatively stable start to October, Tuesday's breadth data shows a decisive shift to the downside. Decliners overwhelmed advancers, with significant weakness across multiple breadth indicators. This marks a notable change in tone and resets short-term breadth momentum.
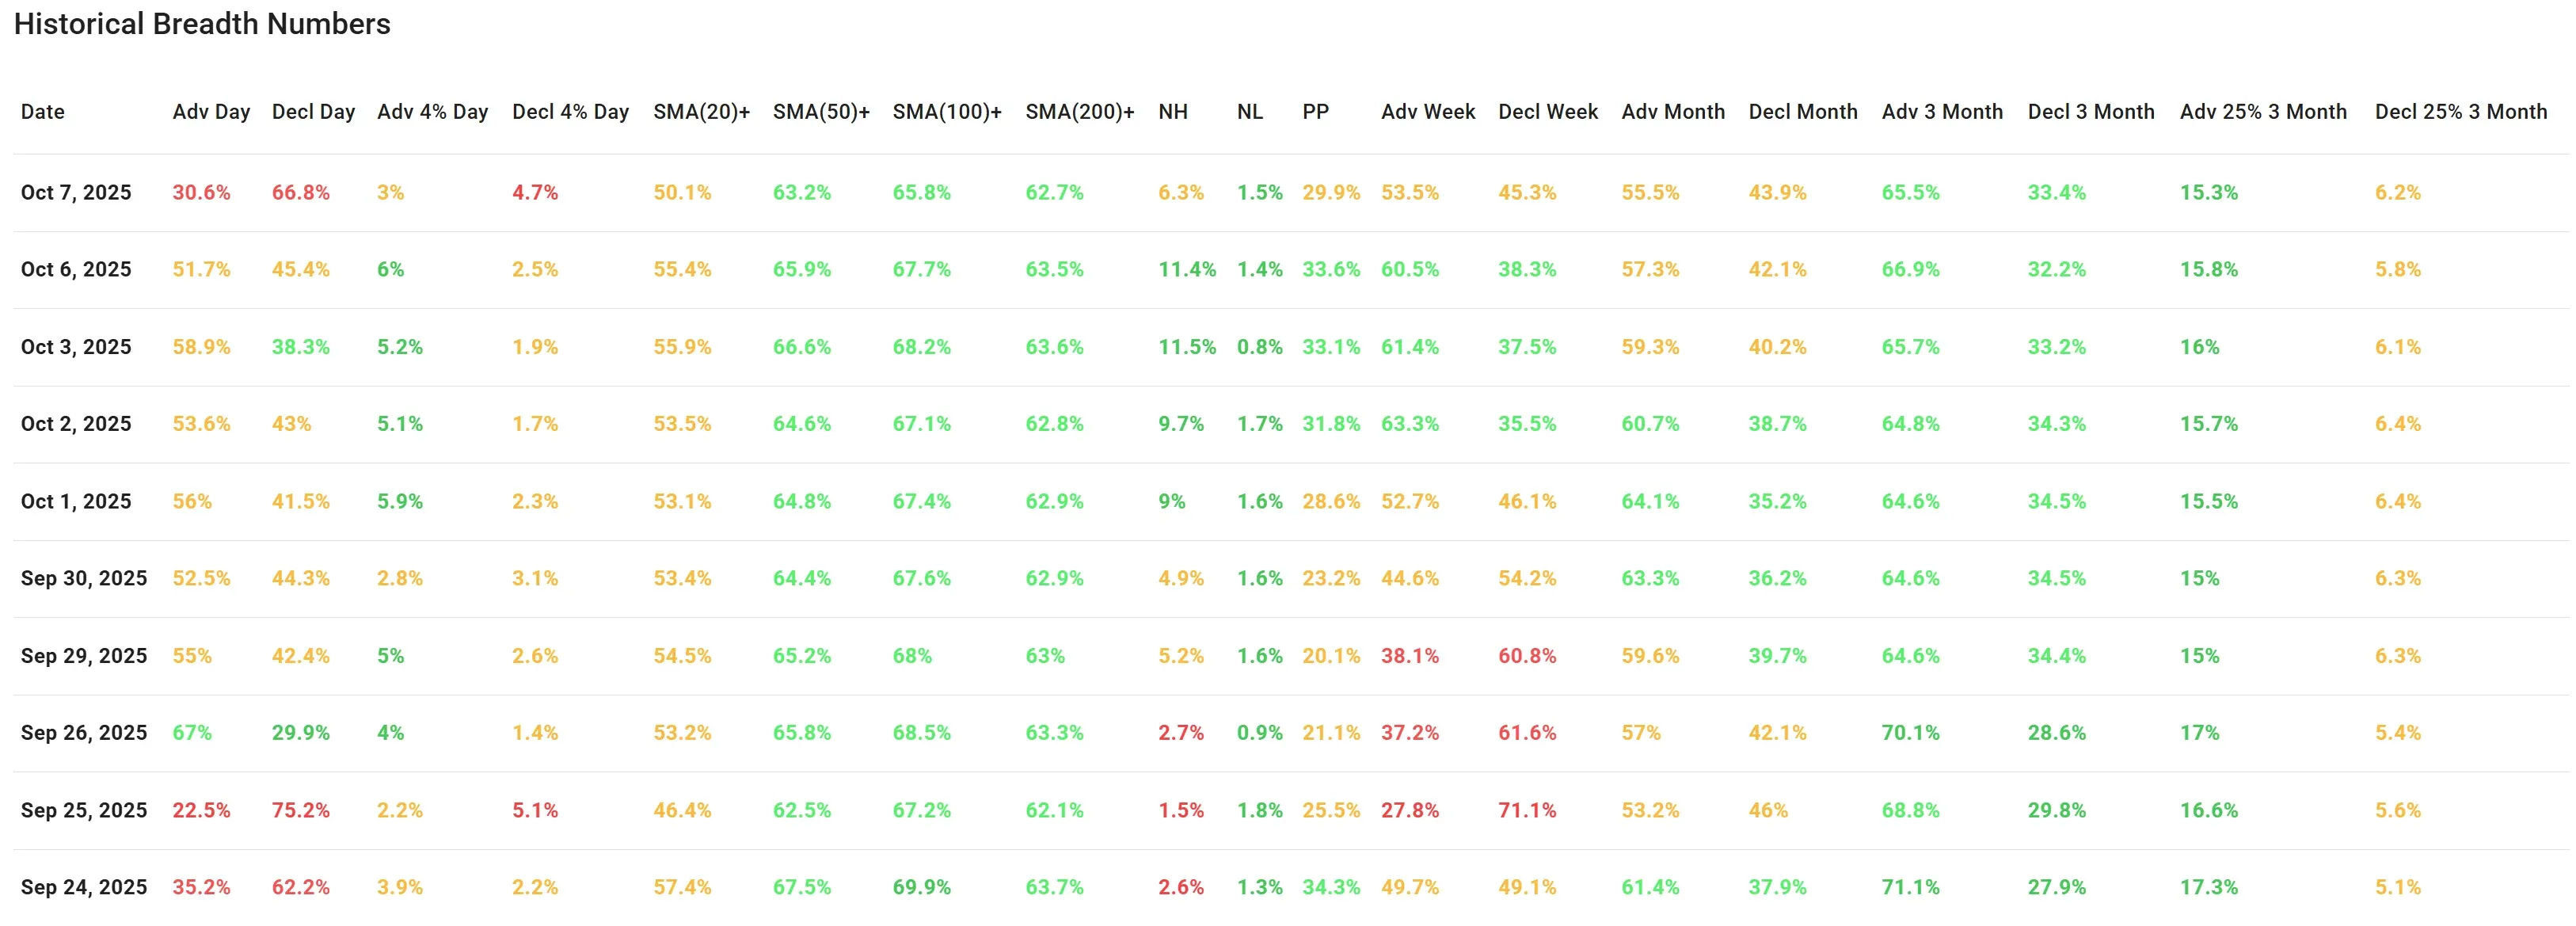
Tuesday’s market session delivered a sharp reversal in breadth, signaling renewed selling pressure across U.S. equities.
The most notable shift occurred in the Advance/Decline (A/D) ratios: only 30.6% of stocks advanced, while a striking 66.8% declined, the weakest daily A/D ratio since September 25th. The percentage of stocks advancing more than 4% dropped to just 3%, while decliners with 4%+ losses surged to 4.7%, the highest reading in nearly two weeks.
This significant deterioration follows a relatively balanced session on Monday (Oct 6), when advancers (51.7%) slightly outnumbered decliners (45.4%), suggesting that breadth had been neutral with a positive tilt.
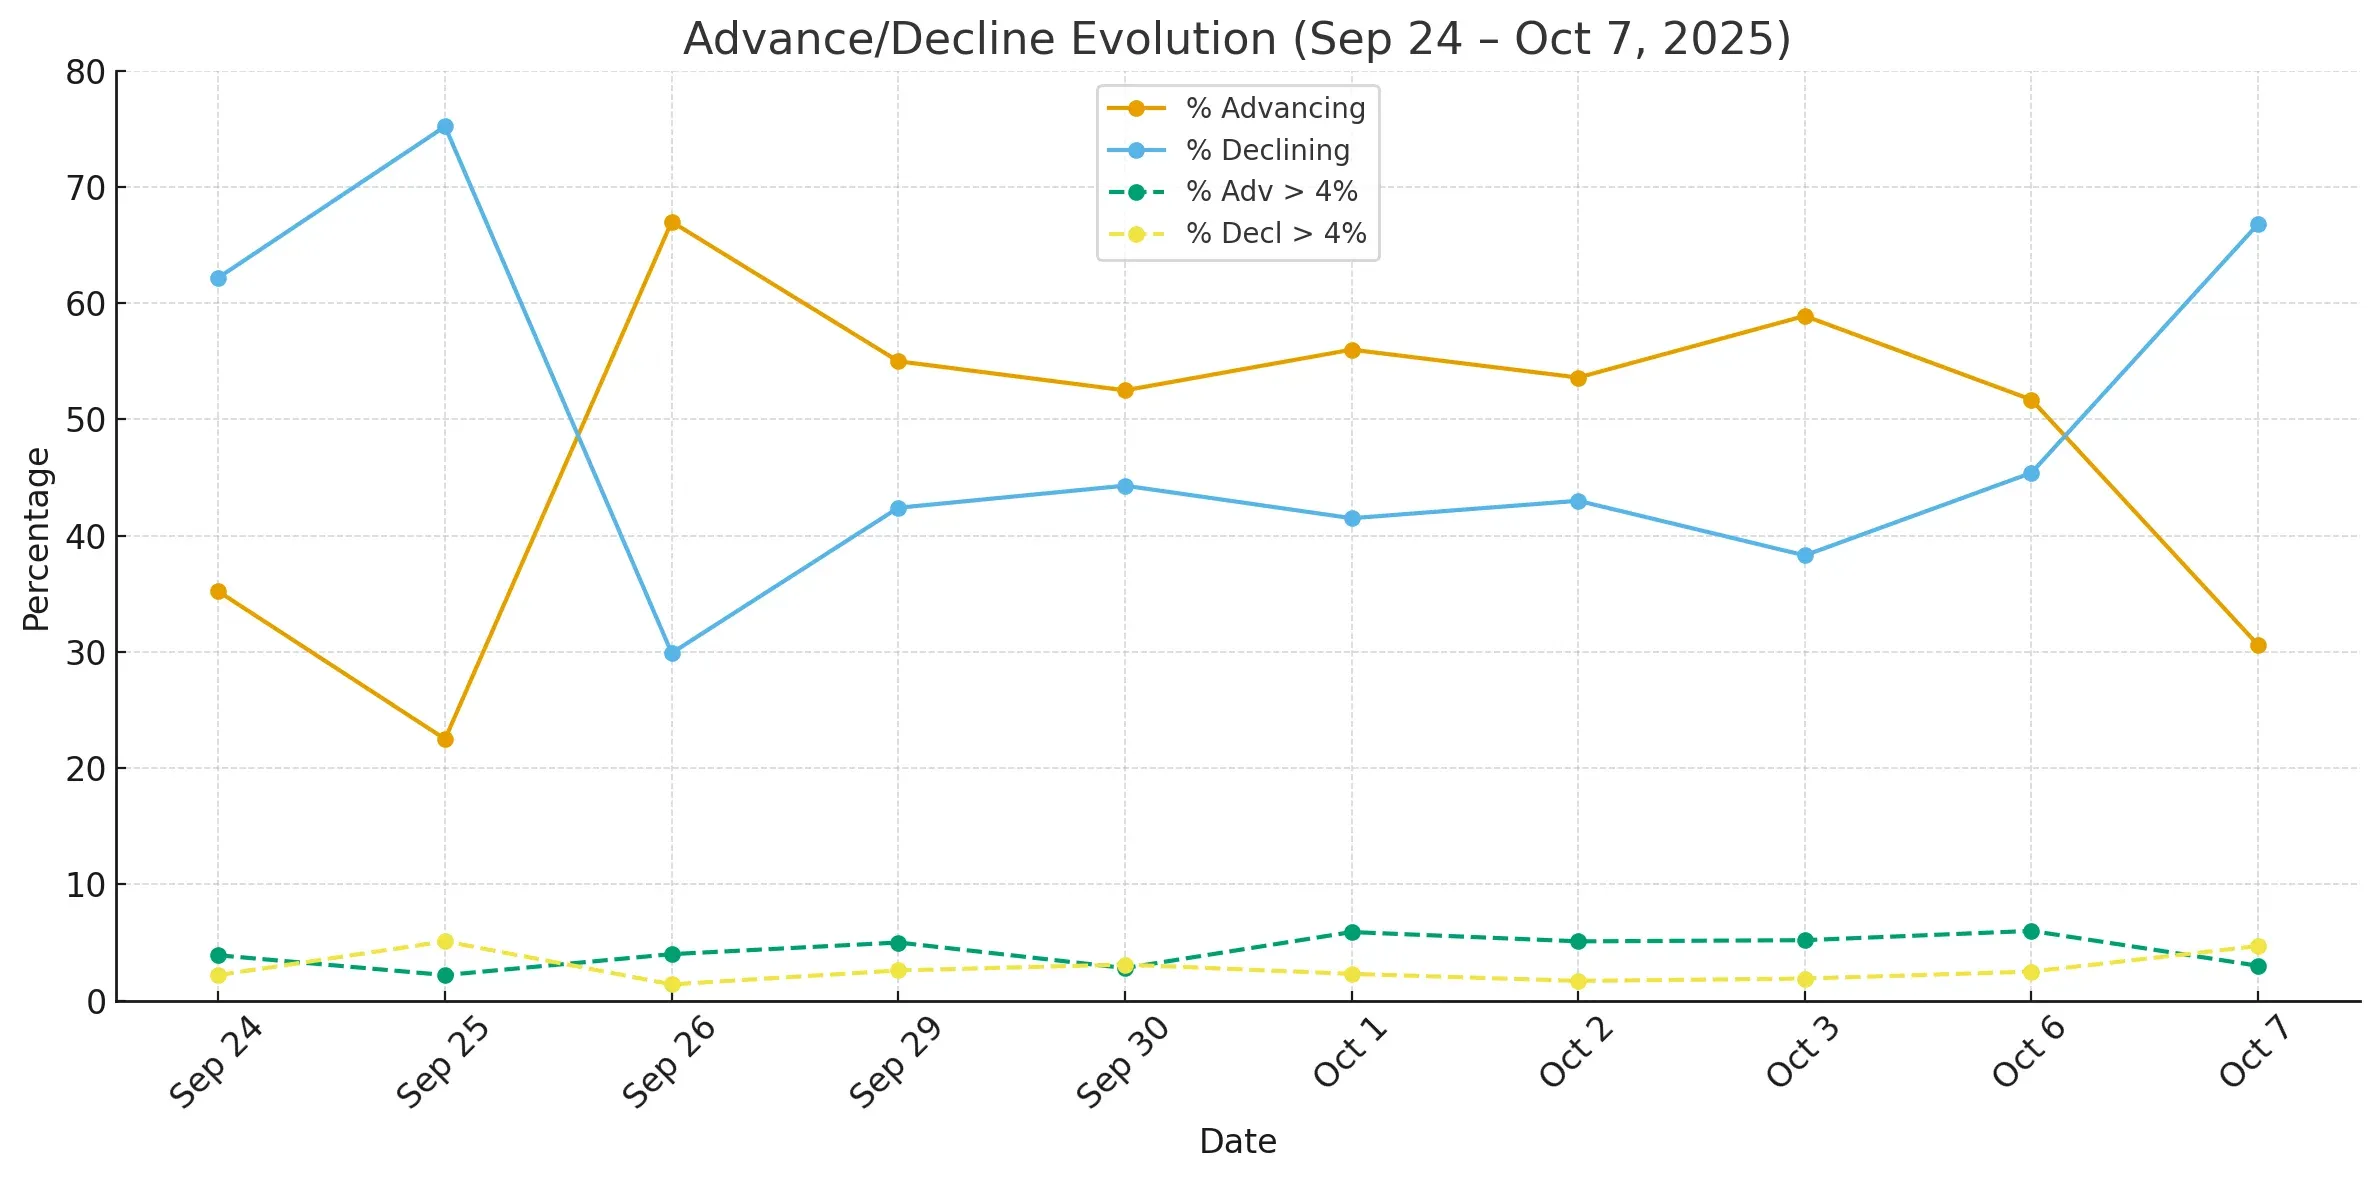
The stark contrast on Tuesday indicates that bullish participation weakened quickly, giving way to broad-based selling.
Technical Participation Weakens
The percentage of stocks trading above their short-term moving averages dropped across the board:
-
SMA(20)+ declined to 50.1% (from 55.4%)
-
SMA(50)+ fell to 63.2% (from 65.9%)
-
SMA(100)+ slipped to 65.8% (from 67.7%)
-
SMA(200)+ ticked down to 62.7% (from 63.5%)
These declines reflect an erosion in trend participation and are particularly notable given the already shallow recovery seen last week.
New Highs vs New Lows
The number of New Highs (NH) declined sharply from 11.4% to 6.3%, while New Lows (NL) remained steady at 1.5%. While new lows did not expand meaningfully, the drop in new highs signals diminished upside momentum.
The Percent of Stocks showing a Pocket Pivot (PP) also fell to 29.9%, its lowest level since late September.
Broader Timeframes: Weakness Filters In
Looking at broader breadth metrics:
-
Weekly Advancers dropped from 60.5% to 53.5%
-
Weekly Decliners rose from 38.3% to 45.3%
-
Monthly Advancers declined to 55.5%
-
3-Month Advancers dipped to 65.5% (from 66.9%)
Even though these longer-term readings remain above the halfway mark, the trend is shifting from strength to softness. If weakness continues for another few sessions, these metrics may turn more definitively bearish.
Strongest and Weakest Groups
-
Advancers > 25% in 3 months remained relatively stable at 15.3%
-
Decliners > 25% in 3 months rose modestly from 5.8% to 6.2%
Though not dramatic, this move suggests a slow build in medium-term underperformance.
Conclusion
The deterioration in virtually all breadth categories suggests that buyers have stepped aside and selling has broadened. While long-term moving average participation remains elevated, short- and medium-term metrics now reflect a clear loss of momentum.
If this negative action continues through the week, broader damage to longer-term participation metrics is likely. Market breadth has moved from a cautiously constructive stance to one where weakness is taking the upper hand again.
Breadth Trend Rating: Negative
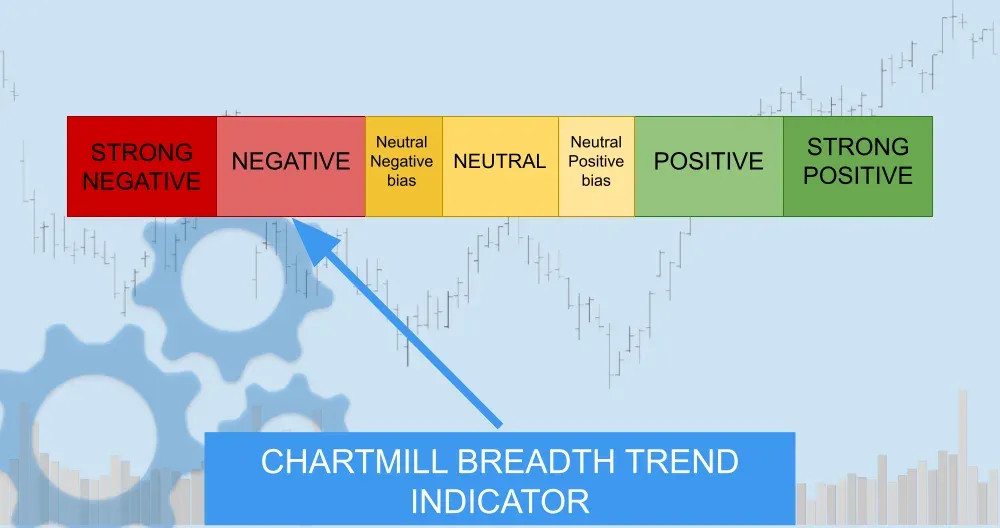
The sudden and widespread decline in participation, combined with weaker technical and sentiment metrics, warrants a downgrade from the previously neutral-positive stance to a clearly negative breadth trend. There’s no imminent capitulation yet, but recent progress has been swiftly undone.
Kristoff - ChartMill
Next to read: Wall Street Cools Off as AI Rally Pauses — Dell Surprises, Oracle Slips, and Trilogy Metals Explodes