

(All data & visualisations by ChartMill.com)
Daily Market Trend Analysis – October 2, 2025 (After Market Close)
Minor gains.
Short Term Trend
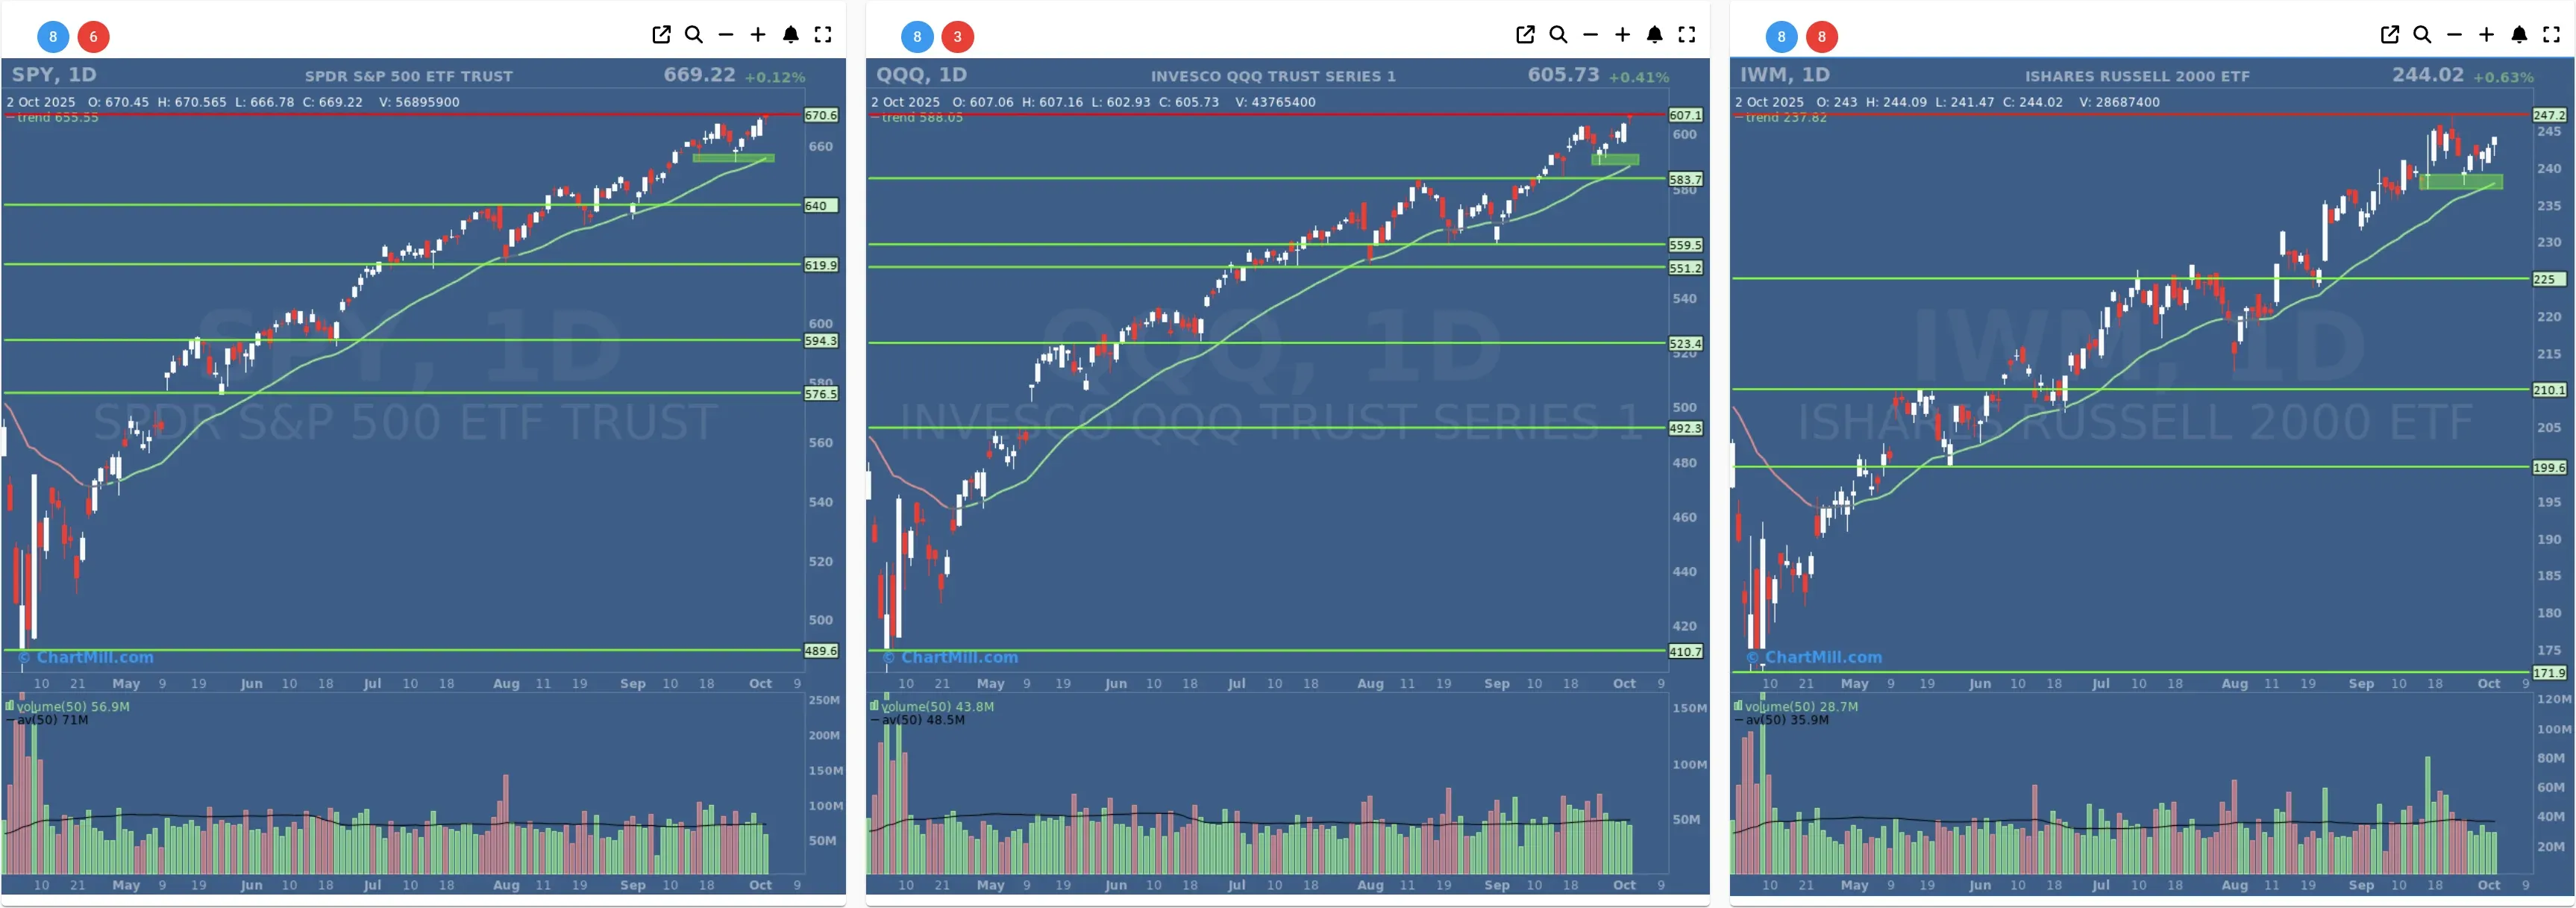
- Short-Term Trend: Positive (no change)
- Next Support at $666 - $660
- Next Resistance at /
- Volume: Below Average (50)
- Pattern: Up Day - New All Time High - Hanging Man Candlestick Pattern
- Short-Term Trend: Positive (no change)
- Next Support at $600
- Next Resistance at /
- Volume: Slightly Below Average (50)
- Pattern: Up Day - Gap Up - New All Time High - Hanging Man Candlestick Pattern
- Short-Term Trend: Positive (no change)
- Next Support at $235
- Next Resistance at $247
- Volume: Below Average (50)
- Pattern: Up Day
Long Term Trend
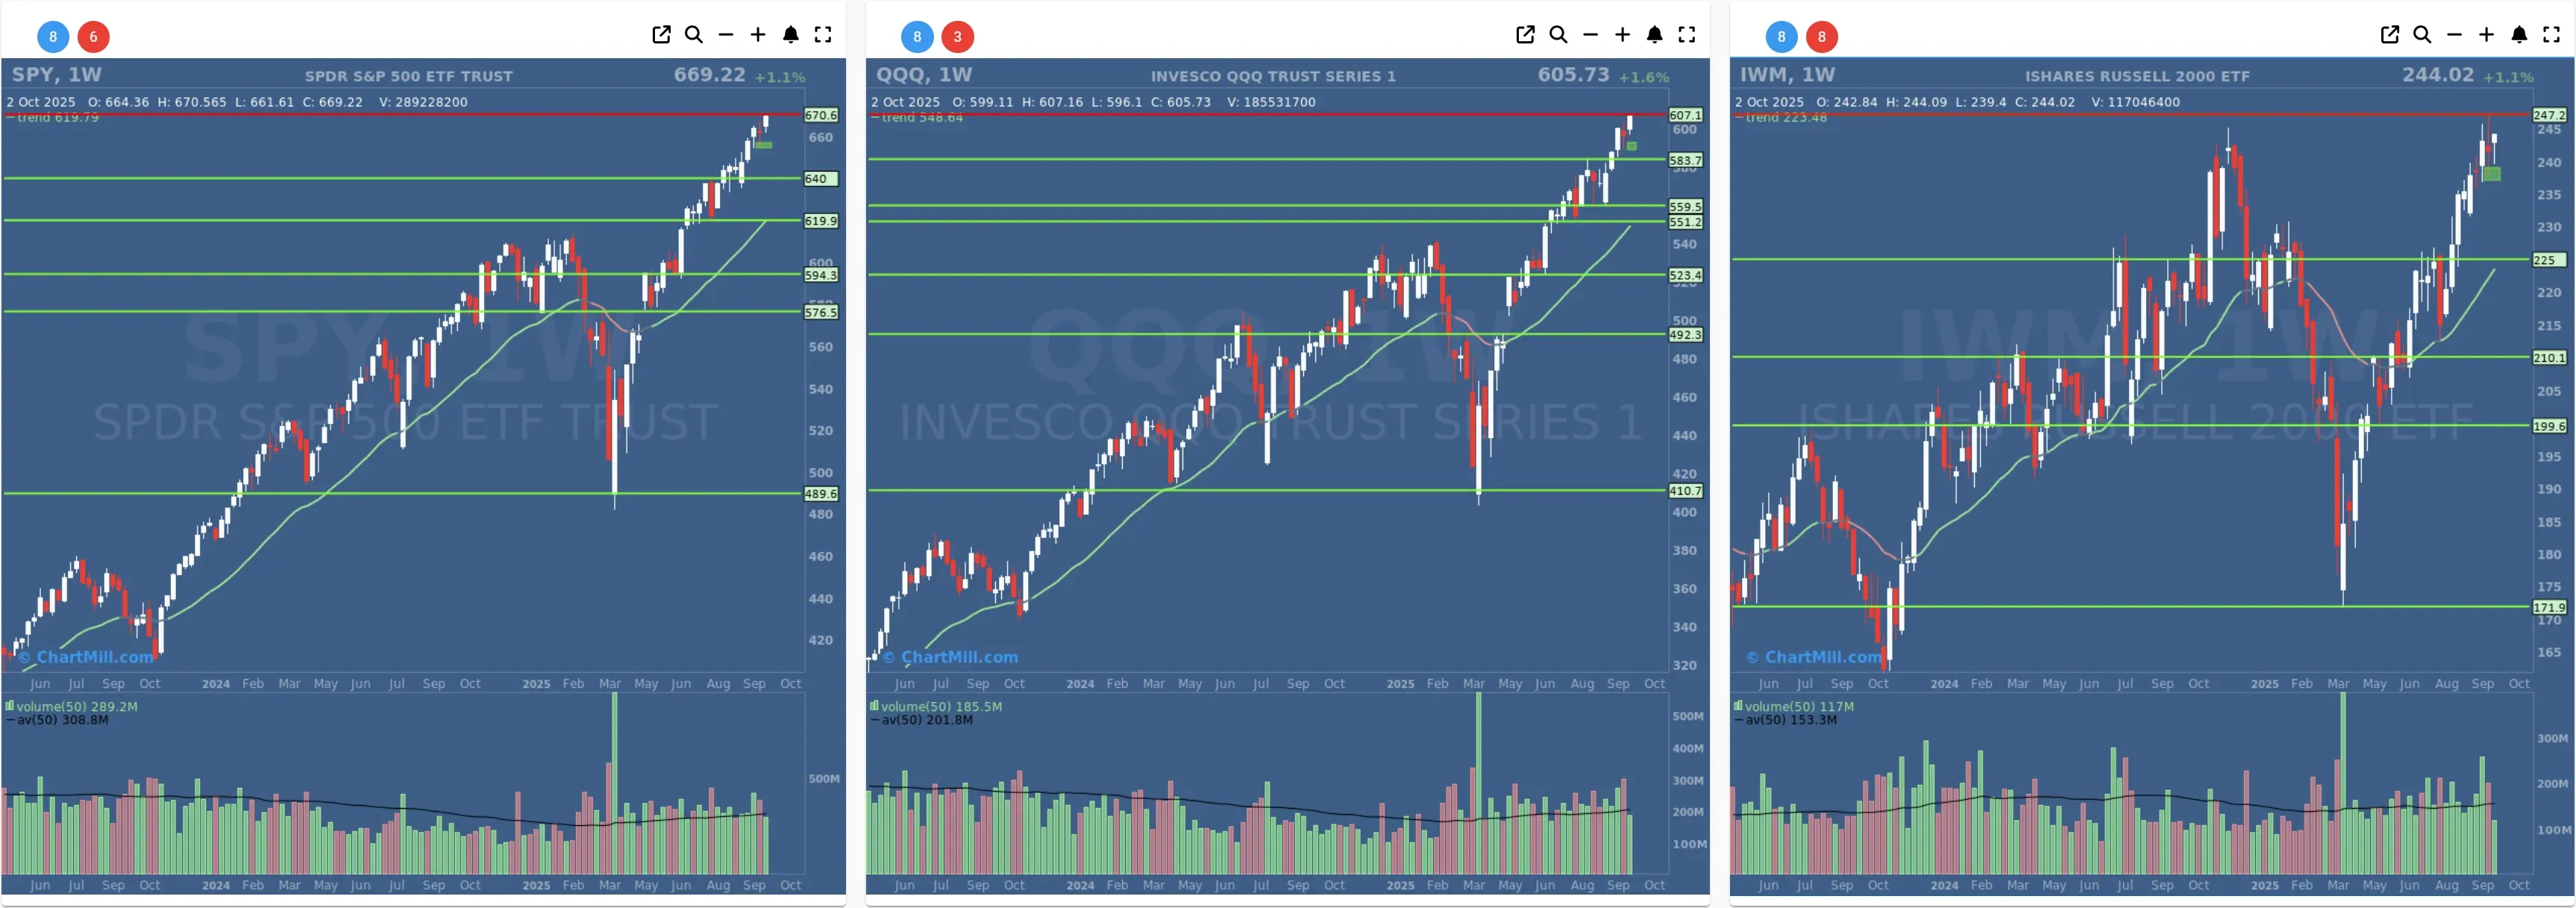
- Long-Term Trend: Positive (no change)
- Long-Term Trend: Positive (no change)
- Long-Term Trend: Positive (from neutral)
Daily Market Breadth Analysis – October 2, 2025 (After Market Close)
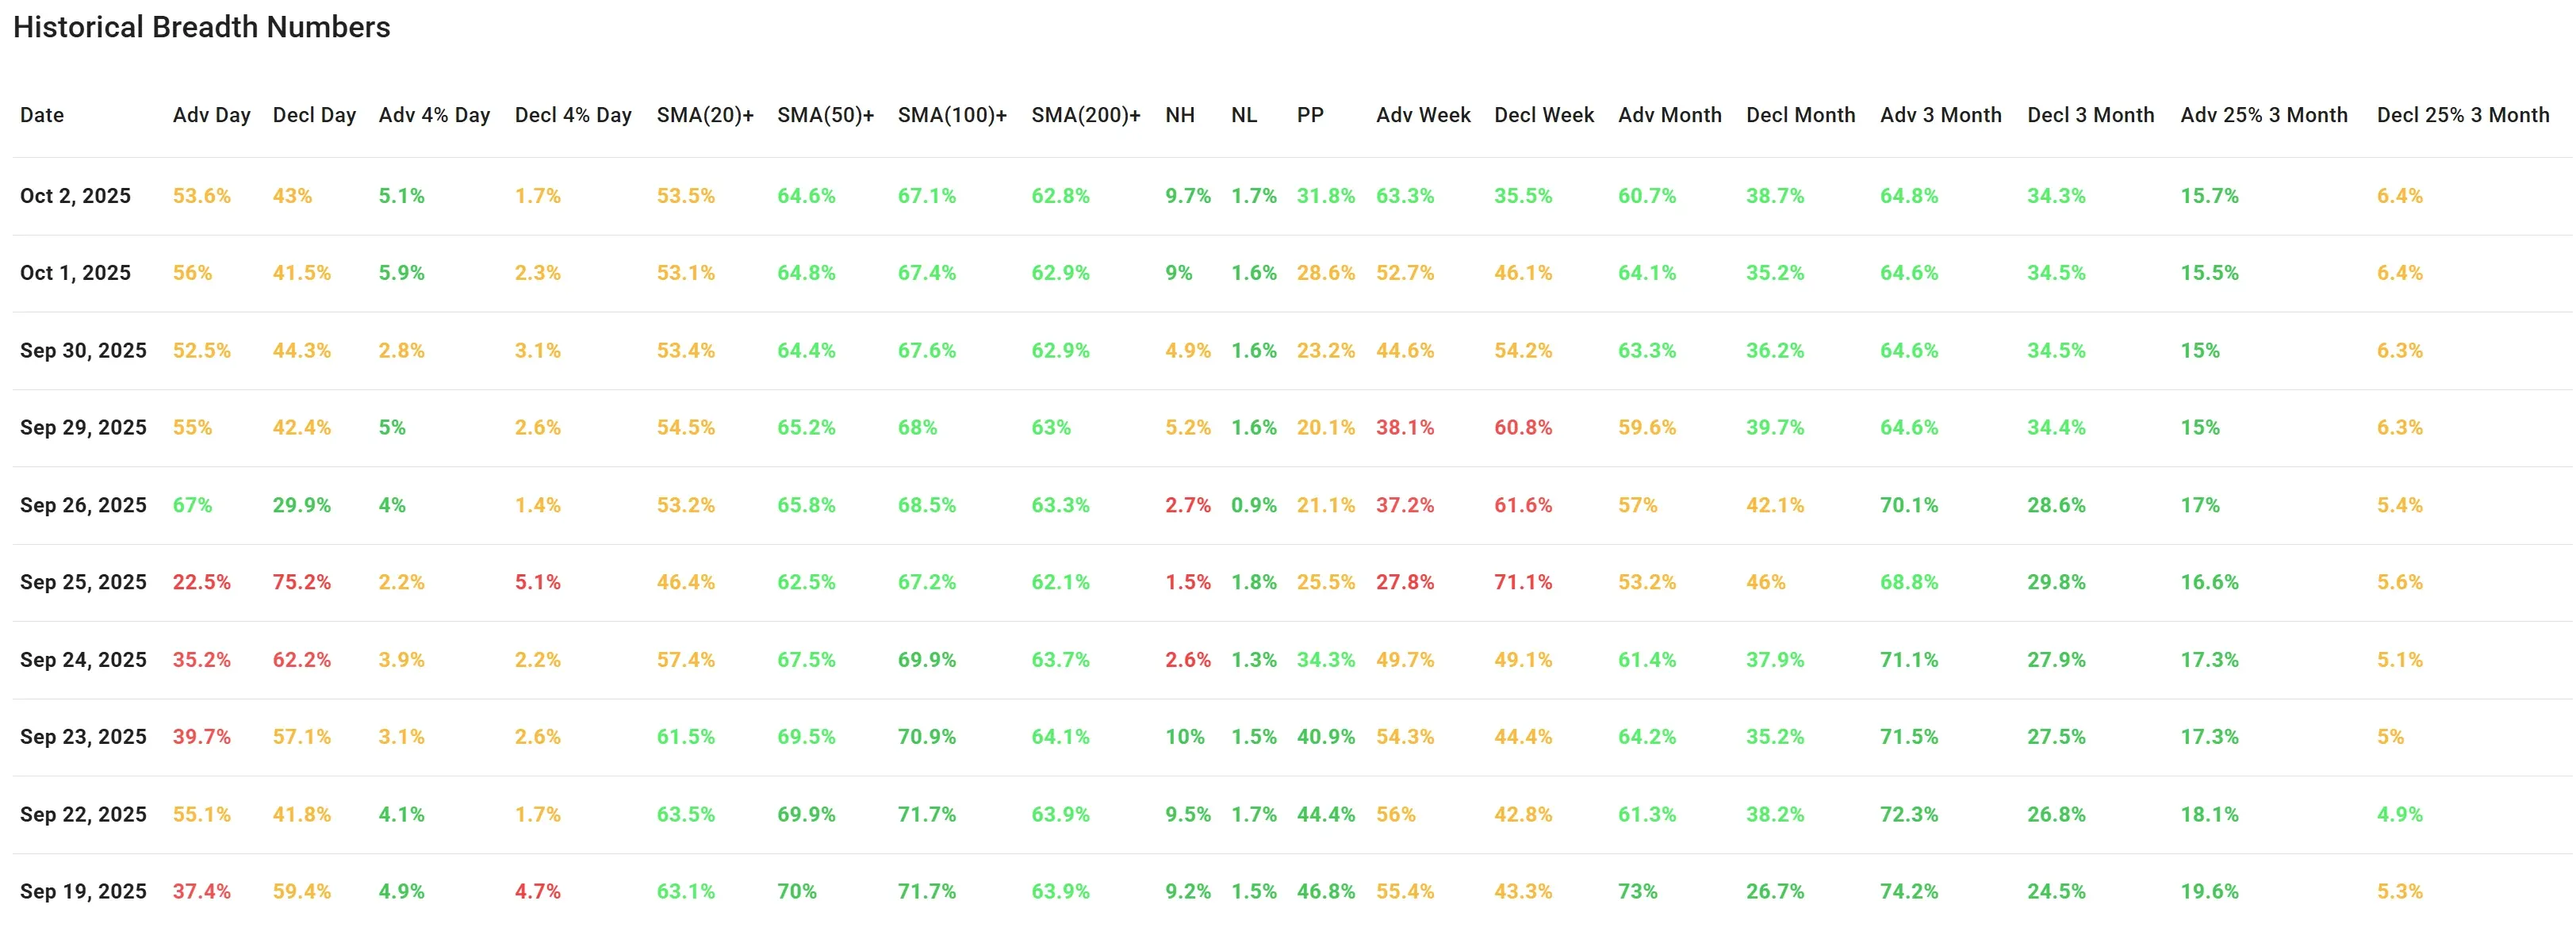
After the close of trading on Thursday, October 2nd, the latest market breadth data reveals mild but measurable improvement, continuing the stabilization pattern noted in recent sessions.
Advancers vs Decliners
-
Advancing stocks accounted for 53.6%, slightly lower than the 56% from Wednesday but still above the 50% threshold.
-
Declining stocks fell to 43%, from 41.5% the day prior.
-
Advancers > 4%: 5.1% (versus 5.9%)
-
Decliners > 4%: 1.7% (versus 2.3%)
While these figures may seem like a minor pullback from Wednesday, the consistent majority of advancing stocks over the past four days reflects a modest shift in sentiment away from the extreme selling pressure seen on September 25th.
SMA Participation (Key Moving Averages)
Percentage of stocks trading above key moving averages remains remarkably stable and supportive:
-
SMA(20): 53.5% (up slightly from 53.1%)
-
SMA(50): 64.6%
-
SMA(100): 67.1%
-
SMA(200): 62.8%
These numbers indicate that the underlying trend is not deteriorating and that many stocks are maintaining technical support levels, especially medium- and long-term.
Highs vs Lows & Price Performance
-
New Highs (NH) jumped to 9.7%, almost doubling the figure from September 30 (4.9%) and rising from 9% on October 1. This is the strongest NH reading since September 23.
-
New Lows (NL) remain muted at 1.7%.
PP (Pocket Pivots): 31.8% of stocks are showing a Pocket Pivot, a noticeable improvement from 23.2% just two days ago.
Weekly and Monthly Trends
-
Weekly Advancers climbed further to 63.3%, up from 52.7% on October 1 and 44.6% on September 30.
-
Weekly Decliners dropped to 35.5%, down significantly from 54.2% earlier in the week.
Monthly Breadth remains mixed:
-
Advancers Month: 60.7% (slightly down from 64.1% on Wednesday)
-
Decliners Month: 38.7% (up marginally from 35.2%)
So while the weekly trend is clearly improving, the monthly metrics suggest the market is still digesting the damage from the selloff that occurred in the second half of September.
3-Month Breadth Perspective
-
Advancers 3 Month: 64.8% (unchanged)
-
Decliners 3 Month: 34.3% (stable)
-
Advancers +25% in 3 Months: 15.7%
-
Decliners -25% in 3 Months: 6.4%
These longer-term metrics reflect an environment that still contains winners, but not yet one in which bullish momentum is dominant across the board.
Conclusion:
The market breadth picture continues to recover gradually from the extreme weakness seen around September 25. Participation above key moving averages is firm, and the number of new highs has improved notably.
There is however a lack of strong upside momentum in the 4%+ advancers and only modest shifts in monthly breadth prevent a stronger bullish interpretation.
The situation is improving, but caution remains warranted. A breakout in broader participation - particularly in the percentage of stocks making significant gains (>4%) - would be needed to raise conviction in the current recovery trend.
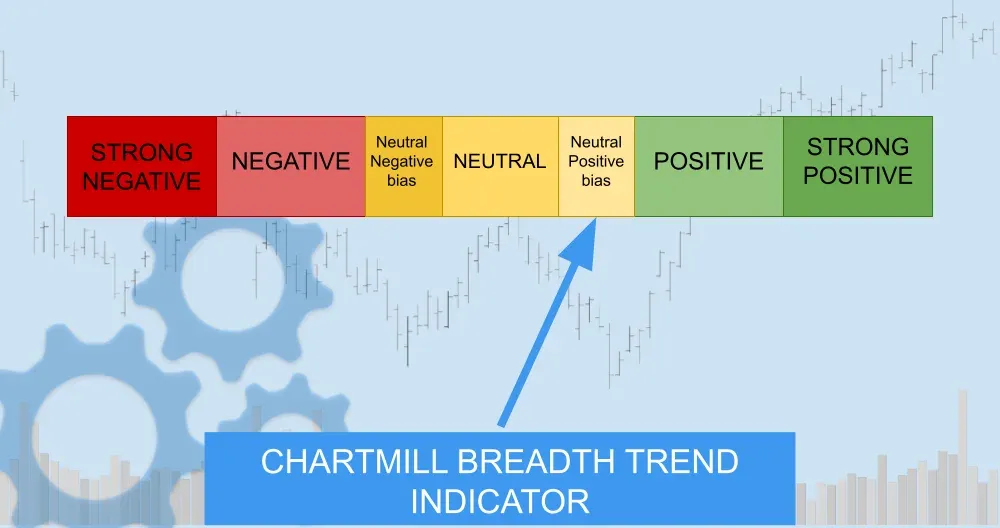
Breadth Trend Rating: Neutral with a Positive Bias
This rating reflects the slowly improving but still hesitant nature of the current market internals.
Kristoff - ChartMill
Next to read: Tesla Sinks Despite Record Deliveries, Crypto and AI Steal the Show