
Bull Flag Chart Pattern Explained

What Is a Bull Flag?
The Bull Flag pattern within the field of technical analysis. It occurs within an uptrend and is characterized by a consolidation phase, represented by a small rectangular shape or a slight downward slope, followed by a breakout to the upside, resuming the upward trend.
It resembles a flag pole, hence its name.
The bull flag chart pattern is formed when there is a sharp price increase, known as the flagpole, followed by a period of consolidation or mild retracement, forming the flag portion. This consolidation typically occurs as traders take a pause and consolidate their positions before the uptrend continues.
Properties
Flags have multiple specific properties:
The Pole Size
This is the height of the flag. It is the move in percent that happened before the flag formation started. It should be a sharp and significant upward price movement that precedes the price consolidation phase.
The Flag Width
This measures the tightness of the flag and is the difference in percent between the highest and lowest point in the flag. It is known as the consolidation phase, usually represented by a rectangular shape or a slight downward slope, as prices move sideways or experience a mild retracement.
The Flag Length
This is the time in days of the flag formation. The duration of the flag pattern can vary. Some flags may form over a few days, while others may take weeks or even months. Traders typically monitor the price action within the flag to look for signs of a breakout or further consolidation.
The Time frame
This pattern can occur on various time frames, ranging from intraday to daily charts to longer-term charts (weekly timeframe).
Flag vs. Pennant: Differences
The key difference with a bull pennant lies in its shape and formation.
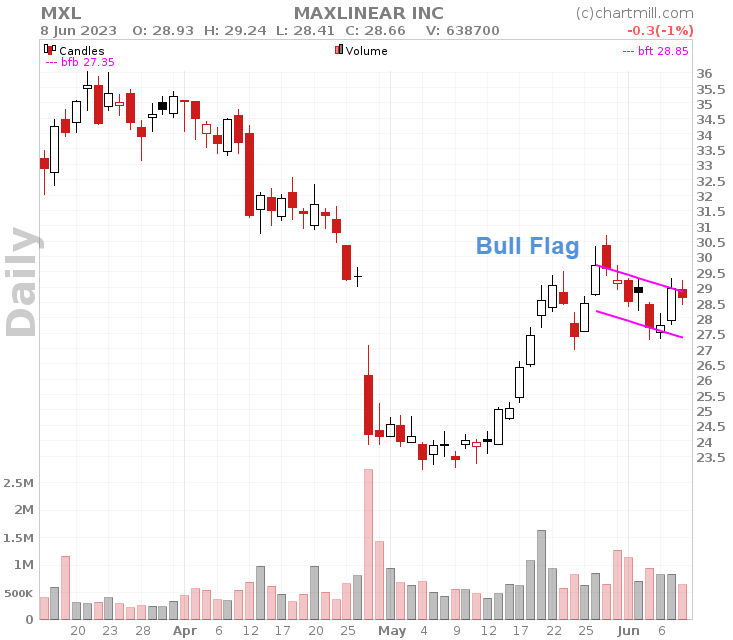
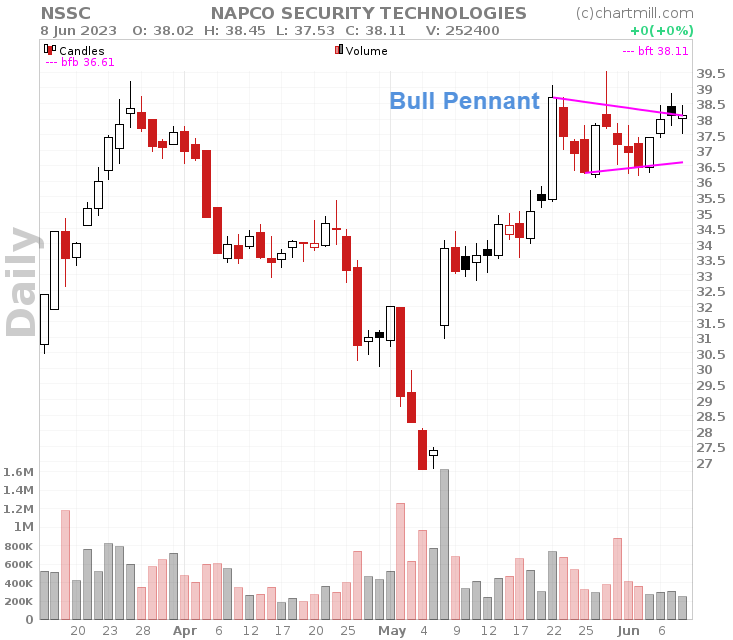
The bull flag pattern has a rectangular shape or a slight downward slope during the consolidation phase, while the bull pennant forms a triangular shape with converging trendlines.
Both patterns suggest a temporary pause in the upward movement, but the specific formation distinguishes them from each other.
Main Observations
-
It is a continuation pattern observed within an uptrend, characterized by a consolidation phase followed by a breakout point to the upside.
-
The flag represents a period of pause where price consolidates after a sharp price increase known as the flagpole.
-
To recognize this pattern, look for a strong price run-up, a consolidation phase with diminishing buying interest and mild profit-taking, and a subsequent breakout to the upside.
-
They can occur on various time frames, ranging from intraday charts to longer-term charts.
How to Recognize this Pattern?
It is a technical continuation pattern that can be observed in stocks with strong uptrends. The pattern takes shape when the stock retraces by going sideways (or by slowly declining) after an initial big rise in price.
The bullish flag pattern consists of three important parts:
Run Up
In the first stage, buyers aggressively step into the market, driving prices higher. These early buyers attract other buyers, creating a real buying frenzy (also called momentum).
Consolidation Phase
After a while price settles down. This is happening because there are fewer and fewer buyers willing to buy shares. (potential buyers begin to view the stock as too extended).
There are also sellers entering the market because they do not want to give up the profits they have made. When all of this happens, the stock will go into the consolidation phase.
It will remain in this phase until (new) buyers or sellers enter the market and disrupt once again this equilibrium.
The Breakout point
This is the final stage, a subsequent upward price movement breaking above the upper boundary of the flag, signaling the continuation of the uptrend.
How to spot these patterns?
Chartmill supports finding stocks that show a bull flag or technical bull pennant pattern. The pattern can also be drawn on a chart by adding the 'Chartmill Flag' overlay indicator.
Of course, not every pattern that rolls out of our scanners is a good one. Some things to consider:
-
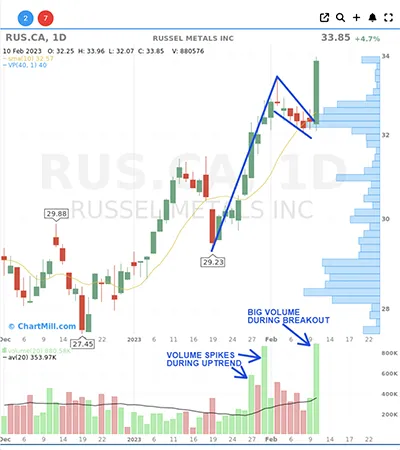
The run-up before the flag was a clear, fast, and huge move with big volume. By a clear move, we mean a price run-up that mainly closes near its high each day.
-
We want to spot clear conviction among the buyers. So don’t select stocks that are jumping around and are meeting resistance every five seconds!
-
The flag itself is orderly. We don’t want to see crazy price swings. Go for compact, linear patterns that go sideways (or slightly down) in a tight range.
-
We don’t want to see huge selling in the flag, just some mild profit-taking at best. Only select stocks that pull back orderly on low volume. This could mean that sellers aren't in a rush to hit the exit!
‘Tight' vs 'Loose' Bull Flag
A loose flag is a variation of the classic pattern, characterized by a relatively wider and less compressed consolidation phase. It occurs after a price rise (the pole) followed by a period of consolidation (the flag).
The flag section has a broader rectangular shape or a gentle downward slope. The consolidation period is characterized by a wider range of price movements and possibly more price volatility compared to other variations. The boundaries of the flag to where the price moves are less sharp and clear.
On the other hand, a tight flag is a specific type of pattern that exhibits an exceptionally narrow and tightly compressed consolidation phase within which the price is much more tightly trapped.
It occurs after a sharp and very steep (almost vertical) price rise after which the pattern forms. However, the consolidation range within a high tight flag is considerably tighter, indicating minimal price volatility and a high degree of compression.
Trading Strategy Bullish Flag
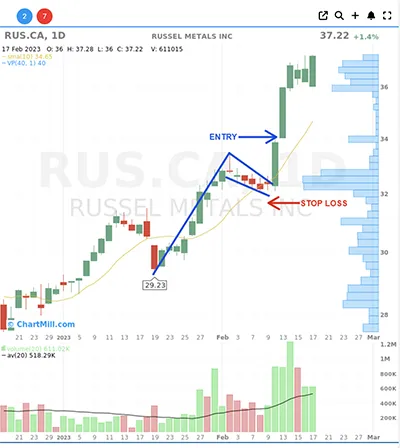
If you want to trade this pattern, keep in mind that it is considered a continuation pattern. So we will use this pattern to take a long position. To do this, two conditions must first be met.
- the price must rise above the descending trend line forming the flag pattern,
- the closing price must be higher than the top of the formation.
Important Points To Keep In Mind
- The breakout must be obvious, a long white candle with a closing higher than the highest price within the pattern up to that point.
- The volume associated with the breakout is noticeably higher compared to previous trading days.
- Buying occurs only when the breakout is definite. This is the only way to avoid false breakouts.
- By default, the initial stop-loss is set below the bottom of the flag.
This strategy can be used by both swing and day traders because it is largely based on positive momentum, being the breakout from the flag pattern and the volume associated with it.
More in-depth information on how to trade this pattern can be found in our article 'Bull Flag Trading: A practical guide to getting it right'
FAQ
What's The Difference Between a Bull Flag Chart Pattern vs Bear Flag?
A bull and a bear flag are each other's opposites. Each represents a different trend direction.
Whereas the bull flag pattern appears within an uptrend, the bear flag typically appears during a downtrend.
Therefore, the bearish flag pattern suggests a continuation of an existing bearish movement and is used to initiate a short position or even extend an already established short position.
Can the Pattern fail?
Yes, this pattern can fail, and traders need to be aware of this possibility.
While it is considered a reliable bullish continuation pattern, it is not foolproof and can experience false breakouts or other market dynamics that invalidate the pattern.
There are several reasons why the pattern may fail:
False Breakouts
Sometimes, the price may break out of the flag in the expected direction (upward), but the breakout turns out to be a false signal. Instead of continuing the bullish trend, the price reverses and moves in the opposite direction.
Lack of Volume
The absence of significant trading volume during the breakout can weaken the reliability of the pattern. A lack of volume suggests a lack of conviction from market participants, making the breakout less reliable.
Market News or Events
Unforeseen market news or events can disrupt the pattern and cause it to fail. Unexpected economic data, geopolitical events, or company-specific news can override the bullish sentiment and invalidate the pattern.
Change in Market Conditions
Market conditions can change rapidly, and what initially appears to be a bullish flag pattern may lose its significance due to a shift in market sentiment or the emergence of a new trend.
Related Articles
Bull Flag Trading: How To Do It?
ChartMill offers the ability to automatically scan for the presence of bull and bear flags. Read more...
High Tight Flag
The Bull Flag on steroids. Read more...