Finding Gap Up Stocks with the Stock Screener
Introduction
A gap is nothing more than a change in price levels between the close and open of two consecutive days. We distinguish two types of gaps. A full gap and a partial gap. There is a full gap when the opening price is higher than the highest price of the previous day. A Partial gap occurs when today's opening price is higher than yesterday's close, but not higher than yesterday's high.
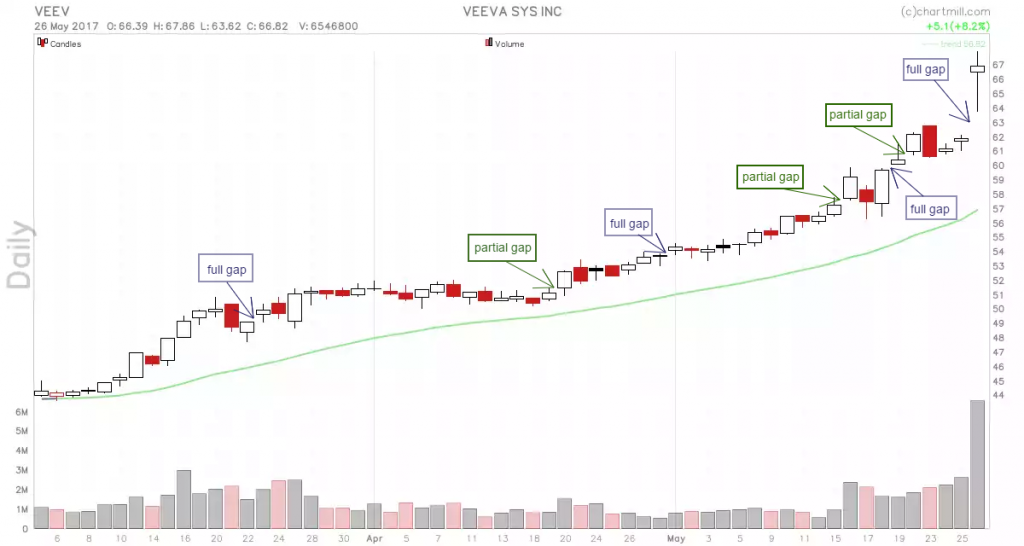
For the purpose of this article, only the full gap will be discussed. A 'full Gap Up' is a bullish gap (higher prices), a 'full Gap Down' is bearish (lower prices).
Gap Up Stock Screener
In our stock screener, you can easily use a filter to detect bullish or bearish gaps that occurred during the past trading day. To do this, select the "performance" tab in the stock screener and open the "Signals" filter where you can find the "gap down" or "gap up" filters. (You can choose between 2% or 4% Gaps).
In addition, it is also possible to find "gaps" in the past that will allow you to test your own (intraday) trading strategies wtith gaps. You can do this by using the additional "Historical Date" filter under the "General" tab.
For example, we can screen for stocks with the following parameters:
- Signal: Gap Up 4%
- Minimum price: 10
- Average volume: 500,000
Finding Gaps with custom expressions.
As explained above, our stock screener has some default gap filters available directly, but using custom expressions (which can be found on the 'Custom' tab) you can screen for any kind of Gap you want: full or partial, up or down, small or big. To create the filter, you can use the OHLC (Open/High/Low/Close) properties of today and of the previous day.
As a starting point and example: the formulae for screening for 2% gaps would be: Low(today) / High(previous) > 1.02
Gap Up and Gap Down stocks on the market overview pages.
There is a section Gap Up and Gap Down Stocks on the market overview pages. Here you can quickly see a list of gaps in the different regions and click through to the stock screener for the full list.
Some 'Gap Trading' Strategies
Responding to gaps can be done in several ways:
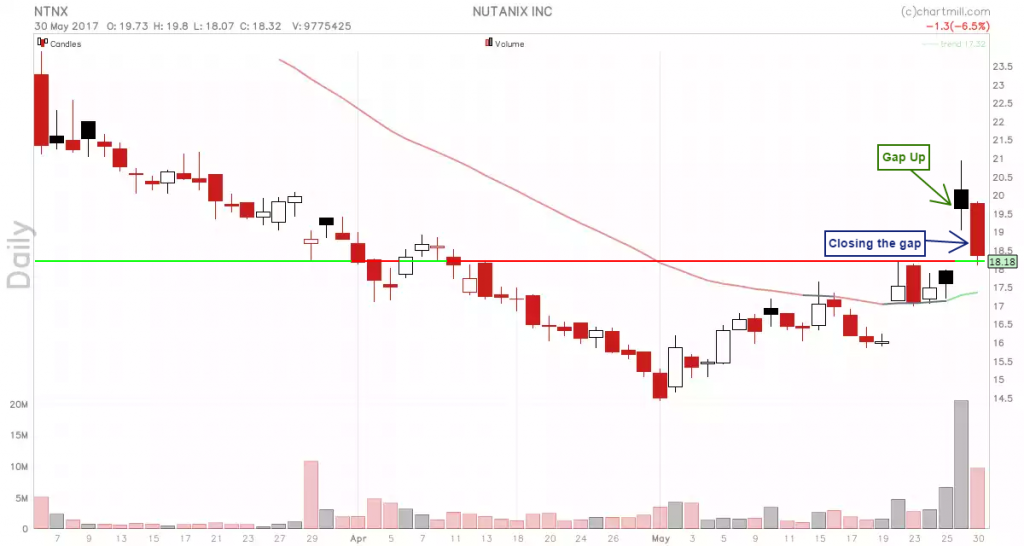
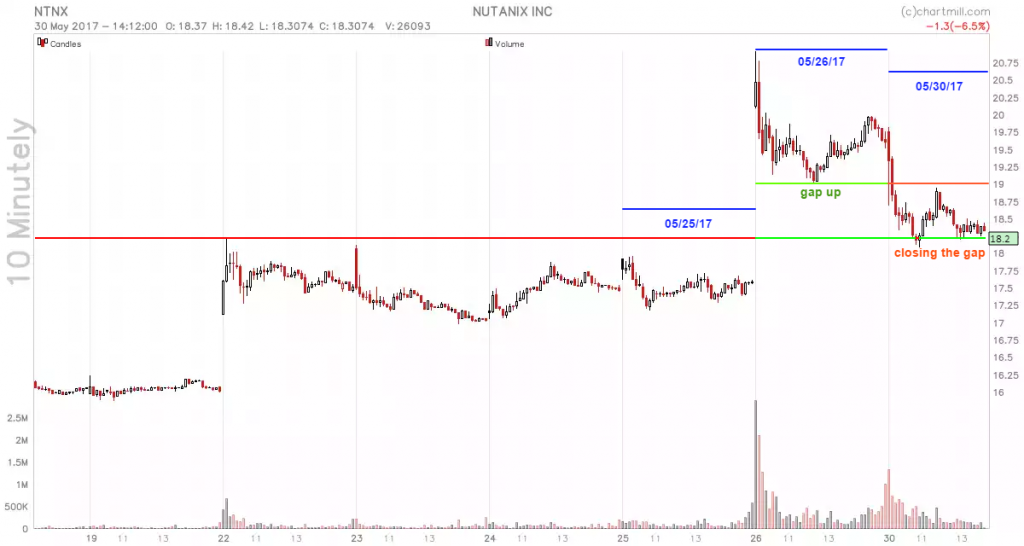
If you are a daytrader you can use a shortterm countertrend strategy by initiating a short position if there are indications on the intraday chart that the gap will be closed. In the chart below you could go short when price falls below the low of the gap up candle.
Same chart on a 10 minutes timeframe:
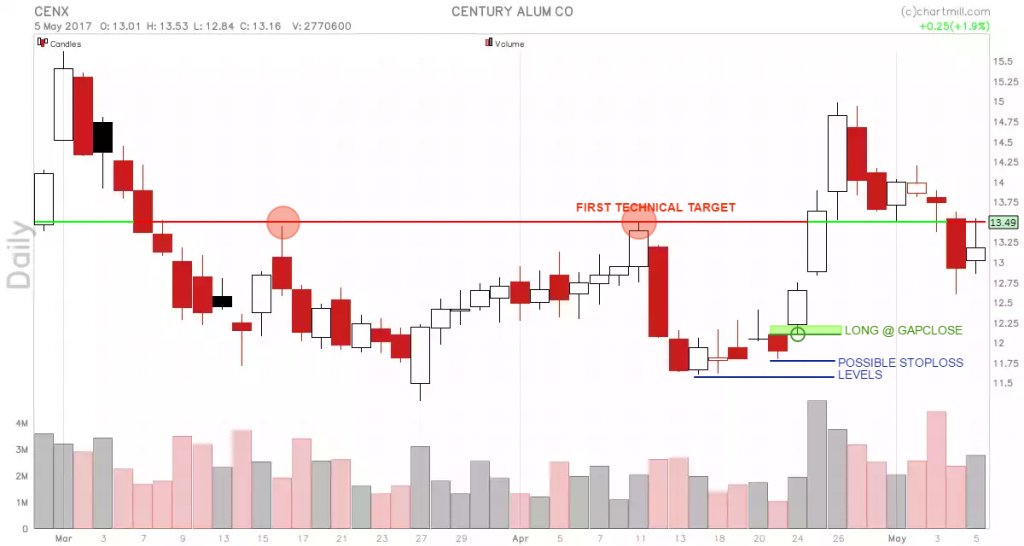
In an overal bullish trend, the level where the price gap is closed is a very interesting place for trend- or swingtraders to go long, speculating on the fact that the long term bullish trend will resume from that price level. Of course, short term traders can also benefit from this specific pricelevel to make a quick profit.
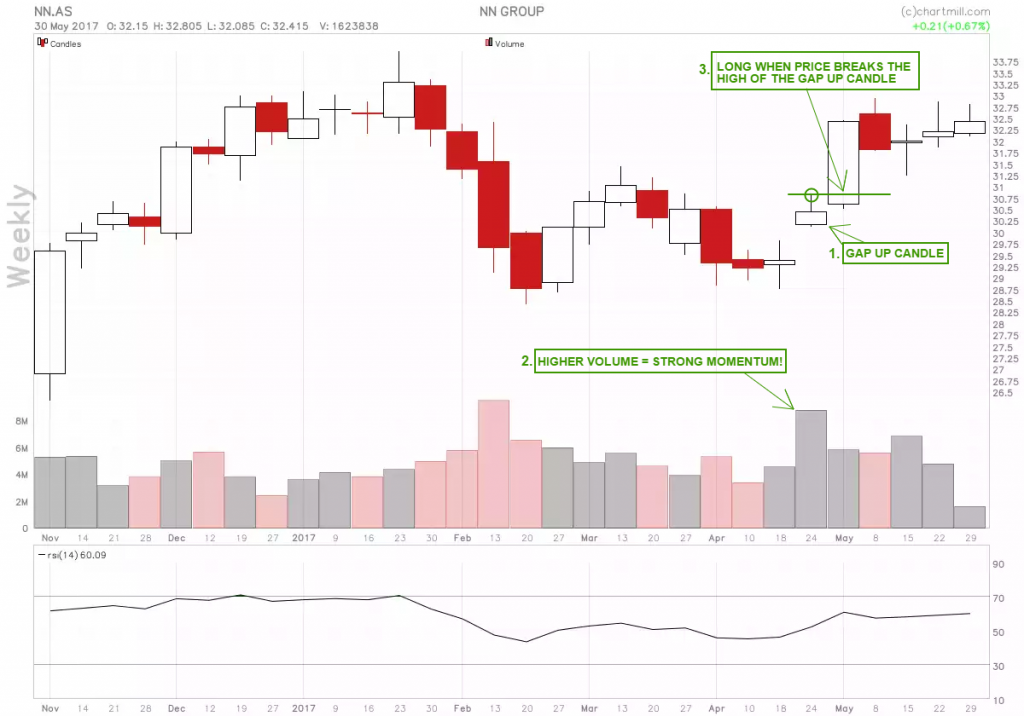
Another possibility for both the short- and longterm trader is to go long on the day after the gap up day, but only if price breaks above the highest price of the gap up day. Especially if the volume was much higher than normal during the gap up candle. This is indeed a sign that there is greatly increased momentum.