Ascending Triangle Pattern | What is it? How to trade it?
By Kristoff De Turck - reviewed by Aldwin Keppens
~ 9 minutes read - Last update: Apr 19, 2024
What is an Ascending Triangle?
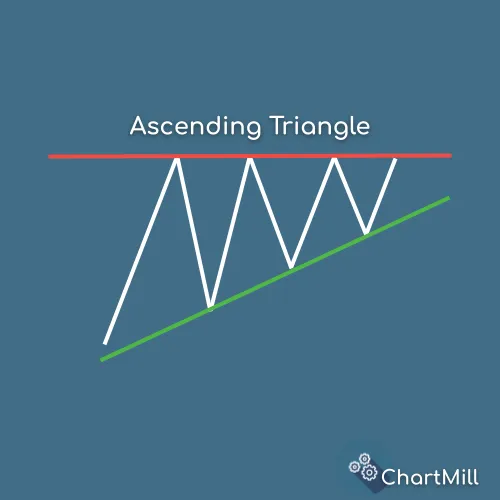
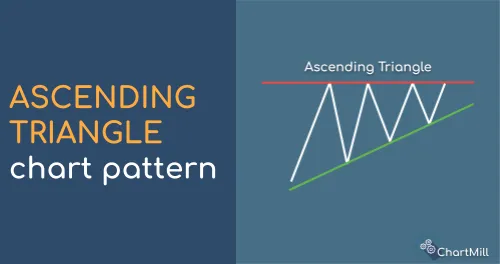
An ascending triangle is a bullish continuation chart pattern that forms when there is a strong upward trend in the price of an asset. It is characterized by a series of higher lows and a horizontal resistance area. Traders often look for ascending triangles as potential signals for future price breakouts.
This pattern is one of three known triangle patterns that become visible when more and more buyers enter the market. The price is thus driven up to a known resistance level where it fails to push up further.
The price falls again but the price floor that is reached in the process is higher each time. This creates an ascending trend line which forms the bottom of the pattern.
The pattern is characterized by two distinct lines:
- an ascending trend line connecting at least 2 higher bottoms
- a horizontal resistance line connecting at least 2 price tops that are more or less at the same level
Continuation Pattern
It is considered a continuation pattern because it typically appears in the middle of an existing uptrend. It suggests that the price consolidation is taking place before the uptrend resumes. Traders interpret this pattern as a sign that buyers are gaining strength and the price is likely to move higher.
Components of an Ascending Triangle
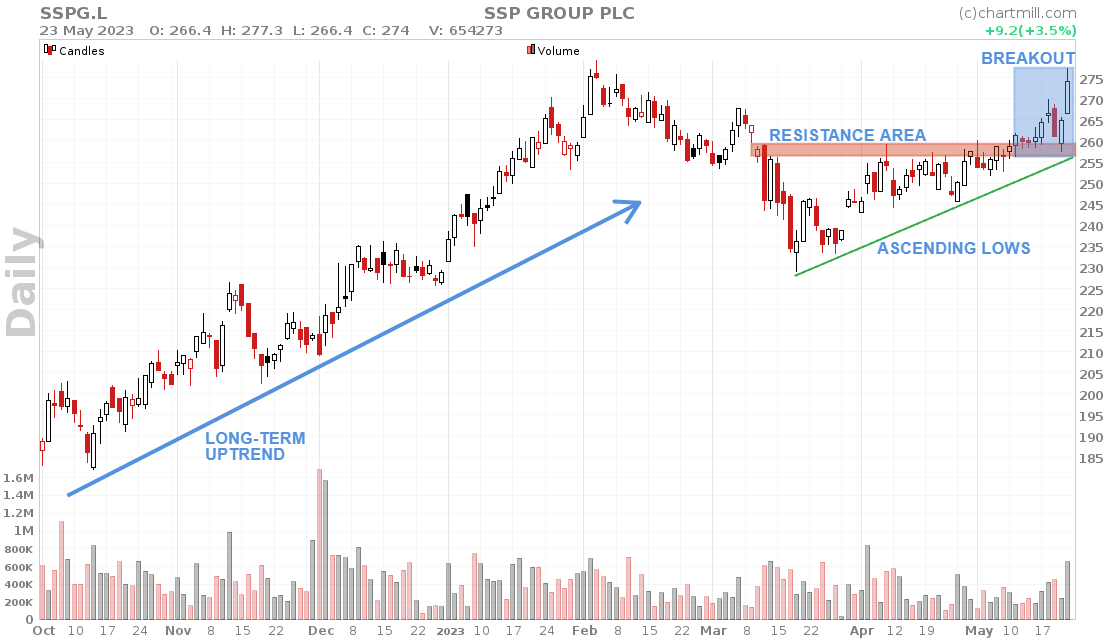
Preceding Uptrend
Before this pattern forms, there is usually a preceding uptrend in the price of the asset. This uptrend signifies a period of buying pressure and optimism among market participants.
Resistance Area
The resistance area is a horizontal line that connects the swing highs in the ascending triangle. It represents a price level where selling pressure has historically been strong enough to prevent the price from moving higher. Traders closely monitor this level to gauge the potential breakout.
Ascending Lows
The ascending lows form an ascending trendline connecting the higher swing lows in the pattern. This trendline shows that buyers are stepping in at higher price levels, indicating increased demand and potential upward momentum.
Breakout
The breakout occurs when the price of the asset breaks above the horizontal resistance line of the ascending triangle. It is typically accompanied by increased volume, confirming the strength of the breakout and signaling a potential bullish move.
Once the breakout above the horizontal line is a fact, it is assumed that the previous resistance level will take over the role of the support level. It is not uncommon to see a retest of the earlier resistance level after the initial breakout.
What Does the Pattern Tell You?
The pattern suggests that the buyers are in control and that the price is likely to continue its upward movement. The pattern also indicates a potential consolidation phase before a breakout, allowing traders to prepare for potential entry and exit points.
Two consecutive equal tops and two swing lows are necessary for this pattern. The second swing low must be higher than the first.
Patterns that have more points of contact are better because the shape will stand out more clearly and the ascending triangle will be more recognizable to traders. Especially toward the end of the pattern, it is important that the two trend lines closely converge.
Typically, the volume decreases when the triangle formation emerges. The breakout itself preferably has a lot of volume. It is a clear indication that a lot of investors assume that the breakout will lead to a continuation of the rising trend.
How to Trade an Ascending Triangle
There are two ways to use this pattern in a trading strategy.
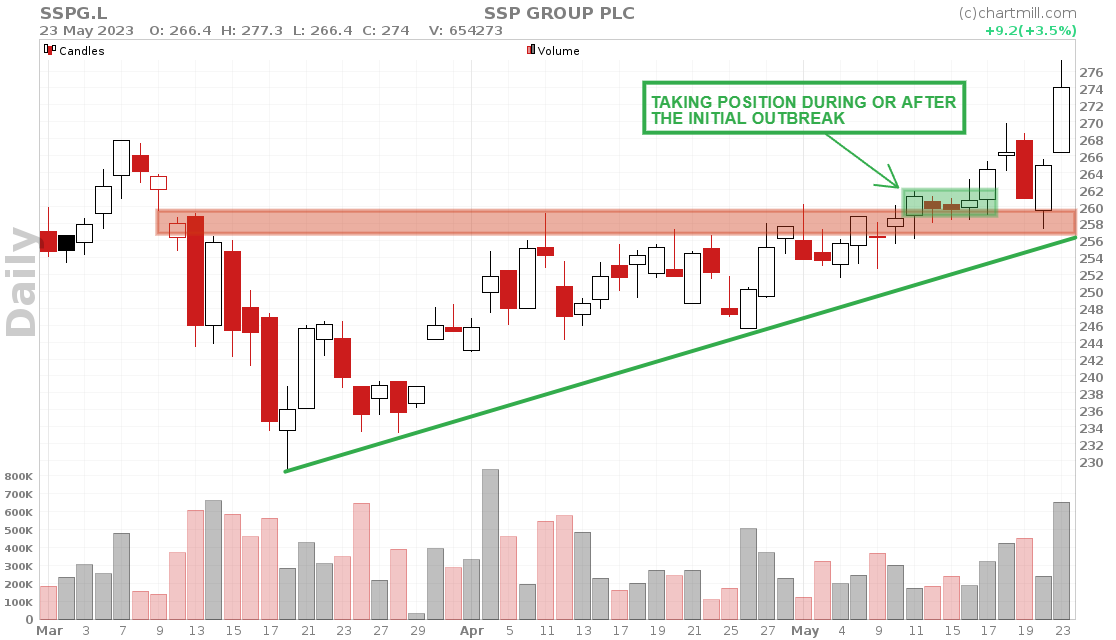
Strategy 1 - Entering during or after the initial breakout
Step 1: Identify the Pattern Formation
Look for a strong uptrend followed by a series of higher swing lows and aFirst, you need to identify the formation of an ascending triangle horizontal resistance line. Confirm that the price is consolidating within the triangle pattern.
Step 2: Wait for the Breakout
Wait for a breakout to occur. Monitor the price closely as it approaches the resistance area. Look for a significant increase in volume and a decisive move above the resistance line. This breakout confirms the bullish bias of the pattern.
You can either enter a position during the breakout itself or you can opt to wait until the price actually closes above the breakout level. If you want to avoid false breakouts as much as possible, choose the second option and wait until the close of the breakout candle.
Step 3: Enter a Trade
Once the breakout occurs, consider entering. You can enter during the breakout candle or wait for confirmation (price closes above the breakout), depending on your trading strategy and risk tolerance.
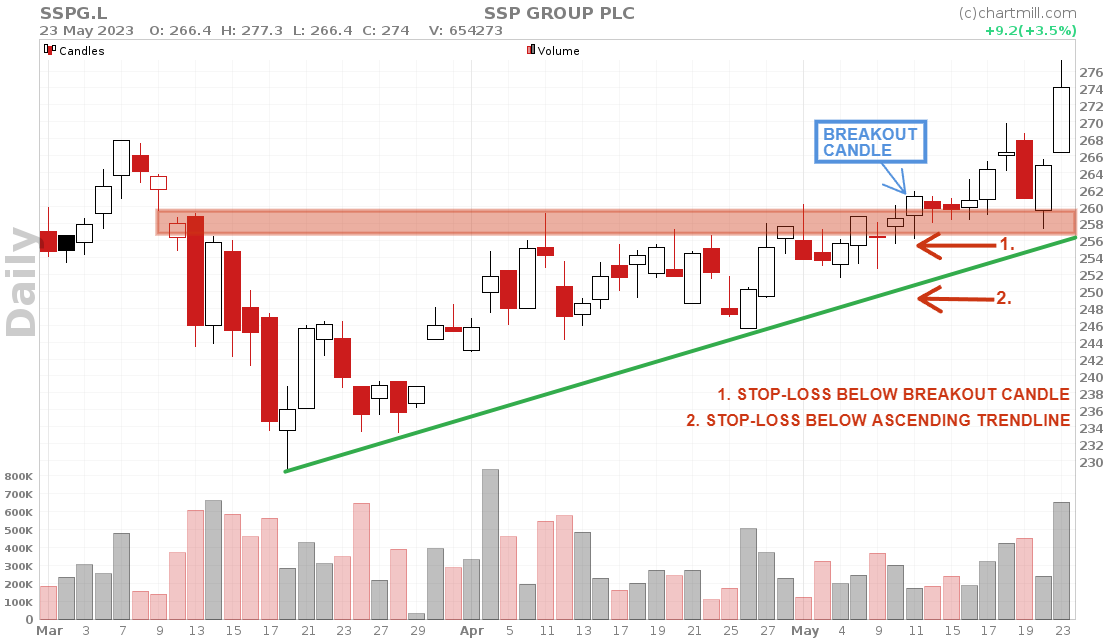
Step 4: Setting a Stop-Loss
While taking a position immediately set a stop-loss. There are several options for this as well.
Below the Breakout Point (aggressive stop-loss for scalpers and day traders):
One common technique is to place the stop-loss just below the breakout point, which is the point where the price breaks above the horizontal resistance line. By setting the stop-loss below this level, you aim to protect yourself in case the breakout fails and the price reverses back into the triangle pattern.
This approach allows for a quick exit if the trade does not proceed as anticipated.
Below the Ascending Trendline (more defensive stop-loss for swing- and position traders):
Another option is to place the stop-loss below the ascending trendline. This trendline connects the higher swing lows within the ascending triangle. Setting the stop-loss below this trendline provides a buffer in case the price breaks below the trendline and indicates a potential change in the pattern structure.
This approach allows for a wider stop-loss level and may provide more flexibility in accommodating normal price fluctuations within the pattern.
Step 4: Exit the Trade
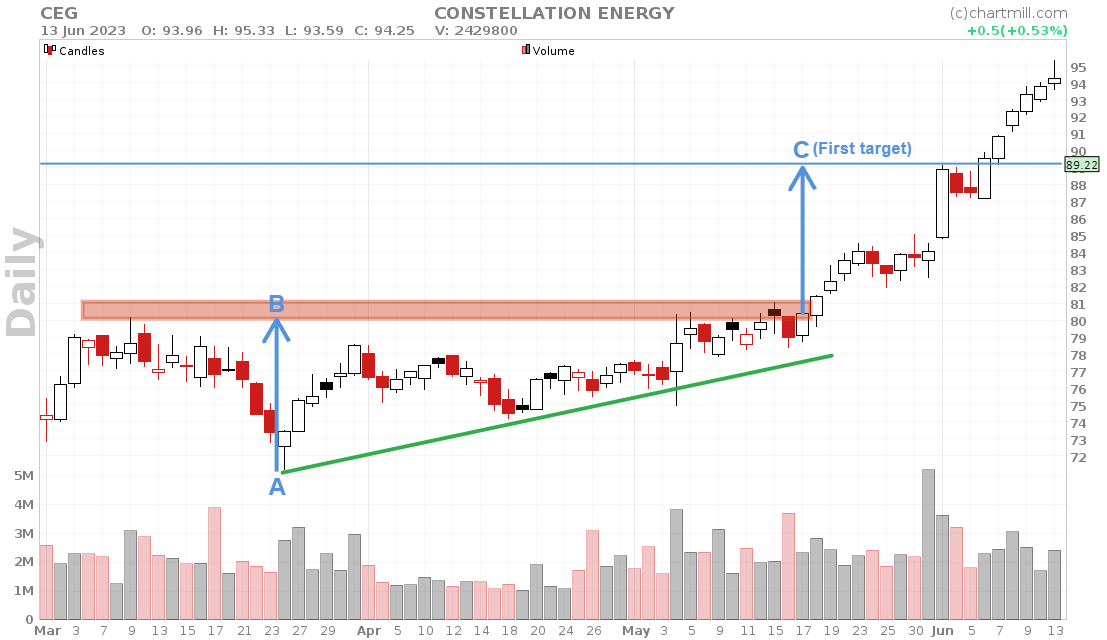
Determining the profit target can be approached in different ways. Here are three commonly used methods:
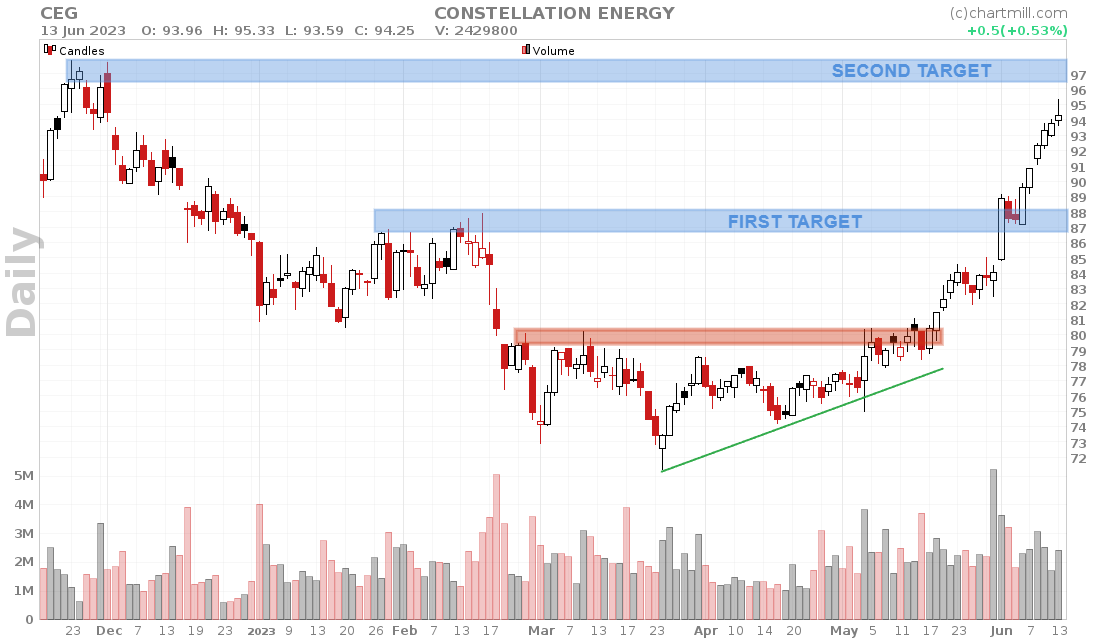
Measuring the Pattern Height: One approach is to measure the height of the ascending triangle pattern and project it upward from the breakout point. To do this, calculate the vertical distance between the lowest swing low (the start of the ascending trendline - point A on the chart) and the horizontal resistance line (point B).
Then, add this distance to the breakout point (the point where the price breaks above the resistance line). This projected distance represents a potential target for the price move (point C).
Using Multiple Resistance Levels: Another approach is to identify additional resistance levels beyond the immediate pattern. These levels can be previous swing highs or areas of historical resistance that are likely to pose challenges to the price's upward movement.
Traders may choose to set partial profit targets at these resistance levels, taking some profits off the table as the price reaches each level. This strategy allows for taking profits incrementally and managing the trade as the price progresses.
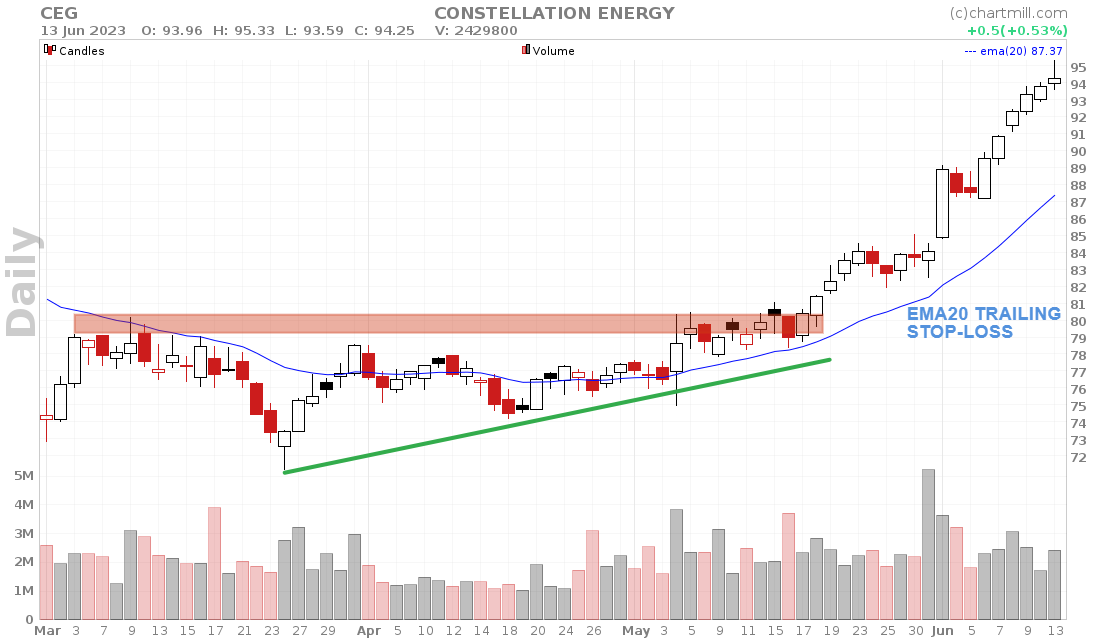
Using Trailing Stops: A trailing stop loss works by dynamically adjusting the stop loss level as the price moves in the anticipated direction. It helps you secure profits while still giving the trade room to breathe and potentially capitalize on further price advances. However, if the price falls, the stop-loss order does not fall with it.
Strategy 2 - Waiting for the Retest of the Breakout Level
Steps 1, 2, and 4 are exactly the same as in strategy 1
Step 3: Wait for a retest of the breakout level
For the second approach, after the initial breakout, one waits until the price drops again to the previous resistance level. Only then is a position bought.
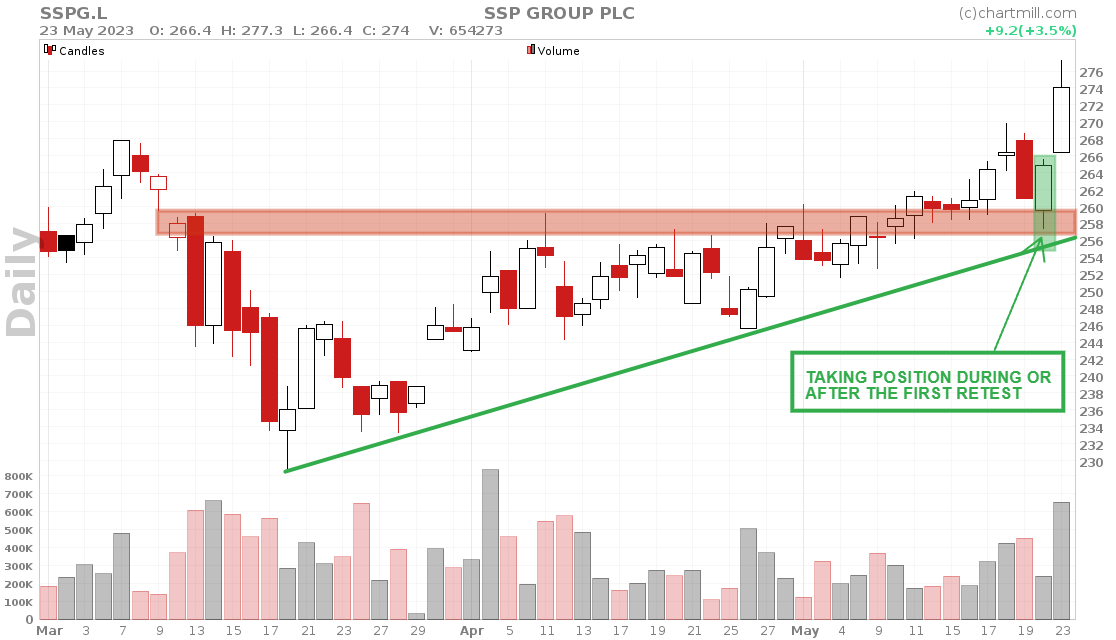
Pro Tip: In more than 60% of the cases, a retest of the initial breakout level occurs.
Limitations of Trading the Ascending Triangle
While the ascending triangle pattern can be a reliable trading signal, it is not foolproof. Traders should be aware of its limitations, including false breakouts, fake patterns, and potential market reversals.
It's crucial to use additional technical analysis tools and consider the overall market conditions before making trading decisions.
Be aware of false breakouts!
Keep in mind that the probability of a false breakout always exists, especially when this pattern occurs in a predominantly bearish long-term trend, the probability of such a false breakout is higher.
Reliability of this pattern
A lot of statistics on classic chart patterns based on a multitude of trades can be found on patternsite.com. This particular triangle pattern scores very well in the backtest as far as the upward price breakout is concerned.
Useful Tips for Trading Ascending Triangles
Confirm the presence of a preceding uptrend
It's crucial to identify a clear uptrend before considering taking a trade. This ensures that you are trading in the direction of the overall market momentum, increasing the probability of a successful trade.
Pay attention to increasing volume during the breakout
Volume plays a vital role in confirming the strength of a breakout. Ideally, you want to see a noticeable increase in trading volume as the price breaks above the resistance line of the ascending triangle. This surge in volume indicates strong buying pressure and validates the breakout, making it more reliable.
Use additional technical indicators and chart patterns for confirmation
While ascending triangles are valuable patterns on their own, it's always wise to use additional technical analysis tools for confirmation. Consider incorporating other indicators such as moving averages, trendlines, or oscillators to validate the signals provided by the pattern. Multiple confirmations can increase your confidence in the trade setup.
Consider the overall market conditions and potential catalysts
Before executing a trade based on an ascending triangle pattern, it's essential to analyze the broader market context. Evaluate the overall market trend, market sentiment, and any potential catalysts that could impact the price of the asset. A strong overall market environment and positive news or events related to the asset can significantly increase the chances of a successful breakout.
Practice proper risk management by setting stop-loss levels
Risk management is a crucial aspect of any trading strategy. Determine your risk tolerance and set appropriate stop-loss levels to protect yourself from excessive losses. Consider placing your stop loss below the breakout point or below the ascending trendline. This ensures that you exit the trade if the price fails to continue the expected upward movement, minimizing potential losses.
Pro Tip: Use our Position Sizing Calculator to calculate the number of shares you can/should buy, based on your available trading capital, set stop loss, and defined risk%.
Remember, no trading strategy is foolproof, and risk is inherent in any market activity. It's important to practice disciplined trading, follow your trading plan, and constantly monitor your positions. Regularly review and adjust your risk management strategies based on market conditions and individual trade setups.
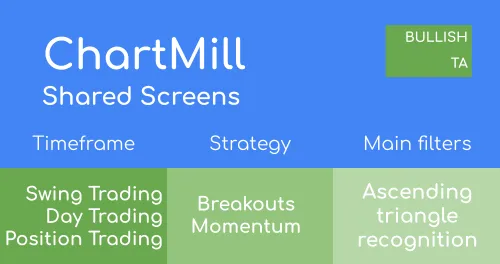
Using a Stock Screener to Find Ascending Triangle Patterns.
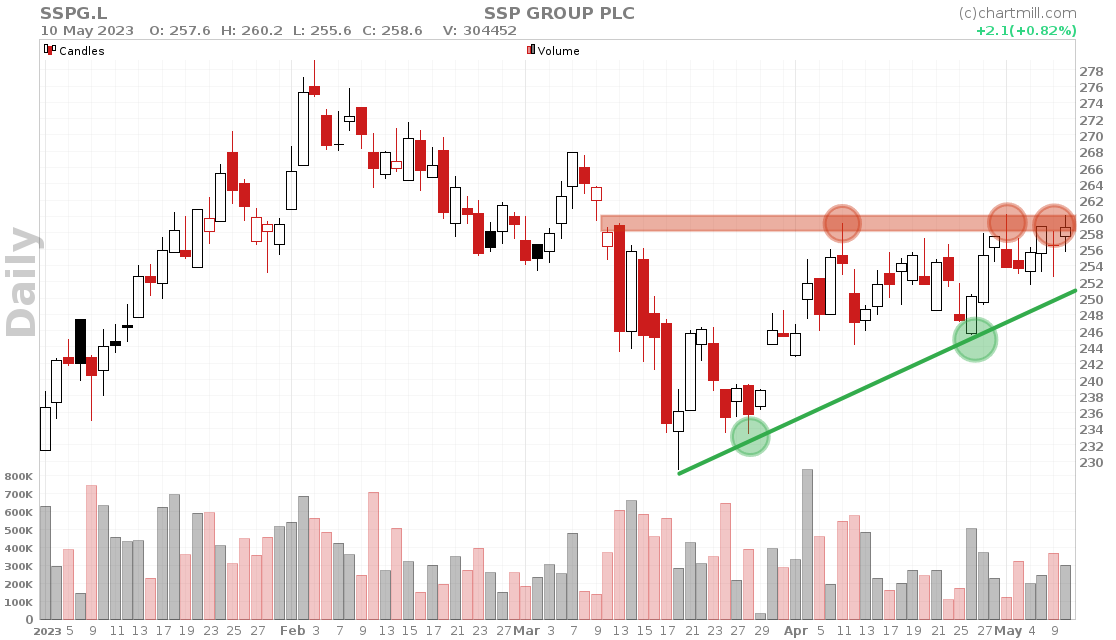
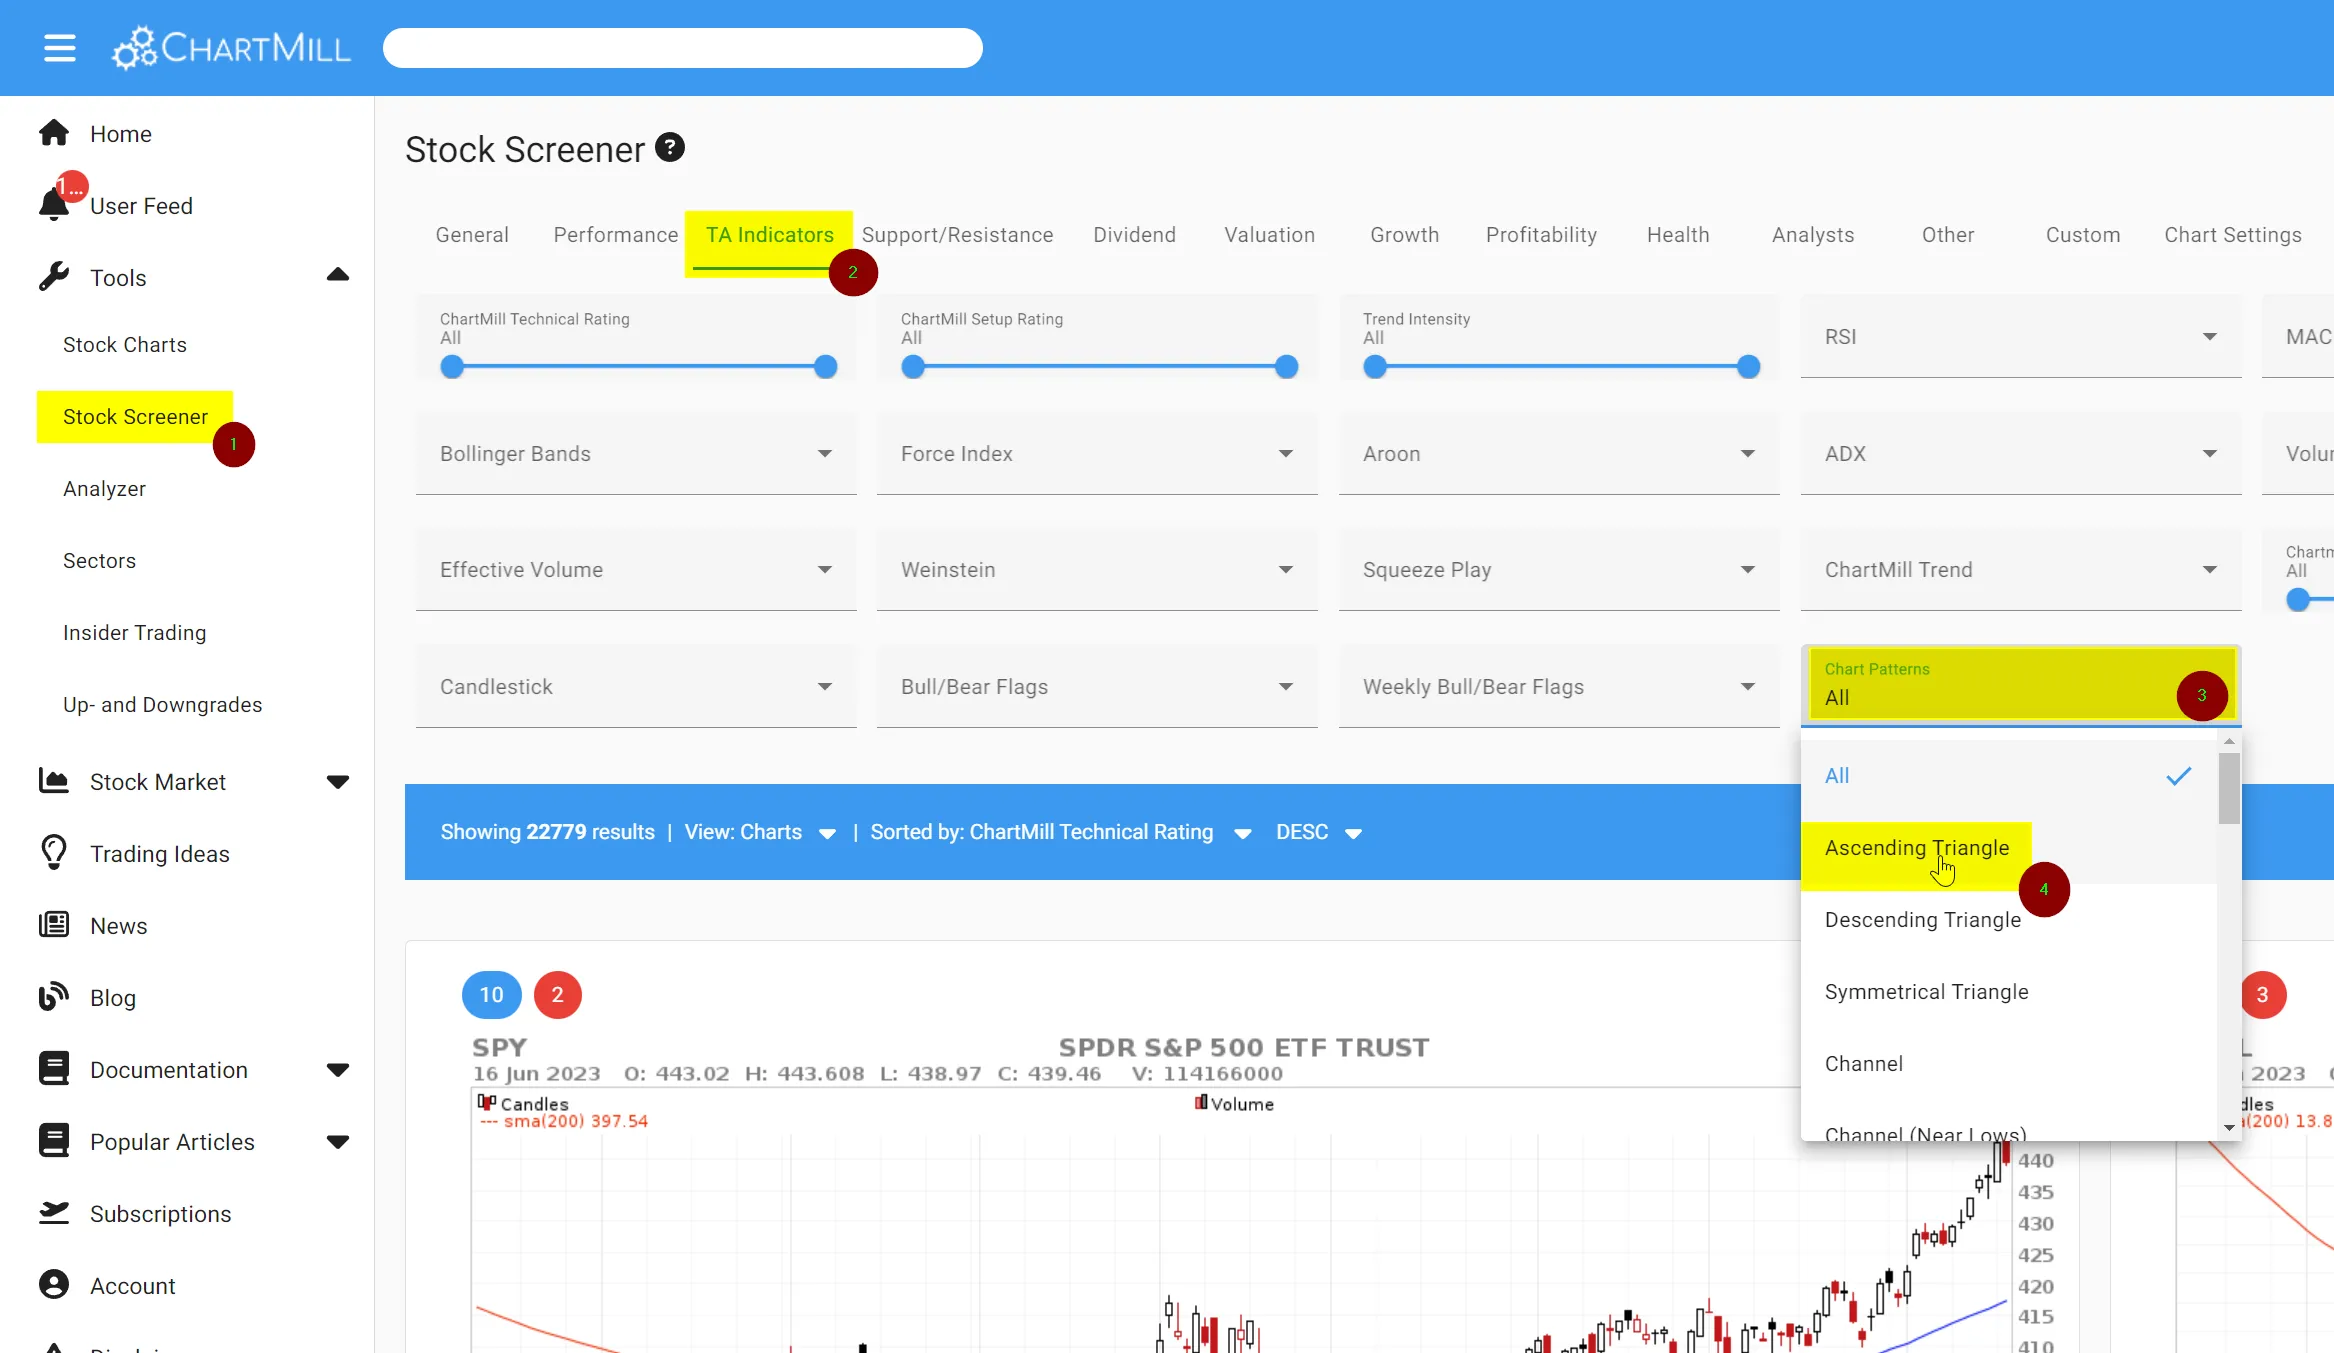
The ChartMill Stock Screener supports finding ascending triangle patterns. On top of that ChartMill will also automatically draw the trend lines which make up the pattern.
Select 'Ascending Triangle' from the 'Chart Patterns' filter on the 'indicators' tab on the stock screener page. There is a fully configured screen available in the 'trading ideas section'.
FAQs
How many touches are needed for an ascending triangle?
Overall, a valid ascending triangle pattern consists of two touches on the horizontal resistance line and two touches on the ascending trendline. These touches provide the necessary points to define the pattern and help traders identify potential breakouts and trading opportunities.
Remember, however, that the more touches are recognizable, the more reliable the pattern becomes.
Can it be a reversal pattern?
While it can act as a reversal pattern in rare instances (downward price breakout below the ascending trend line), it is not its typical interpretation. Traders and analysts primarily view ascending triangles as bullish continuation patterns, signaling the likelihood of the price resuming its upward movement after the consolidation phase.
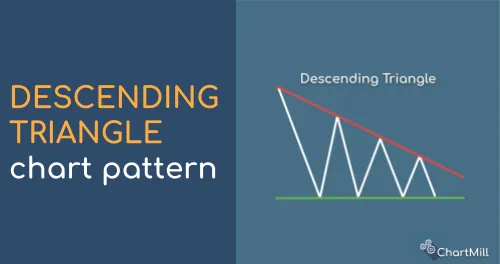
What’s the difference between an ascending triangle and a descending triangle?
The rising and falling triangle patterns are both continuation patterns, although they differ in their direction and possible implications. An ascending triangle indicates a bullish bias, with a horizontal resistance line and an ascending trendline. traders buy the breakout on the assumption that the upward trend will continue.
In contrast, a descending triangle suggests a bearish bias, with a horizontal support line and a descending trendline. traders take a short position on the downward breakout because it is assumed that the price will continue to fall.
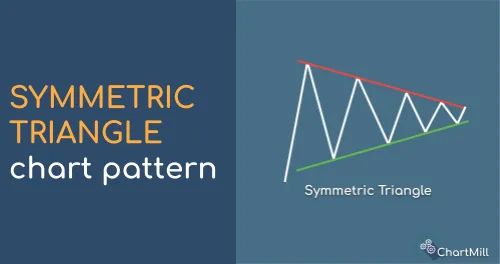
What’s the difference with a symmetrical triangle?
The difference in shape
A symmetrical triangle pattern is characterized by both a descending trendline and an ascending trendline that converge toward each other. The pattern forms when the price makes lower highs and higher lows, creating a triangle shape.
The difference in potential implications
The symmetrical triangle pattern is neutral, meaning it does not provide a clear bias for price direction. It represents a period of consolidation and indecision in the market. Traders await a breakout above the upper trendline or below the lower trendline to determine the future direction of the price.
You might also be interested in...
The Descending Triangle Pattern
This pattern is formed by drawing a horizontal line that connects a series of lower highs and a descending trendline that connects a series of equal or slightly lower lows.Read more...
Symmetrical Triangle Secrets: Enhancing Your Trading with Chart Patterns.
The symmetrical triangle pattern is considered neutral, therefore the probability of the pattern breaking out at the bottom or top is 50/50. Read More...
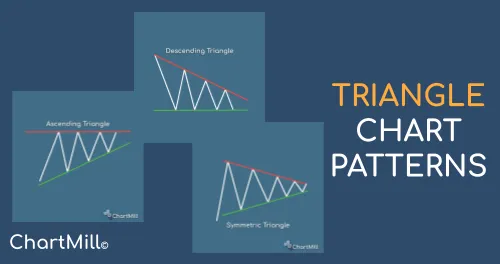
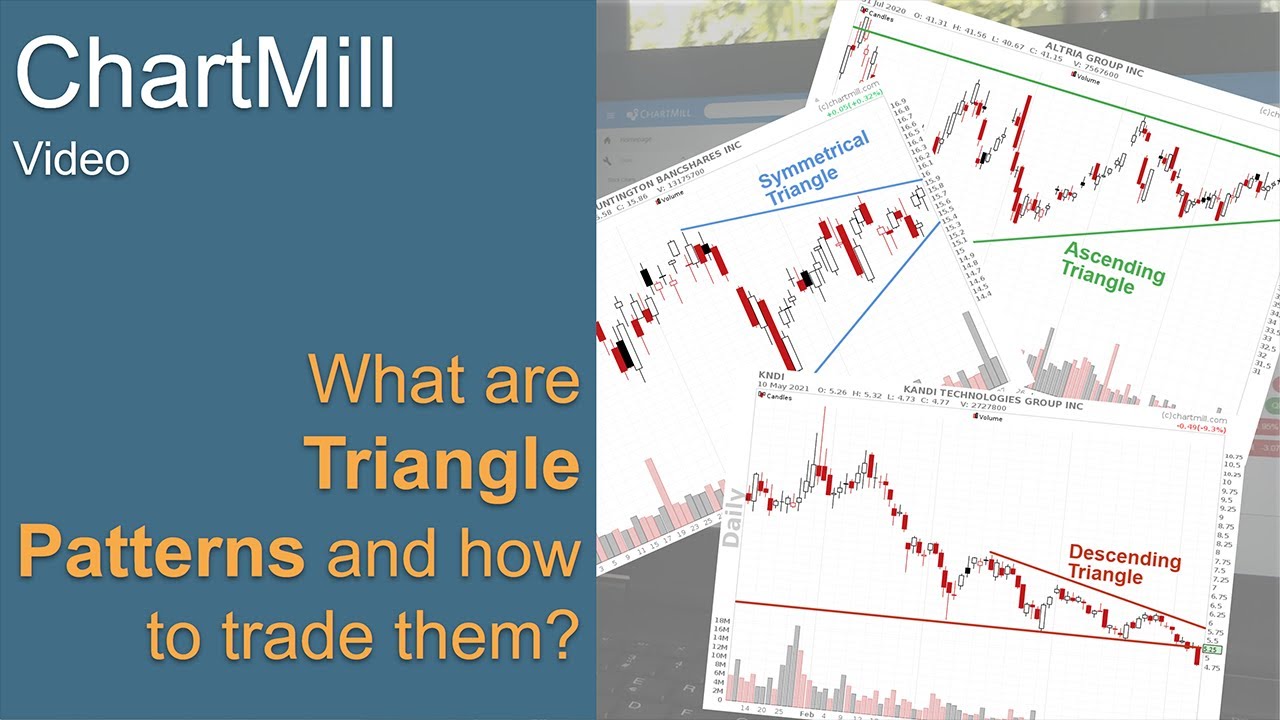
Triangle Chart Patterns
Triangle patterns are well-known chart patterns within the field of technical analysis. They exist in different formations, bullish, bearish or symmetrical. Read more...
What is the triangle chart pattern and how to trade it (video)