
Growth Investing Stock Screener Settings: find the best growth stocks

Screening for Growth Stocks
In this article we will look into how to configure the right growth stock screener criteria to find stocks which qualify best for growth investing.
Growth investing can be defined as investing in stocks that are growing faster than the market averages. While growth also plays a role in quality investing and can play a role in value investing, we will focus here on the so-called High growth stocks: stocks that are growing rapidly and typically in the early stages of their lifetime.
It is often very clear that this growth can not be sustained over a longer period of time and the growth investor is aware of that. Growth investing systems can be targeted towards a buy and hold strategy, but are often also position trading strategies.
Growth investors use fundamental analysis to find the right stocks, but position trading systems will also make use of technical analysis for evaluating the stock and the market as well as to determine the entries and exits.
We also note here that growth stocks are also popular among swing traders and day traders, be it for more short term trading.
Growth systems
Several growth screeners are available in our trading ideas library:
- CANSLIM: a very famous high growth trading system, using fundamental and technical analysis and a position trading timeframe.
- Louis Navellier's Little Book: high growth combined with analyst surprises and revisions, profitable companies. Pure fundamental analysis meant for long term holding.
- Martin Zweig's Growth at Reasonable Price: position trading system, using technical and fundamental analysis and taking into account valuation.
- Peter Lynch's Growth at Reasonable Price: Pure fundamental system, for long term holding, focusing on sustainable growth at reasonable price.
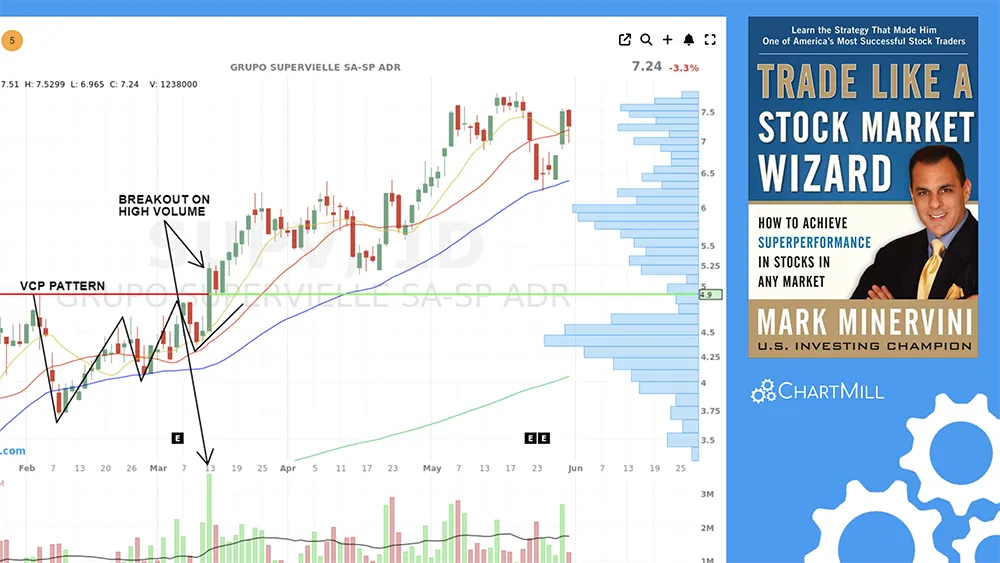
- Mark Minervini Strategy | Think and Trade Like a Champion: Mark is one of the few traders who has managed to bring together both technical and fundamental analysis into one comprehensive strategy that focuses on growth stocks, suited for position traders as well as swing traders.
- Growth Screens - Affordable Growth Stocks: Stocks which are showing good growth, decent profitability and health and are not overvalued from a fundamental perspective.
- Strong Growth Stocks with good Technical Setup Ratings: technical breakout patterns in stocks which are growing strongly while having decent profitability and health.
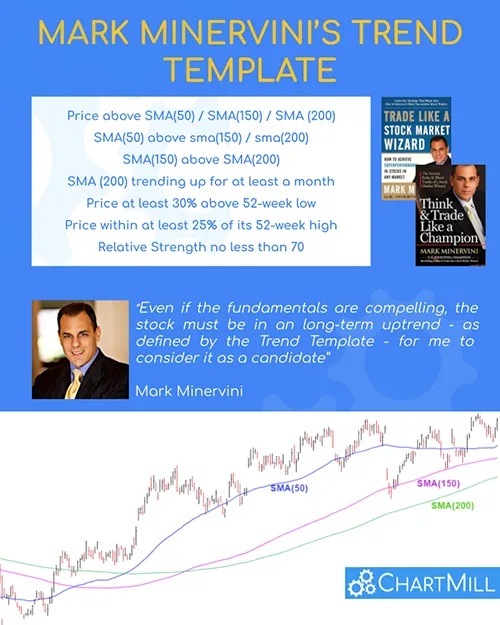
- High Growth Momentum + Trend Template: The screens filters for stocks which meet the Minervini Trend Template and have a ChartMill High Growth Momentum score of at least 6. The trend template makes sure the results are stocks which are in an uptrend, not too far of their highs and well above their yearly lows. The ChartMill HGM rating assures the results show high EPS and Sales growth and acceleration.
- High Growth Momentum Breakout Setups: This screens finds potential Breakout setups in High Growth Momentum stocks. At the same time it demonstrates the power of the ChartMill Rating by just using 3 filters: we find stocks which are high growth stocks (HGM rating above 6), with decent technicals (TA rating above 7), which show a setup pattern (setup rating above 7).
In the rest of this article we will look into the fundamental and technical filters which are useful to find great growth stocks.
Fundamental Analysis Filters
Obviously fundamental filers will be required to select growth stocks. These filters fall into the categories: growth, profitability, health, valuation, analyst surprises and revisions and other.
Growth filters: EPS, Sales, EBIT and Free Cash flow growth
All of these can be found on the 'growth' tab in the stock screener.
- EPS growth or Earnings per share growth is quite an important filter in many growth systems. Earnings (or Net Income) is what is left from revenue after paying all costs, expenses and taxes. The growth investor likes to see this grow.
- As earnings per share can grow also by reducing expenses or reducing the number of shares, often Revenue (or Sales) growth is used as an additional filter. Higher sales indicates real expansion.
- Some systems prefer Free Cash Flow growth, as this represents the real cash generated for shareholders.
- EPS, Sales, Ebit and Cash flow growth filters are available over multiple periods. Typically the growth investor will focus on the last year and last 3 year periods.
- Q2Q growth is available for Sales and EPS growth and filters for the growth of the most recent quarter when compared to the same quarter a year before. Q2Q is often used to capture 'earnings momentum' which looks at the most recent reports.
- Forward growth filters are available for EPS, Sales and EBIT and go up to 5 years in the future. It is important to understand these numbers are based on analyst estimates. When using these filters you restrict the list to stocks having these numbers (and thus stocks having analysts). Even when stocks do have analysts, they do not always provide estimates 5 years ahead, while 1 or 2 years ahead are typically provided.
- Also the ChartMill Growth score, which bundles several growth aspects of the stock in 1 rating can be used as a filter to select growth stocks.
- For those seeking a more streamlined approach, the ChartMill High Growth Momentum Rating combines several key metrics, including quarterly and yearly acceleration, to identify stocks with robust growth potential and momentum.
The ideal settings depend on the goal. Systems like CANSLIM or Navelier say: the more, the better and require at least 25% to 30%, while for instance Peter Lynch would ignore rates above 30% to ignore non sustainable growth.
EPS and Sales growth acceleration.
A very important concept, especially in systems focusing on high growth stocks, is the concept of acceleration. We speak of acceleration when the growth numbers are improving. For instance, when sales grew by 50% in the last quarter, while having grown by 40% in the quarter before that, we can say the sales growth is accelerating.
The screener has built-in filters for both quarterly and yearly EPS and Sales growth acceleration. You can also achieve the same or variations with custom expressions. For both sales and EPS the Q2Q numbers of the last 5 quarters and Y2Y numbers of the last 4 years are available to work with.
You can find these filters on the growth tab, under the label 'EPS/Revenue acceleration':

You can filter for companies with accelerating EPS or sales in the last quarter or even companies improving their sales or eps growth for multiple quarters in a row.
Analyst Revisions and Earnings Surprises
Analyst Revisions and Earnings Surprises can be found on the 'Analysts' tab in the stock screener and are considered strong signals for growth investors.
When a stock is able to beat the expectations (earnings surprise) it basically means it performed better than everyone expected. When combining this with other growth filters, we find stocks which are growing strongly already, but also manage to beat the expectations. In the screener you can filter for EPS and Sales surprises in the last 2 or 4 quarters.
The same logic goes for revisions: when analysts start to revise their estimates to the upside, it means they now think the company will do better than they thought before. There are filters for revisions in the last month or 3 month periods of the estimate for the next quarter or next year estimate.
Profitability Filters.
Profitability is not strictly a must for growth investing, but the Return on Equity (ROE) and Operating Margin as well as Profit Margin are typical ratios used in the growth investing context. All of these can be found on the 'Profitability' tab in the screener.
The Profit Margin is the link between EPS and sales as it expresses the percentage of sales which can be turned into net profit and this is why it is also used in growth systems. ChartMill offers several filters to check the improvement of the different margins. There are the 1-,3- and 5 year growth rates, but for the profit margin it is also possible to filter the improvements for quarter to quarter or year to year. Make sure to check the filters under the 'Profit Margin Advance' label.
Health filters
Debt/Equity is a typical ratio used in growth investing, making sure no excessive debt is used to finance growth.
Valuation filters
Many growth investing systems ignore valuation completely and focus on growth. Some, so called Growth at reasonable price systems will include valuation filters to make sure of a reasonable valuation. Price to Earnings or Peg ratio, which compensates the P/E ratio for growth, are typically used in these cases.
Other
Other filters may be:
- the number of outstanding shares or the float
- the institutional ownership percentage
- insider buying
These filters can be found on the 'general' and 'other' tabs in the screener.
Technical Analysis Filters
Many Growth investing strategies have a technical component. In this case additional technical filters will be applied to select the right stocks for the system. Technical filters may be used both to further restrict the list, or to find stocks having good entry points in the selection.
The fundamental filters above are selecting stocks that should move. But as we all know, it is not because something should move that it also does move. A buy and hold approach which is only based on fundamental filters will recognize the fact that you can't know when it will move and will hold the stock with the idea that at some point it will indeed move as we expected.
Position and swing trading systems recognize that although the fundamentals scream a move higher, the market does not necessarily do what it is supposed to do. So they apply additional technical analysis to select only those stocks that are moving as expected.
We will give an overview of typical technical indicators used by growth investors below.
Performance and Relative Strength
Relative Strength is an important aspect of growth systems which make use of technical analysis. Relative Strength ranks all stocks according to their performance over the past year, with some additional weight on the last 3 months. The stock with relative strength 100 is the best performing stock of the bunch. By selecting stocks with a high relative strength you make sure to select only the best performing stocks.
Next to the relative strength number, you can also just look at the 1, 3, 6 and 12 month performance numbers and compare these to the indexes.
There is also the ChartMill proprietary concept of strong stocks which also checks the stability of the move in the last year for high relative strength stocks.
New highs
A new high is another strong indicator of a stock behaving well. Several filters are available to check whether stocks are at or near new highs in various periods.
Volume
When a stock breaks out above a certain price level with significantly higher than normal volume, it indicates strong buying momentum and the likelihood of a sustained uptrend.
This increase in volume provides confidence that the breakout is real and not a false signal, reducing the risk of premature entry or exit.
Volume is therefore a technical tool that effectively helps in timing entry by taking advantage of powerful short-term price movements driven by the underlying strength in the company's financial performance.
Large Players: Pocket Pivots and Effective Volume
Pocket Pivots are described in the book ‘Trade Like an O’Neil Disciple’ of Dr. Chris Kacher and Gil Morales, and are available in both the ChartMill Screener and Charts. A Pocket Pivot is a price/volume pattern that reveals an interest of large players.
For revealing the interest of large players, also effective volume is a great indicator for growth investors.
Base formations: Chart Patterns & Consolidations

Next to finding the right stocks, growth investment systems like CANSLIM also need to manage the timing of the entry. In his book, ‘How to Make Money in Stocks’, O’Neil describes 8 different chart patterns that are used to enter the market. Often a breakout out of a consolidation zone is the preferred entry.
“As an individual investor, you too need to study and benefit from stock charts. It’s not enough to buy a stock simply because it has good fundamental characteristics, like strong earnings and sales.”
Mark Minervini's Volatility-Contraction-Pattern (VCP) is another great example of how a technical price pattern, along with volume and volatility, is used to determine an entry into a high-potential growth stock.
“The main role that VCP plays is establishing a precise entry point at the line of least resistance.”
ChartMill is equiped with many tools to facilitate this:
- The articles How to screen for breakout stocks and How to Enter a breakout trade contain a lot of information on this.
- Support and Resistance allow you to find consolidations and entry points.
- The ChartMill Setup score indicates in 1 number to what extend the stock is consolidating and can be used as a quick filter to find breakout setups.
- Many Chart Patterns are available directly in the screener. Also squeeze plays, which use Bollinger Bands and Keltner Channels, are an efficient way to find narrow ranges and pending breakouts.
- Even more inspiration can be found in the breakout screen list in our screen library.
Industry Strength
Often good growth candidates come from sectors or industries which are behaving strongly as a whole. The sector tool allows you to rank sectors, groups, industries and even sub-industries on their performance and would be a good place to start a top down selection.
Market timing
Systems like CANSLIM, but also Martin Zweig have a market timing component as well.
Mark Minervini uses a ‘trend template’ that he applies on every single stock he’s considering. If a stock doesn’t meet those trend template criteria, he doesn’t consider the stock, even if the stock fundamentals are compelling.
Using a form of market timing boils down to recognizing that the overall market does not always behave the same. You have bull and bear periods and these periods may last several years. Be sure to also keep an eye on our market monitor page where several specific breadth indicators are monitored.
When the general market is declining there is a good chance that, no matter how good your stock is, it will decline with the rest of the market. Such systems would only invest in bull periods while staying in cash in bear periods.
Another important concept we want to touch on here is about progressive exposure. This is a proactive strategy that ensures that larger positions are taken when markets are favorable in order to take full advantage of positive market momentum. The same strategy also ensures that that exposure is quickly reduced when markets are bearish.
Market timing models come in many forms and can become complex quickly, but a simple one may do as well: if you inspect the ChartMill Trend Indicator on the weekly charts of SPY,QQQ and IWM you will get an idea on the current market situation.
Chart Settings
Besides the classic chart views, there are a number of view settings available that bring together multiple data that are important for growth stock analysis. For instance, you can choose the Fundamental Growth view or the Fundamental Earnings Growth & Acceleration view.
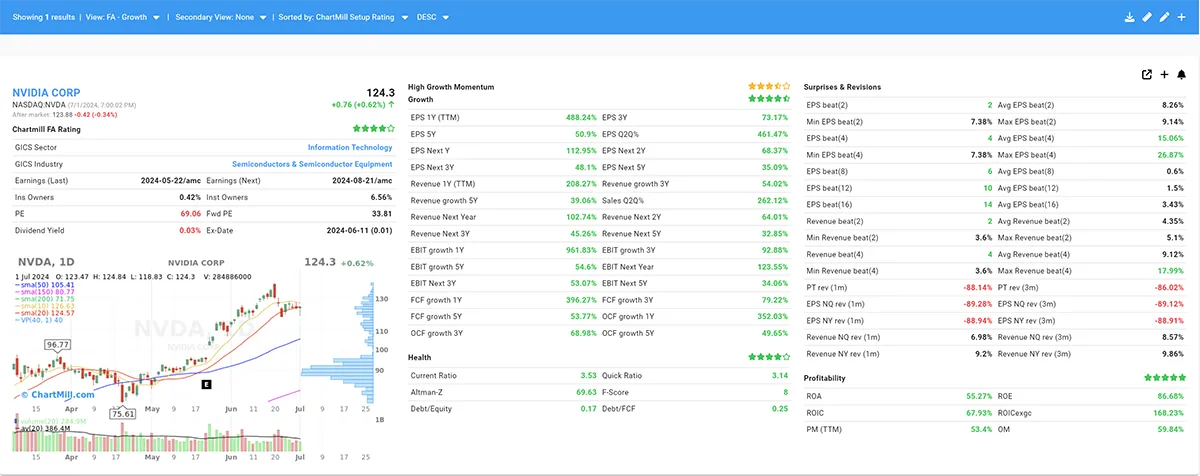
Fundamental Growth View
Fundamental Earnings and Momentum View
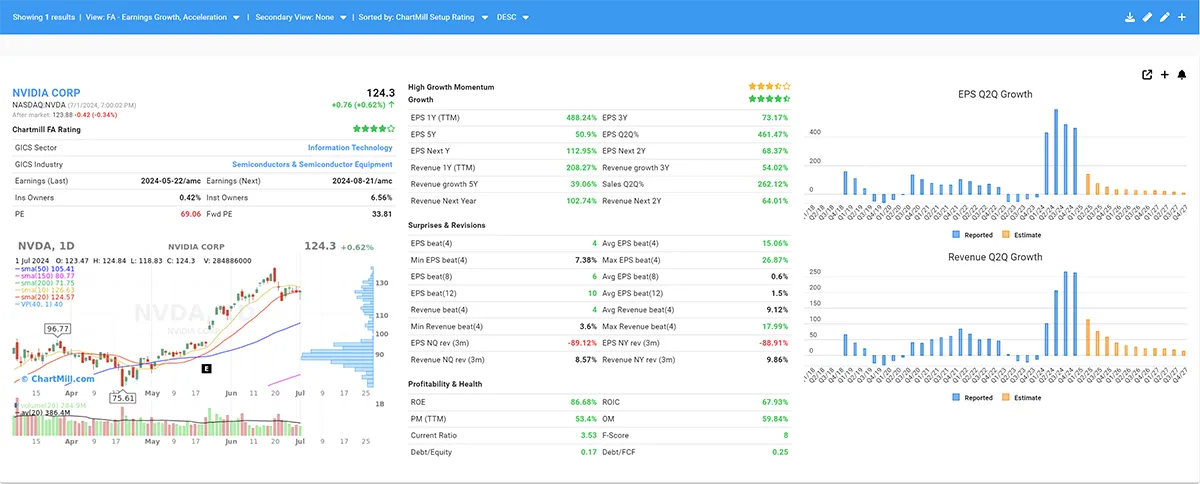
Subscribers can additionally add an earnings table below or above the chart where the High Growth Momentum Rating is also shown in the top left corner of the chart, alongside the Technical & Setup Rating Score.

Risk Management & Position sizing.
Finally, we should say something about the typical sizes of the positions. Long term buy and hold systems often build a diversified portfolio, while shorter term position trading systems focus on fewer stocks (larger positions), but will cut losses and protect profits. Our position sizing calculator can help you on deciding the right position size for your strategy.
Especially in terms of swing trading, it is crucial to keep loss positions small. Both O'Neil and Minervini use an initial stop loss of about 6 to 9% after initial entry before taking the loss off the table. Most importantly, winners should be given room to flourish. The key to success with both O'Neil and Minervini lies in the fact that their winners are at least 2 to 3 times larger than their loss positions.
In that scenario, it is no problem at all to close roughly 6 out of 10 traders with a loss. When the remaining four trades average twice the risk, the system is profitable.