
Chartmill Trend Indicator
The Chartmill Trend Indicator indicates whether a trend is positive, negative or neutral. The indicator is available in our charts as an overlay or as a standalone indicator. Originally the indicator was intented to indicate the long term trend and was intended to be used in the weekly timeframe. But, it can be used in other timeframes as well.
Chartmill Trend Overlay
You can add the overlay to your chart by selecting the "ChartMill Trend Overlay" from the chart overlay indicators. The overlay will be colored green when the trend is positive, red when it is negative or grey when it is neutral.
Chartmill Trend Indicator
You can add the indicator to your chart by selecting the "ChartMill Trend Indicator" from the chart indicators.
The standalone indicator has a value 1 for a positive trend, -1 for a negative trend or 0 for a neutral trend. The same color code is used in the standalone indicator. The indicator is meant to be used on a weekly time frame and measures the long term trend. It can also be used in the daily time frame to indicate shorter term trends.
The distinction between positive, negative or neutral is made by comparing the price to the position of the 30 week exponential moving average (30 EMA):
- The trend is positive if the low of the week is above a rising 30 EMA and the 30 EMA has been rising for at least 3 weeks.
- The trend is negative if the high of the week is below a declining 30 EMA and the 30 EMA has been declining for at least 3 weeks.
- Otherwise the trend is neutral.
Although the trend indicator has a fairly simple formula for determining a trend, the example will show that the results are quite pleasing. We will have a look at the S&P 500 over the last 10 years by looking at the chart of SPY:
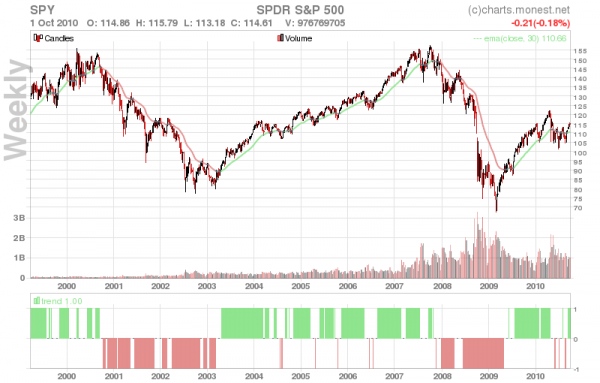
On the chart you can see that
- Until around August 2000 the trend is mainly positive
- From August 2000 till round March 2003 the trend is mostly negative. It does return to neutral territory a couple of times, but never becomes positive.
- From 2003 till late 2007 the trend remains mostly positive. It did fall into the neutral or even negative area during the more heavy corrections.
- From 2008 till March 2009 the market is almost fully in the negative area.
- After March 2009 we are again in a positive area.