Navigating the Volatility: Bollinger Bands Explained
What exactly are Bollinger Bands?
-
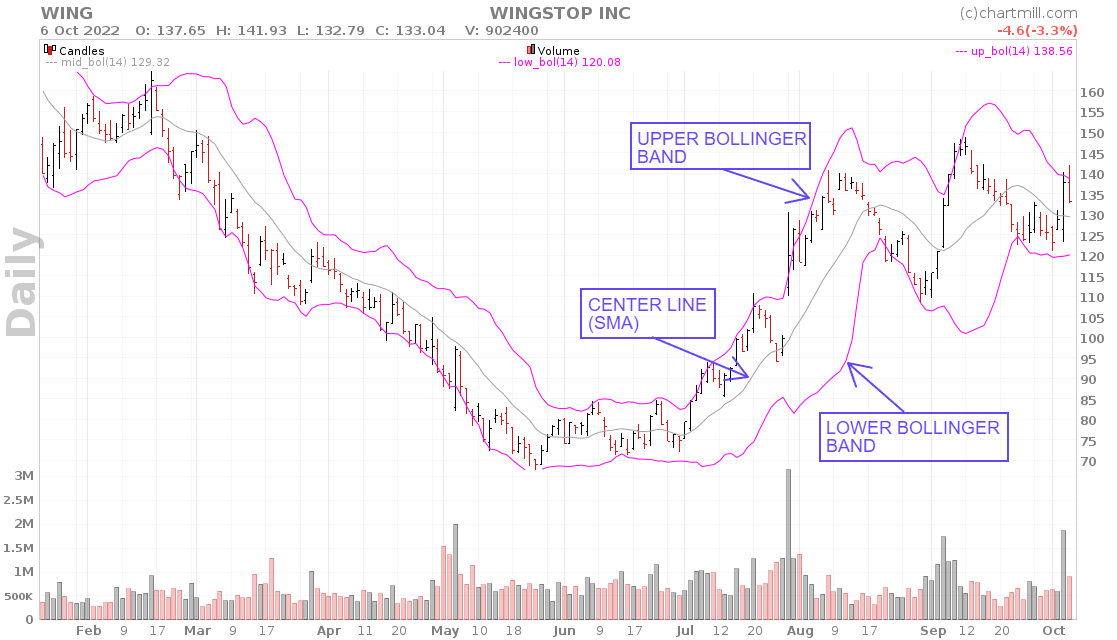
Bollinger Bands® is a dynamic indicator, consisting of three lines. A middle, upper, and lower band. The middle band is a simple moving average (SMA), set at 20 periods by default.
-
The lines above and below this SMA are standard deviations. These are located at two standard deviations from that same SMA. This visualizes the volatility of the price. They represent the degree of price dispersion around that middle band.
The reason two standard deviations are used is that this configuration contains about 95% of all price action. A price that falls outside those limits is very much more likely to be exceptional and thus valuable information for active investors.
Bollinger Bands are a very popular tool within the field of technical analysis. They were designed by John Bollinger in the early 1980s, and used by traders on various financial markets (stocks, currencies, commodities,...).
In this article, we will give some more insight into how this indicator is created and what it can be used for.
Calculating Bollinger Bands
The Bollinger Bands can be calculated manually as follows:
-
first calculate the simple average (SA) over the past 20 periods based on the closing prices in the timeframe used.
-
After the first 20 periods, period 21 will replace period 1 creating the "moving" average (SMA).
-
Next, the standard deviation must be calculated to find out how far away the numbers are from the average value. How that standard deviation is calculated can be read here.
-
Since the default is twice the standard deviation, we multiply that value by two. The number obtained is then added to all periods to arrive at the upper Bollinger Band. For the lower band, that same number is simply subtracted from all periods.
The exact formula:
Middle Band (MB) = 20-period SMA
Upper Band (UB) = MB + (2 * 20-period standard deviation)
Lower Band (LB) = MB - (2 * 20-period standard deviation)
How to correctly interpret Bollinger Bands?
Bollinger Bands width
The bandwidth in Bollinger Bands plays an important role in visualizing the level of volatility.
Bandwidth = ((upper Bollinger Band - lower Bollinger Band) / centerline)
-
A high bandwidth indicates that price movements are rather strong and thus volatility is high.
-
A low bandwidth indicates low volatility and shows that the price is quietly moving sideways in a narrower price channel.
-
A strong downtrend (blue box on the left) causes the lower Bollinger Band to be broken repeatedly over an extended time. The longer this period lasts, the more likely it is that the end of the trend is in sight.
-
When the price moves sideways and the distance between the upper and lower Bollinger Bands is small (blue box on the right), this indicates that a larger move in either direction is imminent.
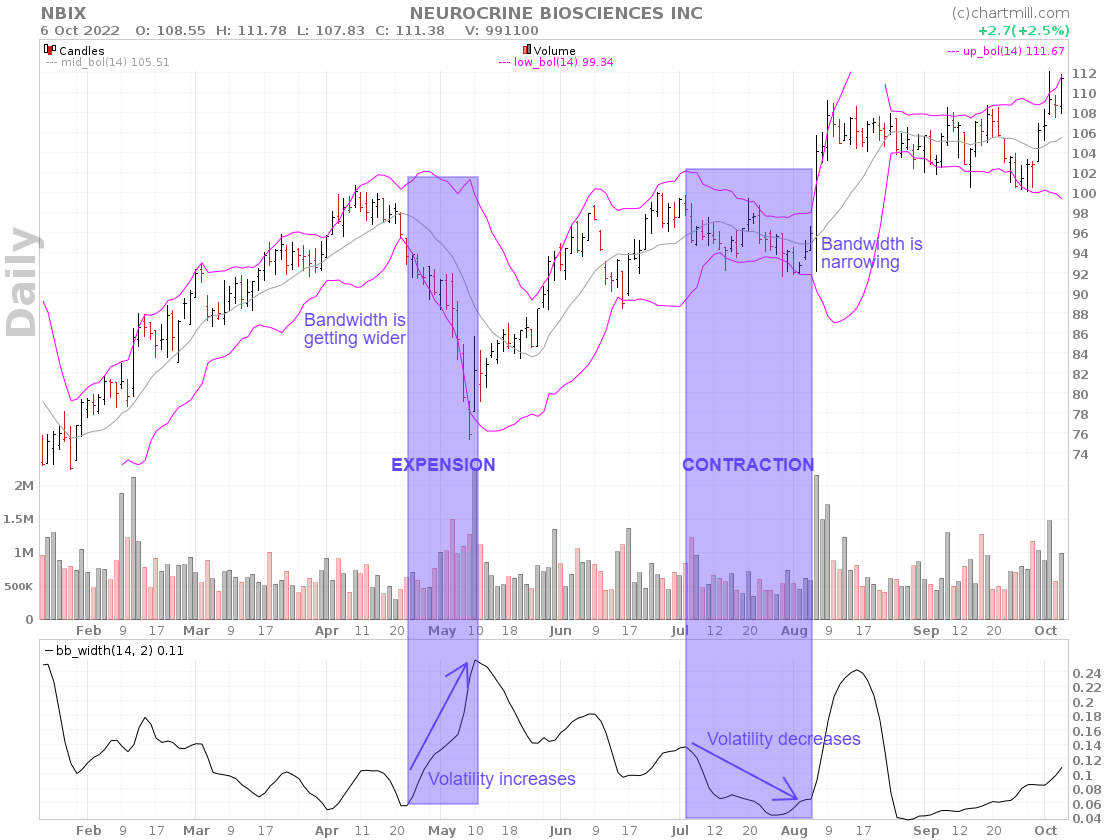
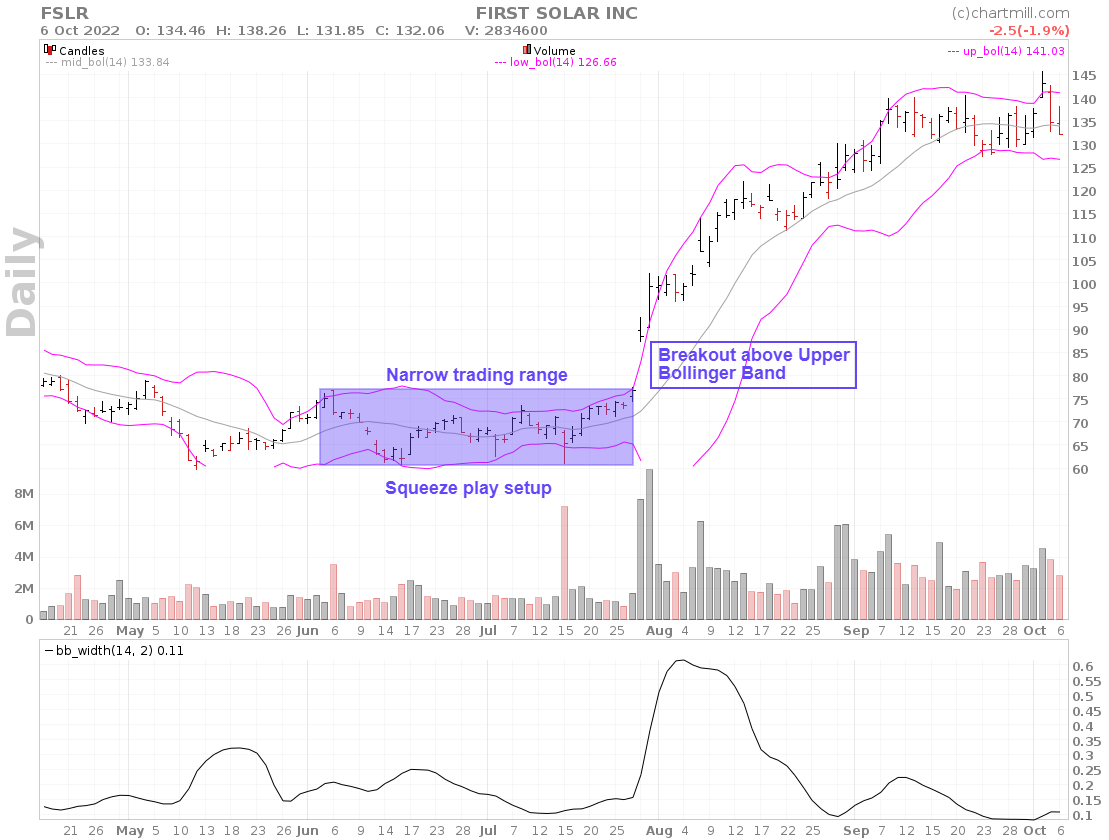
This process, in which the upper and lower bands converge and the bandwidth narrows, is also known as the "squeeze" effect. Traders will watch this effect closely to take advantage once the price breaks out in either direction.
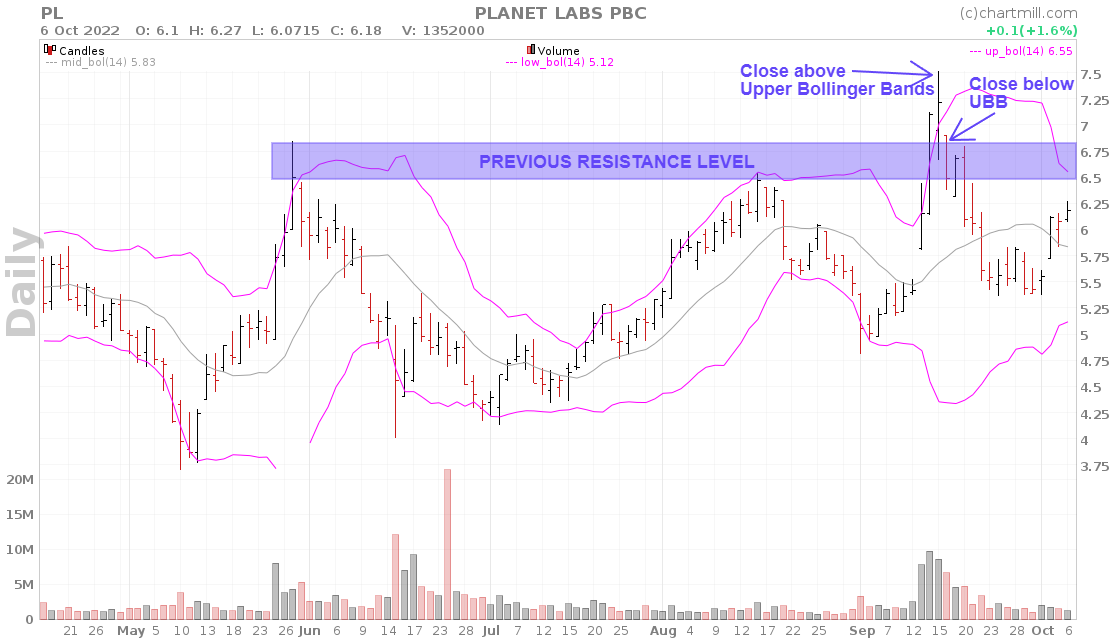
Such a breakout occurs once the price moves above the upper band or below the lower band. A breakout above the upper band is seen as bullish, while a breakout below the lower band is seen as bearish. Traders use these breakouts as potential entry points for their trades, believing that the price can move further in the direction of the breakout.
What are the disadvantages of Bollinger Bands?
Despite their popularity, there are some drawbacks to using Bollinger Bands.
-
The default settings, being an SMA20, combined with two standard deviations to calculate the upper and lower bands are commonly used but depending on the instrument or timeframe in which one trades, there may well be better settings. Especially for those who trade almost exclusively in the same stock or ETF, it may be worth experimenting with alternative settings.
-
Periods of low volatility can be characterized by multiple consecutive false breakouts above or below the corresponding bands. It is precisely for this reason that it is advisable not only to use Bollinger Bands but to combine them with other indicators or chart patterns that confirm the breakout.
-
Strong upward momentum ensures that the price will break out above the upper band. Despite the standard deviation used, which captures 95% of the price movements, the price may stay above the band for a longer period if momentum persists.
Bollinger-Bands-Strategies
The Squeeze Play - Breakout setup
The Bollinger Bands Squeeze occurs after a period of low volatility where the upper and lower Bollinger Bands are squeezed closely together, so to speak.
As visible on the chart, the price moves sideways in a tight trend channel. This squeeze is used as part of a breakout strategy where traders go long or short as soon as the price closes above or below the upper/lower Bollinger Bands.
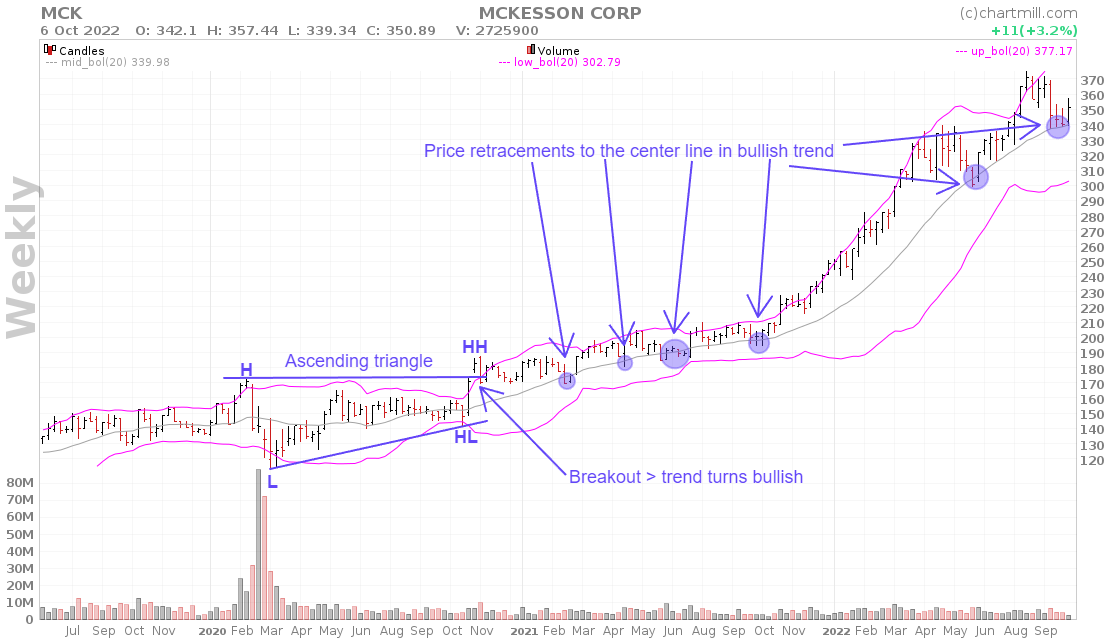
Trend Continuation - Pull back setup
Trading when the stock undergoes a small price decline in the direction of the main trend (pull back or retracement setup) is a common strategy in which Bollinger Bands are used. In the example below the trend changes to positive once a breakout above the ascending triangle occurred and the first higher high and higher low were confirmed.
In that case, the centerline or lower Bollinger Bands can be used as target points where opportunities may present themselves to enter the market and benefit from the existing long-term trend.
Bollinger Band Reversals - mean reversion setup
Bollinger bands can just as easily be used as part of a mean reversion strategy. We mentioned earlier that when volatility is high and the bandwidth is wide, the probability increases that the existing trend will lose momentum and eventually reverse.
It is important not to take an opposite position simply because the distance between the upper and lower Bollinger Bands is large or because the price has hit or broken a bollinger band several times in a row.
Always keep in mind that these are mere indications and not isolated trading signals.
Additional converging elements such as, for example, the reversal occurring at an earlier support or resistance level are very important to strengthen the hypothesis of a reversal before taking the trade.
Bollinger Band Filters in ChartMill
ChartMill allows you to apply filters that use the Bollinger Bands. These can be found under the 'TA-indicators' menu on the stock screener page.
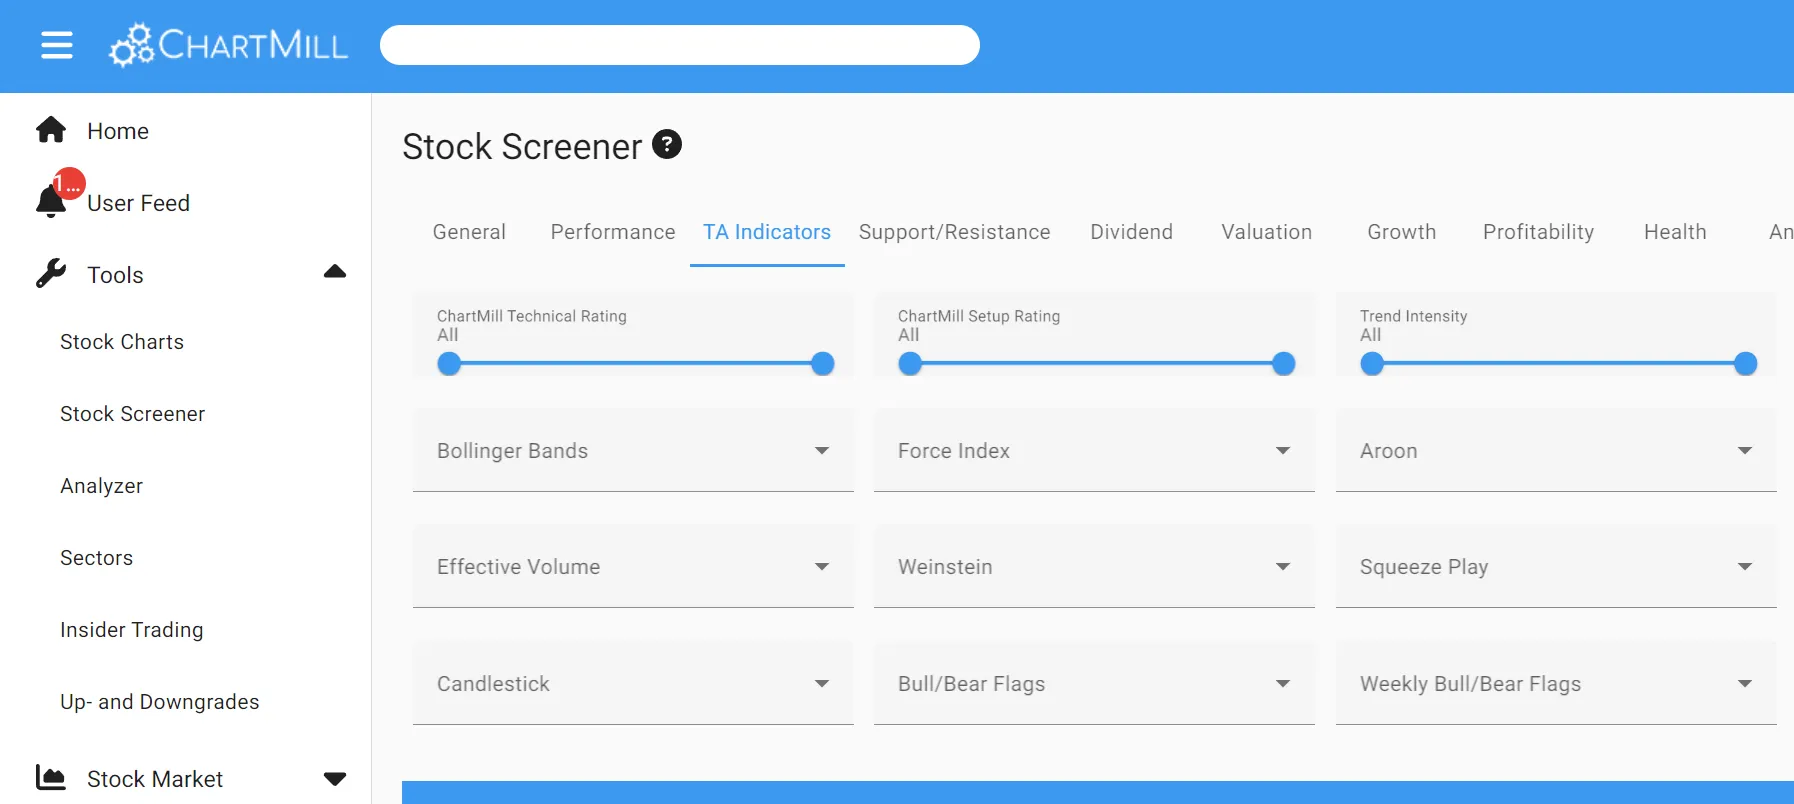
Multiple filters are available.
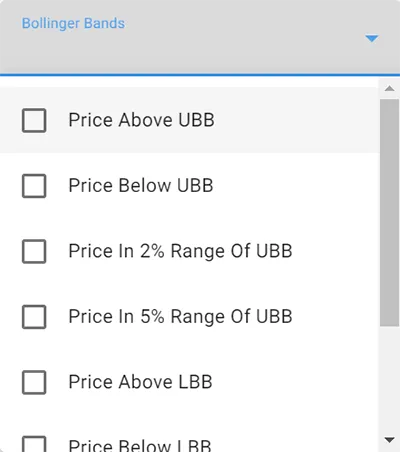
For example, you can specify that the most recent closing price should be above the upper Bollinger Band or below the lower bollinger band.
Or you can search specifically for stocks that are a maximum of 2 or 5% away from one of the two Bollinger Bands.
These are default values that can be deviated from by using custom filters.
In this article you can read more about the different filter options for the Bollinger Bands.
FAQ
Do Bollinger Bands Work For Day Trading?
Yes, Bollinger Bands can be used effectively in Day Trading. They visualize the level of volatility, which plays a major role in identifying setups for the short term. In this regard, particular attention will be paid to the squeeze signal whereby, initially, volatility decreases and the outer bands move toward each other and narrow.
When price eventually breaks above or below the outer Bollinger Band again with high volume and lots of momentum, this is a potential entry signal for the typical day trader.
Can Bollinger Bands Be Used As A Stop-Loss?
Yes, The bands can be used - based on volatility in the market - as stop-loss levels. Short-term traders can choose to use the middle band as a stop-loss. For example, one can opt to sell a long position as soon as the close is lower than the middle band.
Those who prefer an even more defensive stop loss can decide to use the lower band as stop loss level (in case of an open long position). The position is then sold as soon as the close is below the lower band.
What Is The Best Indicator To Combine With Bollinger Bands?
Two of the most commonly used indicators are the RSI and the MACD.
The RSI measures the speed and magnitude of price changes and shows whether a stock is overbought or oversold. When this coincides with a price approaching or crossing the upper or lower Bollinger Band, the RSI thereby provides additional confirmation of a potential sell or buy signal.
On the other hand, there is the MACD, a trend following momentum indicator. You can also combine this indicator with the Bollinger Bands to confirm the trend. A price that is simultaneously above the middle Bollinger Band and above the MACD signal line is a strong sign that the trend is upward.
How Do You Predict a Bollinger Band Squeeze?
A Bollinger Band Squeeze occurs after a period of low volatility. To recognize this squeeze, it is important to pay close attention to the outer bands. Specifically, on the distance between the outer bands that becomes narrower as volatility decreases.
Once you recognize that squeeze, you can continue to follow the stock and wait for a breakout to occur with increasing volume and momentum.
You May Also Be Interested In:
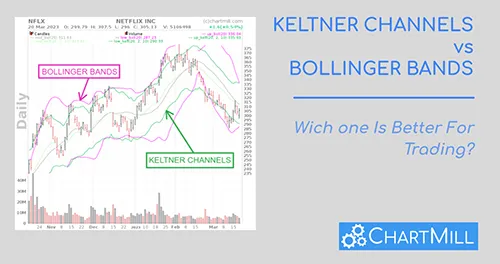
Keltner Channels vs Bollinger Bands: Which One Is Better For Trading?
Price Channels such as the Bollinger Bands and Keltner Channels are popular among active traders and investors because they provide valuable insights into the price trend and related momentum. Both indicators can be used to find specific entry points. Read more...
Bollinger Bands Screener
In this article we will go over the available filters in our stock screener for the Bollinger Bands Indicator. Read more...
What are Bollinger Bands and how to use this indicator? (video)