When To Enter A Breakout Trade? 4 Different Ways To Master The Entry
Trading breakouts is an efficient way to jump on board when a new major trend emerges. The best breakouts occur when the price breaks out above a very clear price resistance level that is watched by a lot of market participants. Chances are that the market momentum increases sharply and more buyers become interested. This pushes the price further upward.
However, catching those breakouts is not as easy as it seems. In this article, I discuss four different ways to enter a breakout trade, each with its advantages and disadvantages.
Choose the option that best suits your trading style to increase your chances of success!
How To Enter A Breakout Stock?
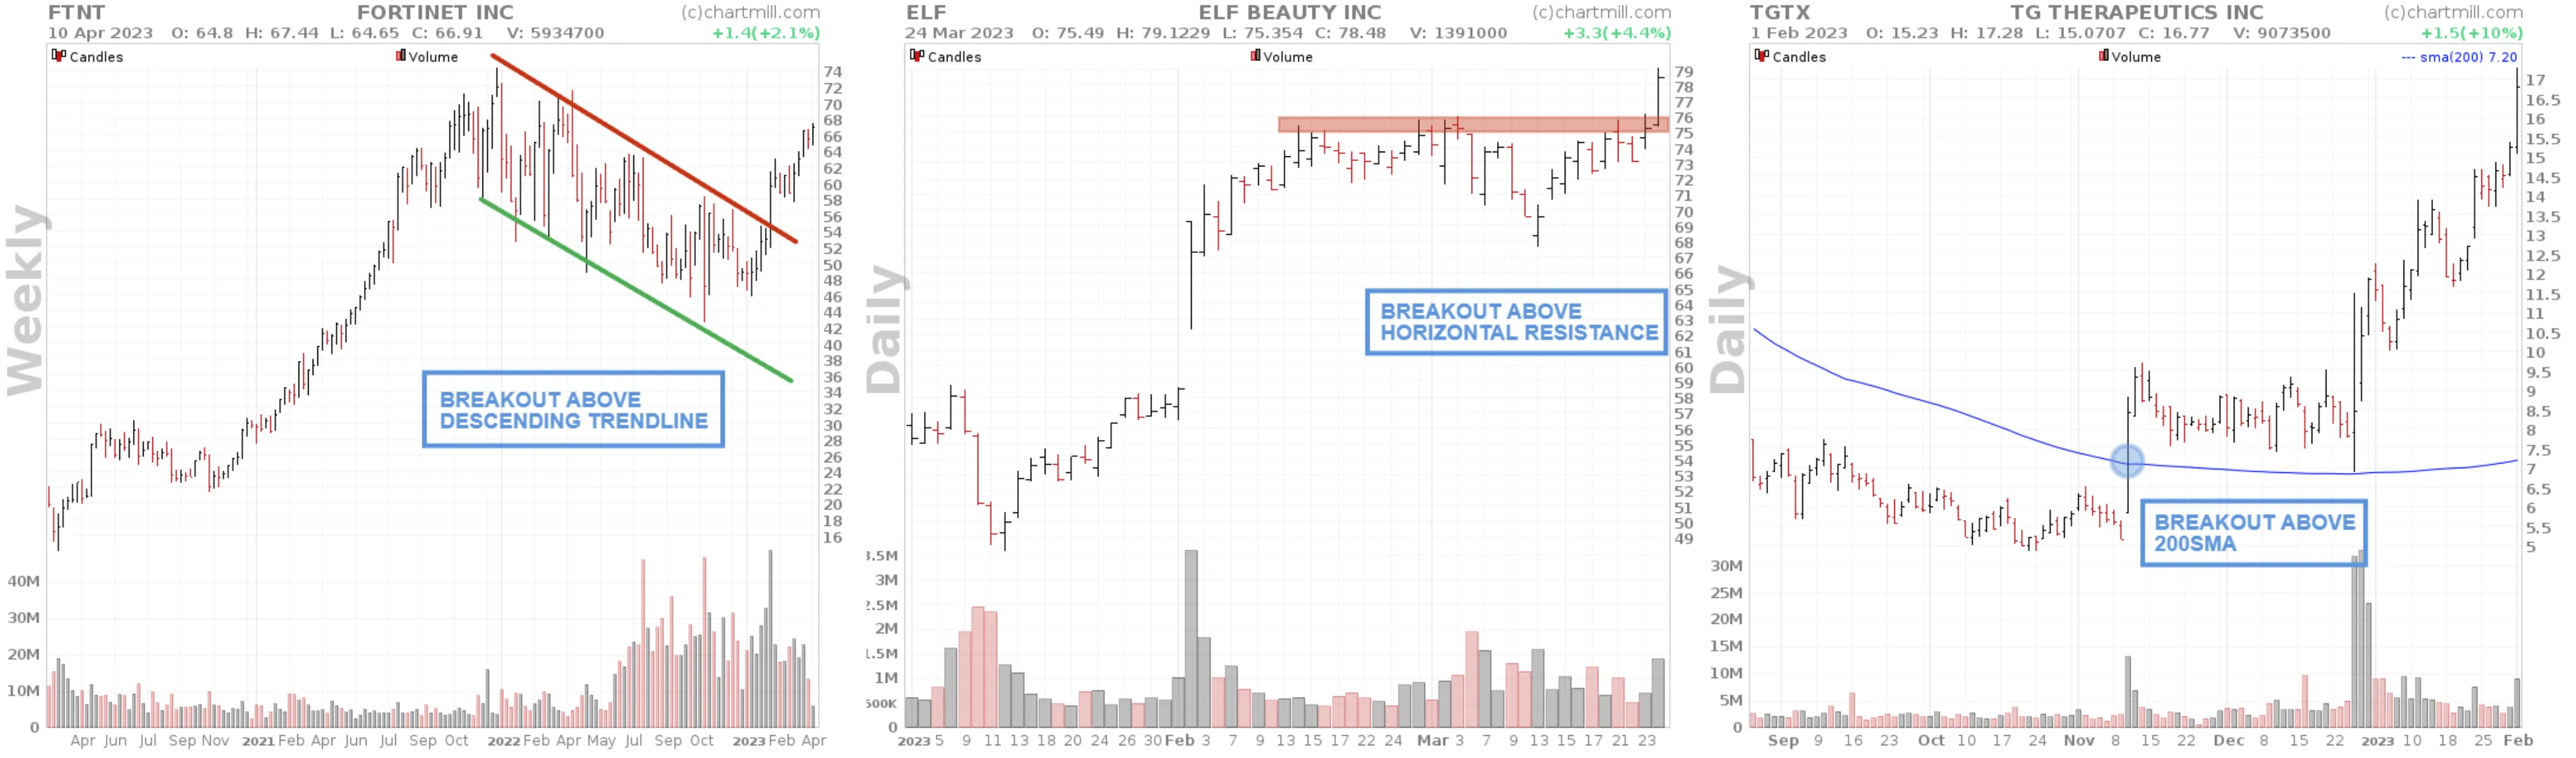
Identify the breakout level
Traders should first identify the key price level or technical indicator that the stock has broken through. This could be a trendline, a moving average, or a resistance level.
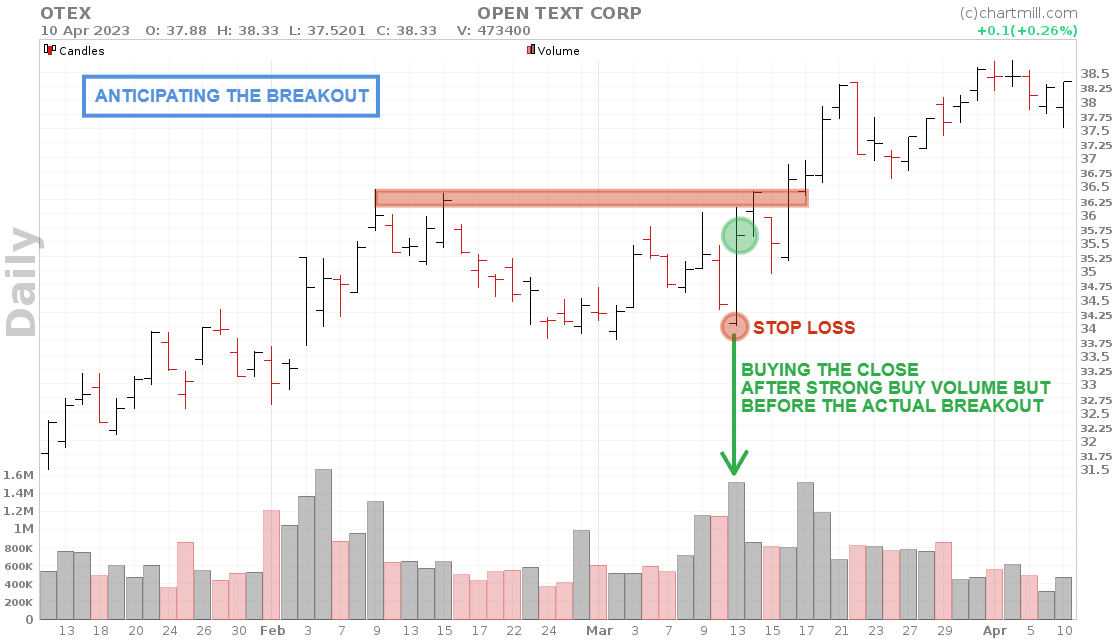
Option 1 - Buying Before The Breakout
It is perfectly possible to buy a stock before the actual breakout, also known as anticipating the breakout. However, there is no doubt that this way is much riskier than the various options discussed below.
If you do decide to go this way, make sure that you only pick stocks that show strong momentum and where buying volume has already increased before the actual breakout.
The main advantage of this approach is that if the breakout takes place, you will be in profit very quickly, precisely because you have anticipated the breakout. However, there is a chance that the breakout may not eventually occur or that the breakout may fail.
Traders using this strategy will usually do so with an initial small test position and then buy a second time during or after the effective breakout to build multiple positions.
Entry and Stoploss
The stock is bought while the price is still in the sideways consolidation phase. The initial stop loss is usually below the sideways trading channel.
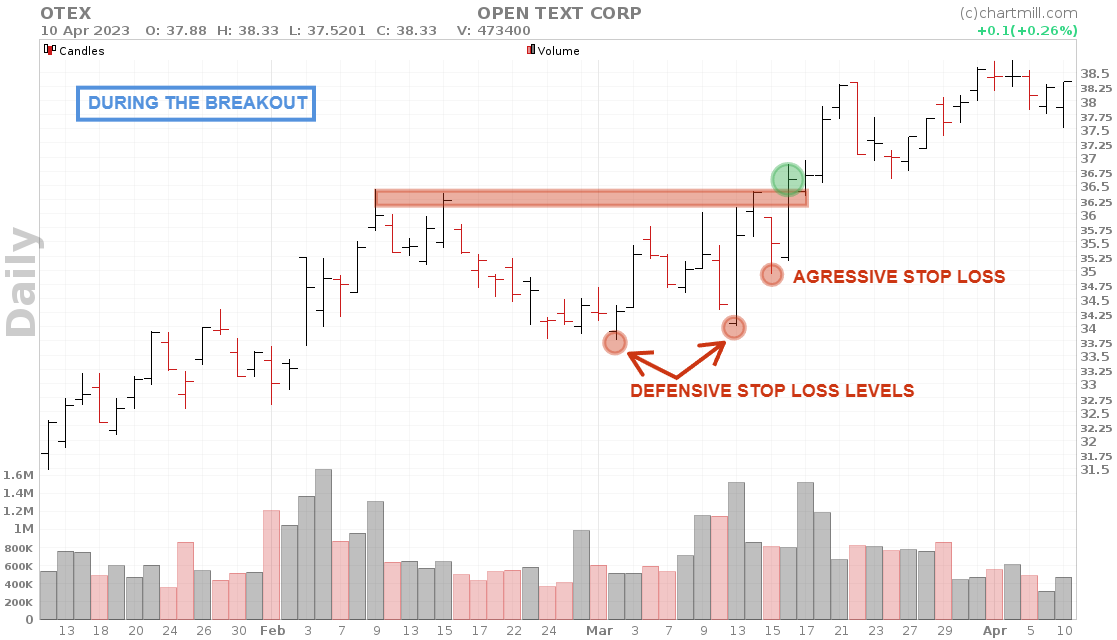
Option 2 - Buying During The Breakout
Buying at the time of the breakout guarantees that there is indeed an effective breakout. For this option, too, it is best to keep an eye on momentum and volume. More momentum and higher volume are early signals that buyers are interested. This increases the chances of a successful breakout a lot more than if you try to anticipate a breakout.
As with option 1, buying during a strong breakout offers a chance for quick profits.
However, there is still the chance that we are facing a false breakout. On a daily chart, this occurs when the price breaks out during the trading session but where the closing price at the end of the day ends up being lower than the breakout level.
In that case, the trader will have to decide to either stay in the market (assuming the breakout will eventually happen) or liquidate the position immediately and wait for the price to make another attempt.
Entry and Stoploss
The stock is bought as soon as the price rises above the identified breakout level. The stop loss can be placed either below the penultimate candle (aggressive) or just below the sideways trading range (defensive).
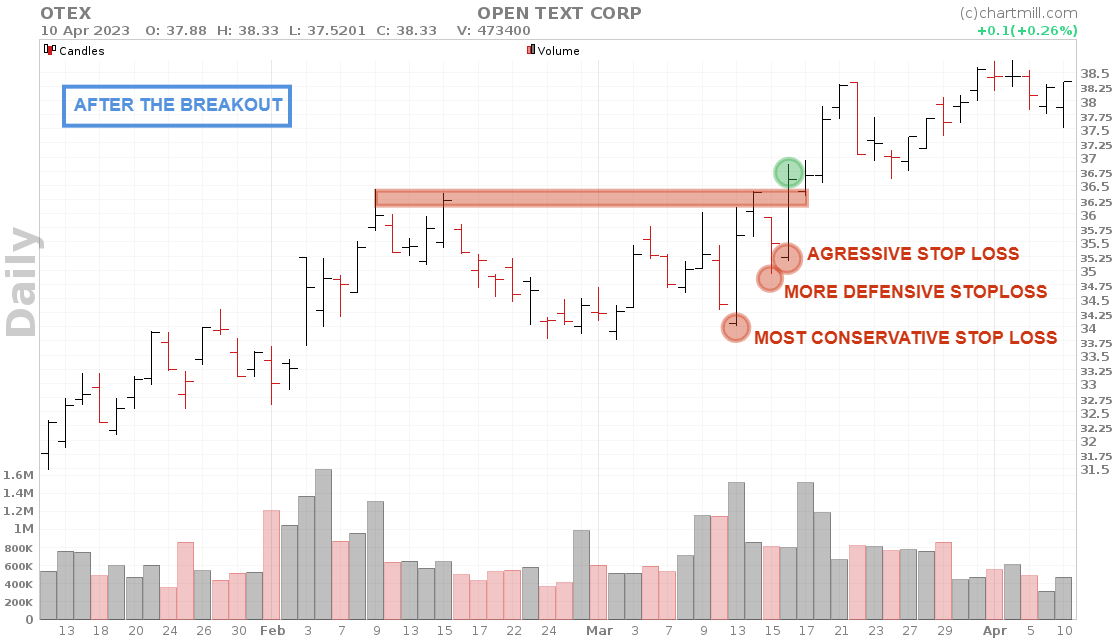
Option 3 - Buying After The Breakout
Option 3 is more defensive but has the advantage of offering more certainty. Not only did the breakout occur, but it was also confirmed because the final closing price at the end of the trading day is higher than the breakout level. Thus, this eliminates the possibility of a false intraday breakout.
A major disadvantage of waiting for a confirmed breakout is that you miss out on a significant portion of the price appreciation. Breakouts of 10%, 15%, or even more occur regularly. Not all traders feel comfortable getting in after the price has risen so much.
Moreover, there is still a chance that the next trading day the price will fall again, back below the breakout level. So the chance of a failed breakout still exists, just not on the day of the breakout itself.
Entry and Stoploss
The stock is bought as soon as the price closes above the identified resistance level. The closing price depends on the chosen timeframe. In this scenario, the stop loss can be placed directly below the breakout candle (aggressive) or a bit lower to give the price some more room to move and not be stopped out too quickly (defensive).
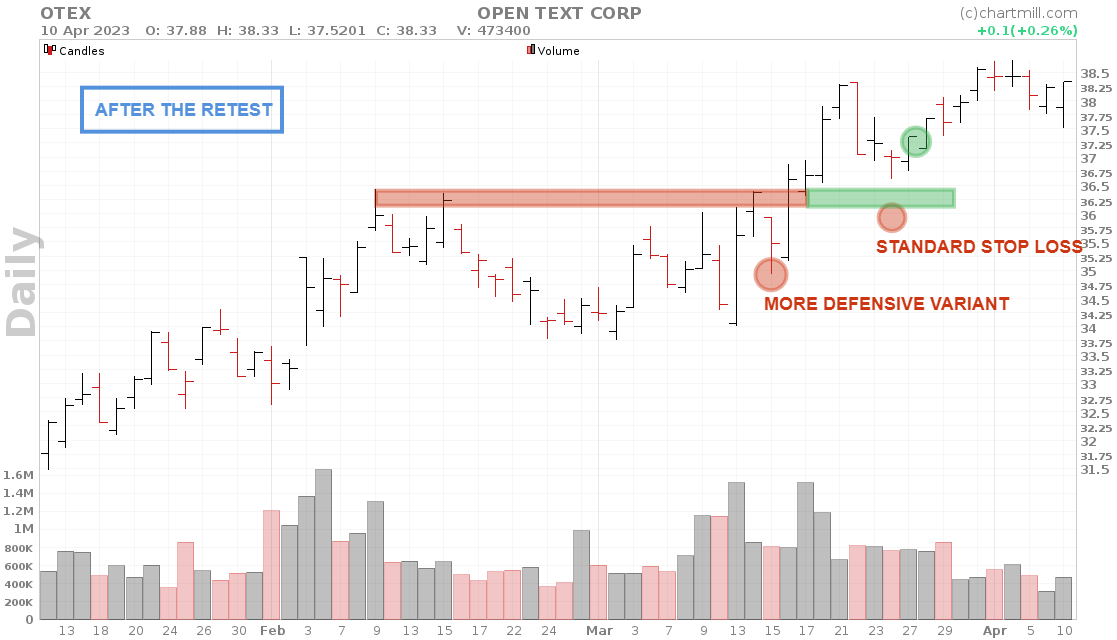
Option 4 - Buying The Retest Of The Breakout
The last approach is the most conservative. First and foremost, as with option 3, a confirmed breakout should occur. Then, one waits for a retest of the breakout level before entering.
A successful retest is an additional confirmation signal after the initial breakout. This way of trading requires a lot of patience from the trader, who must be able to resist the temptation to enter earlier. Whoever uses this method will have to accept that many break-outs will be missed if no retest occurs after the break-out and the price immediately continues to rise.
Some traders use the retest method to extend their initial (test) position into a full position. The way the retest occurs is of great importance in that case. The price drop that causes the price to reach the initial breakout level again should occur in a controlled manner and the sell volume should be low compared to the previous buy volume.
Entry and Stoploss
The stock is bought after the price has tested the initial breakout level. The stock is bought as soon as the initial breakout level is tested and a reversal signal occurs. A short stop loss just below the breakout level is standard. However, you can also opt for a more defensive variant in which the penultimate swing low is used as a stop loss.
How To Exit A Successful Breakout?
Properly managing an open long position after a successful breakout is at least as important to become structurally profitable in the long run. Depending on your trading style, there are several ways to do this.
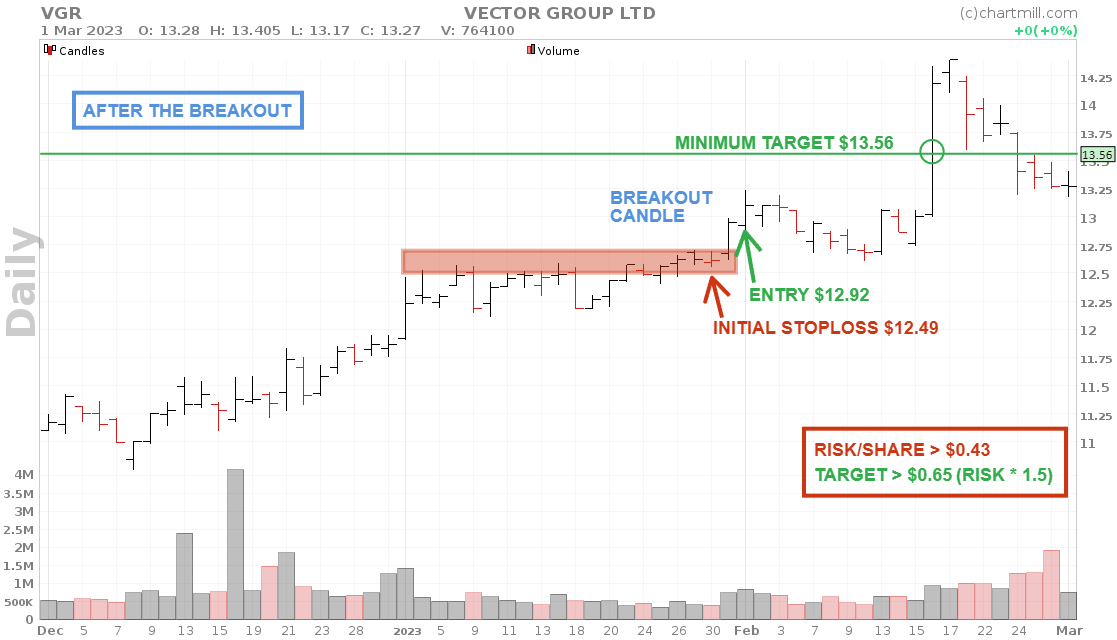
Setting a price target
The target is set at the same time as the entry and stop loss. Try to make sure that your target is at least 1.5 times larger than your initial stop loss.
For example, buying a stock at $12.92 with a stop loss at $12.49 gives a risk of $0.43 per share. Thus, if we want to keep the price target at least 1.5 times bigger than the risk, we need to realize a profit of at least $0.65 ($0.43*1.5). In that case, the minimum price target should be set at $13.56.
Now suppose that half of your trades are stopped out and the other half meets your target then this exit strategy still yields a profit.
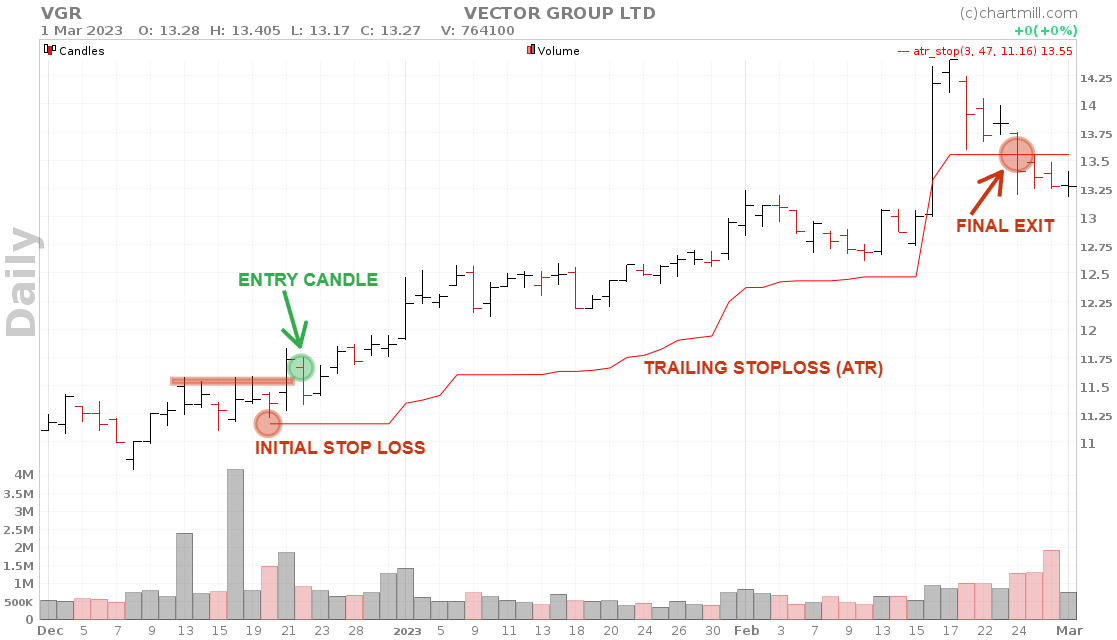
Using a trailing stop loss
This type of stop loss ensures that a portion of the accumulated profit is protected in the event of a price decline. However, as long as the price rises, the trailing stop loss will rise with it and protect an even larger portion of profits.
Want to know more? In this video, I show two different types of trailing stop losses with which you can catch a large part of the trend.
Using Technical Indicators
Numerous technical indicators can provide insight into how the price is moving and whether the momentum of an existing trend is strengthening or just losing steam. Below I discuss a few popular indicators that can help in this regard.
The RSI indicator
This is a momentum oscillator that measures the speed and change of price movements. The indicator defaults to an upper value of 70. A value higher than this is considered an overbought situation.
Traders should take into account a possible trend change (short- or long-term). Especially divergences between the RSI indicator and the price should be monitored to detect a price change at an early stage.
The MACD indicator
This is a trend following momentum indicator which consists of a MACD line and a signal line. A crossing of the MACD line below the signal line can be used as an exit signal for an existing long position.
Bollinger Bands
Bollinger bands monitor the degree of movement or volatility of a stock. Standard deviations of a moving average are used to define an upper and lower limit in which the price usually moves. If the price exceeds the upper limit (Upper Bollinger Band), this may indicate an excessive price reaction and be a trigger for a price drop. Open long positions can be closed on this basis.
Be careful when using technical indicators as exit signals. During strong trend movements, they will generate a lot of false signals resulting in the price going considerably higher causing you to miss out on a lot of profits in the long run.
It is better to use indicators as warning signals. Instead of immediately closing the position you can use the exit signals to manually move the stop loss a bit closer to the price.
If the exit signal is correct you will eventually be stopped out (with a large part of the profit in your pocket). However, if the price continues to rise, you will continue to profit from the rising trend.
How To Exit A Failed Breakout?
As with profit positions, it is critical to managing loss positions properly as well. The only way this can be done quickly and effectively is by using hard-stop losses.
When using a breakout strategy one speculates on a continuation of the trend after a breakout has occurred. If the breakout does not continue and the price drops again, the stop loss will ensure that the loss is limited.
Earlier we mentioned for each option where approximately the initial stop loss can be placed. Two things we would like to touch on in this regard.
- Keep an eye on important support levels and use them to strategically set your stop loss by setting them just below such support levels. If an earlier support level fails to bring the price back up, it is a strong sign that the price can go even lower. The stop loss will protect you from a larger price drop.
- Don't put your stop loss too close to the current price. In that case, the stop loss will be hit too soon. In many cases, you will notice that shortly afterward the position will move in the desired direction. And that can lead to a lot of frustration!
To determine a minimum distance for your stop loss you can use, for example, the ATR indicator. More on that in our article on the Average True Range Indicator.
Spotting Breakout Trades Before They Skyrocket
Manually plowing through charts, searching for breakout candidates is very time-consuming and chances are you are left with lesser candidates because you just don't feel like looking any further.
Fortunately, this can be done a lot faster and better by using a good stock screener such as ChartMill. Finding stocks that are about to break out or where the breakout has just occurred is a piece of cake for our stock screener. In this article, you will read exactly how to do that.
Key Takeaways
- Trading based on price breakouts is an excellent way to take full advantage of new major market trends.
- After identifying the breakout you should always keep an eye on momentum and volume before deciding to open a trade.
- The four options to enter a breakout trade include ‘buying before the breakout’, ‘buying during the breakout’, ‘buying after the breakout’ and ‘buying at the retest of the breakout level’. Each option has its advantages and disadvantages.
- Choosing the option that best suits your personal trading style gives you the best chance of success.
- Risk management plays an equally large role in long-term success. A sound exit strategy to protect profits or limit losses is crucial in this regard.
Frequently Asked Questions
Is Breakout Trading Profitable?
Yes, trading breakouts can be very profitable. Successfully identifying a breakout and getting in at the right time can lead to significant profits, but there is always the possibility of a false breakout or failure to move in the desired direction. Keep in mind that no strategy is capable of only generating profits without ever running into a losing position.
Being consistently profitable with a breakout strategy is therefore closely related to sound risk and position management. Exit strategies for both profitable and losing positions that ensure that profits are maximized and risks are mitigated are critical to this end.
What’s The Ideal Timeframe For Trading Breakouts?
Trading Breakouts can be done in different time frames. A breakout pattern can occur equally well on a 5-minute chart or a monthly chart.
The ideal timeframe for trading breakouts depends on several factors:
- your trading style and strategy
- The prevailing market sentiment and general market trend
- The volatility of the financial product in which you trade.
Short-term breakouts where both entry and follow-up occur within a time frame of a few hours to days will mainly be used by day and swing traders. They will primarily use intraday charts (5m, 15m, 1hr,...) to identify price zones where the price breaks through.
Long-term breakouts where the main objective is to get on board early on long-term trends extending over weeks or months are the favored playing field of position traders. They primarily look at the daily and weekly charts to determine where and when to enter the market.
How to avoid false breakouts in trading?
To avoid false breakouts as much as possible, you can do the following:
- Wait until the breakout is confirmed and the price has closed above the resistance level. By doing so, you will miss the actual breakout move but you will also be able to avoid a lot of false breakouts.
- Be attentive to additional confirmation elements that support the breakout. Strongly increased buying volume before and during the breakout is the most important parameter for this. Breakouts accompanied by only moderate volume are to be avoided.
- Observe the long-term trend. Concentrate on upward breakouts in stocks that already show a clear upward long-term trend.
- Consider the overall market trend and market sentiment. Breakouts work best when the broad market is bullish.
More on Breakout Trading...
The Breakout Trading Strategy
Breakout trading is undoubtedly one of the most popular forms of trading for those who are mainly active as day or swing traders. Read more...
How to Screen for Breakout Stocks: A Comprehensive Guide
In this article, by using the ChartMill stock screener, we demonstrate how to screen for stocks that have just broken out above a specific price point or are close to it. Read more...
The Opening Range Breakout Strategy: Unlocking Profit Potential and Market Momentum
In this article, we discuss what the strategy entails and exactly which steps are needed to be able to speak of an opening range breakout setup. Read more...
How to use ChartMill? Part 4 - A complete ChartMill workflow (video)
In this video, I'll go through my entire ChartMill workflow to obtain a list of stocks that have just broken out above their existing high and trading range. These are ideal Breakout Setups to trade.
Breakout trading is undoubtedly one of the most popular forms of trading for those who are mainly active as day or swing traders. Read more...