Peter Lynch Strategy

Peter Lynch Strategy Image
RUN IN STOCK SCREENER
(60)

The Peter Lynch Strategy is a long term investing strategy, combining growth and value: finding decent stocks which are able to grow to hold for the long term, while not overpaying.

Related Articles

Related Videos

A beginner's guide to growth investing: Reflections on "The little Book That Makes You Rich" by Louis Navellier.h

The Little Book That Makes You Rich is a beginners guide to investing in the stock market, with a focus on growth investing. The author, Louis Navellier, provides a framework for identifying and investing in high-growth companies, and offers insights on how to build a diversified portfolio. The book also includes information on market trends and strategies for managing risk. It is one of several books Navellier has written on investing and personal finance. ChartMill has translated the rules in the book into a trading idea that allows you to look for stocks that meet the selection criteria.

Finding High Growth Market Leaders | a CANSLIM Trading Idea by ChartMill

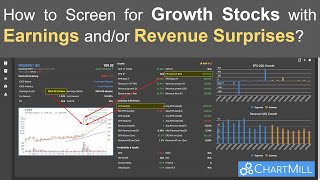
Finding High Growth Market Leaders is a popular strategy. However, spotting these specific stocks is not easy. In this video, I show you how to quickly and accurately create a basic first list of stocks to consider using the O'Neill CANSLIM Trading Idea by ChartMill. The parameters used come from the book "How to Make Money in Stocks: A Winning System in Good Times and Bad" by William O'Neil. The book was first published in 1988 and has been revised repeatedly since then. In the book, fundamental criteria are used to determine which stocks meet the requirements, technical criteria combined with a general analysis of market direction further determine when to buy the stock.

Stock Screener Settings

ROE>=15%

The Return on Equity should be at least 15%

Current Ratio>=1

The current ration should be at least 1

Average Volume: 50 SMA > 100K

making sure of a minimum liquidity,

EPS 5Y>=15% AND EPS 5Y<=30%

The EPS yearly CAGR growth over the last 5 years should be between 15 and 30

PEG (5Y)<=1

The PEG ratio should be below 1

Debt/Equity<=0.6

De debt to equity should not be above 0.6

Chart Settings

Default chart settings

Regional Run

Run this screen in your favorite region. You can always further fine tune the screen by changing the general settings after it opened in the screener.