The importance of Volume in trading and investing
In this article we will deal with the concept of 'volume' in trading and the way this indicator can give important indications when making buying or selling decisions. And although volume should be considered as a purely technical indicator, also for fundamental investors it is one of the few technical elements which are really worth taking into account and paying some attention to.
First of All, What is Trading Volume?
The volume on a chart represents the total number of shares that were traded during a certain period. That period depends on the timeframe the chart is set to. For example, a daily timeframe will show the volume of a full trading day while the same volume bar on an intraday hourly chart will only show the volume of one hour.
The presence of sufficient trading volume in a stock is important to ensure sufficient liquidity. After all, a large trading volume ensures that you can easily buy and sell the shares and that the spread between the buy and sell price is small. The latter ensures that the volatility remains manageable.
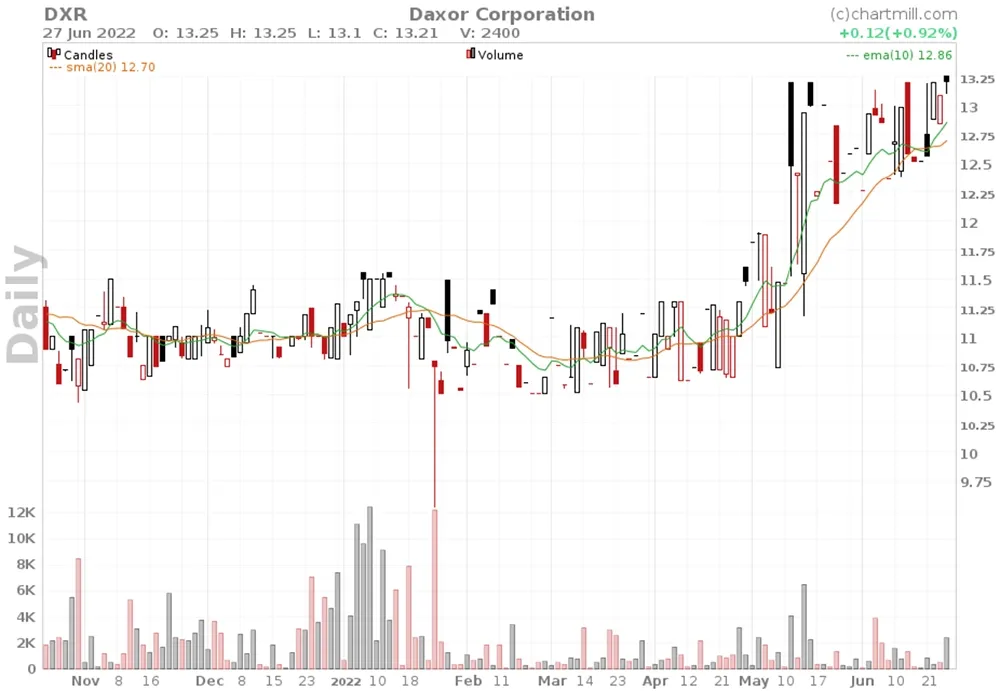
Too small a volume will cause you to see charts like this one....
What is Volume in Trading?
Volume is a technical indicator. When volume patterns are looked at in the past it gives us information about the strength with which specific rises or falls have occurred. This can be on individual stocks, but also, for example, on index ETF's that reflect the market situation as a whole.
The strength of volume is mainly used to estimate the value of specific price movements.
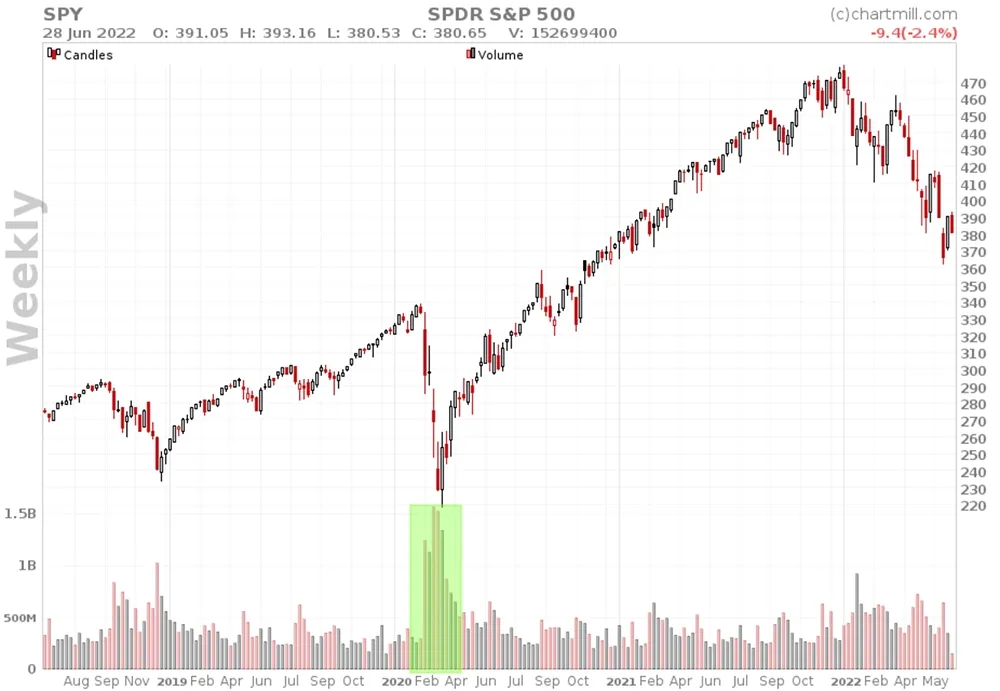
S&P500 Index ETF
How to Use Volume in Stock Trading?
The way volume is interpreted depends on the market situation. It can be used both as a confirmation signal of an existing (recent) trend but likewise volume can serve as an early warning signal that the existing trend is losing momentum and a trend reversal is imminent. In this case it is more of a reversal signal.
In this section we will examine the different options and how volume plays an important role in each of them:
Stock Volume Trends
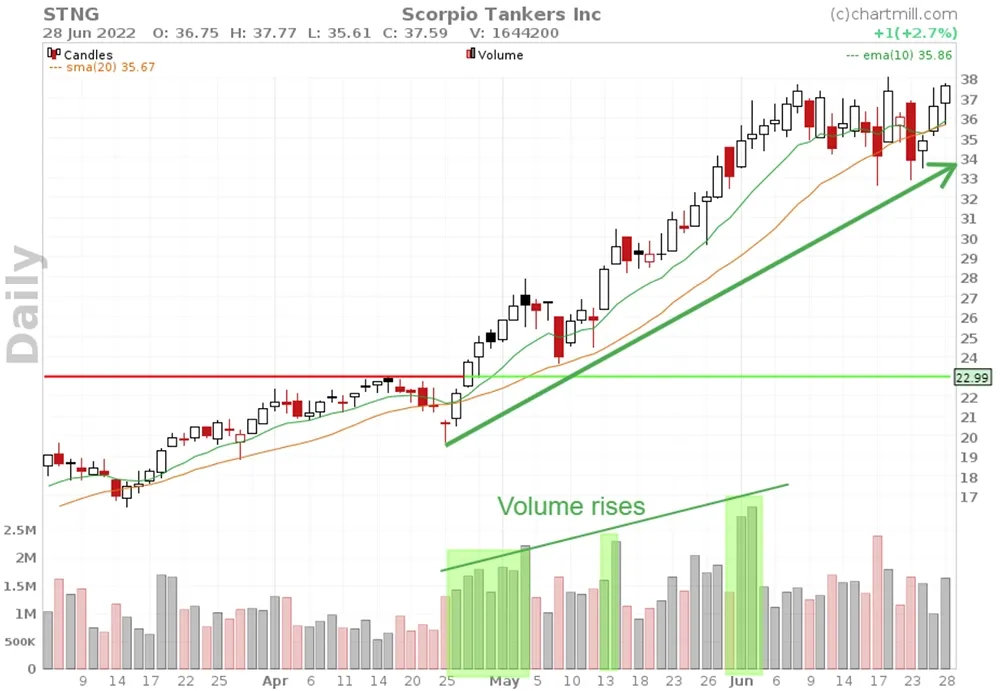
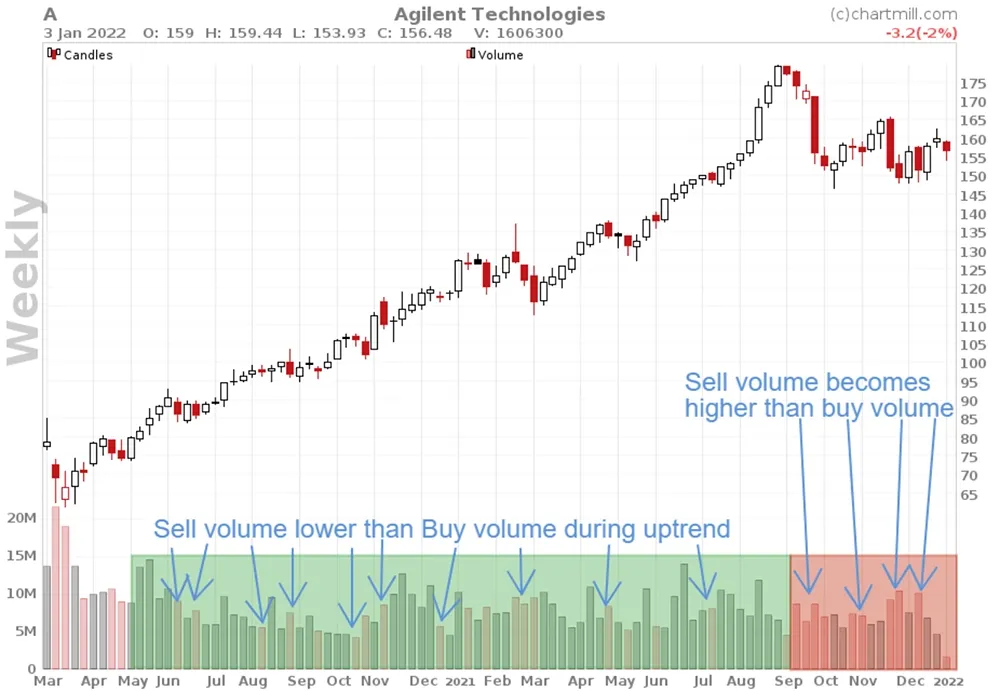
A rising trend must be supported by sufficient volume. After all, without sufficient buyers it will be impossible to push the price up further.
In a long-term rising trend you therefore want to see sufficient buyer volume when the price rises and the volume must be noticeably lower in case there are temporary minor price setbacks due to some of the buyers securing profits.
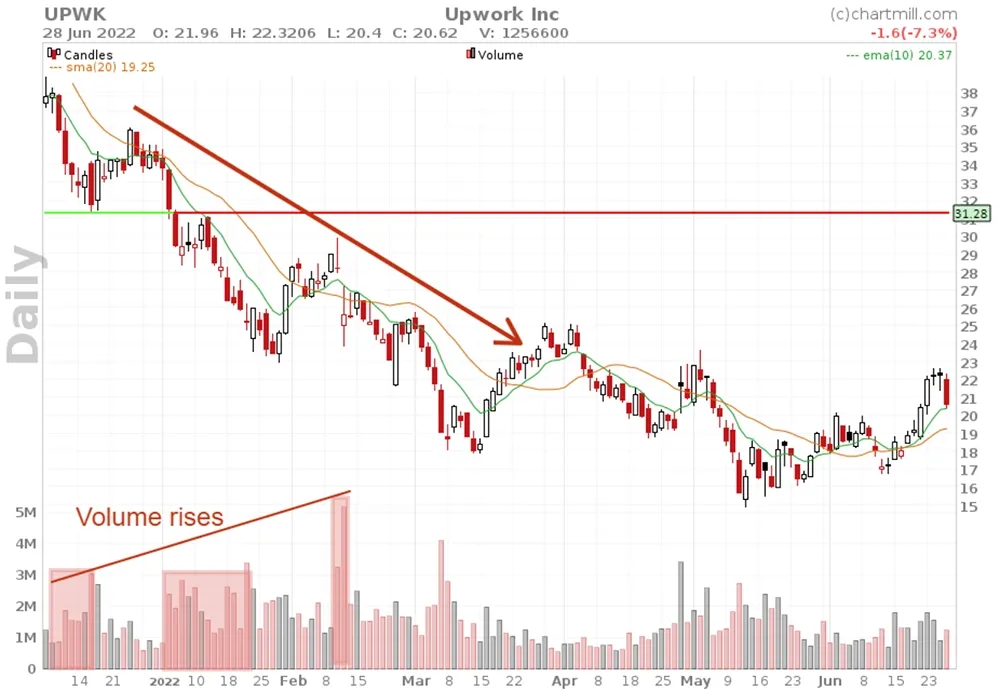
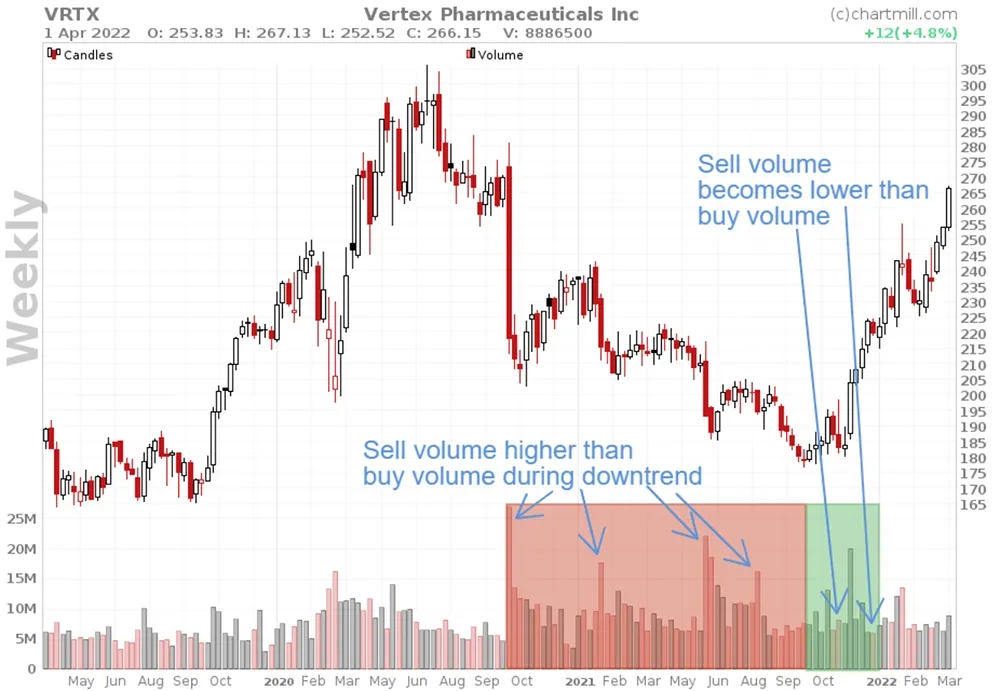
In a downward main trend the situation is just the opposite. There the seller's volume should be significantly present when the price is falling and the buying volume should be noticeably lower in case of an interim price recovery.
Breakout Stocks with High Volume
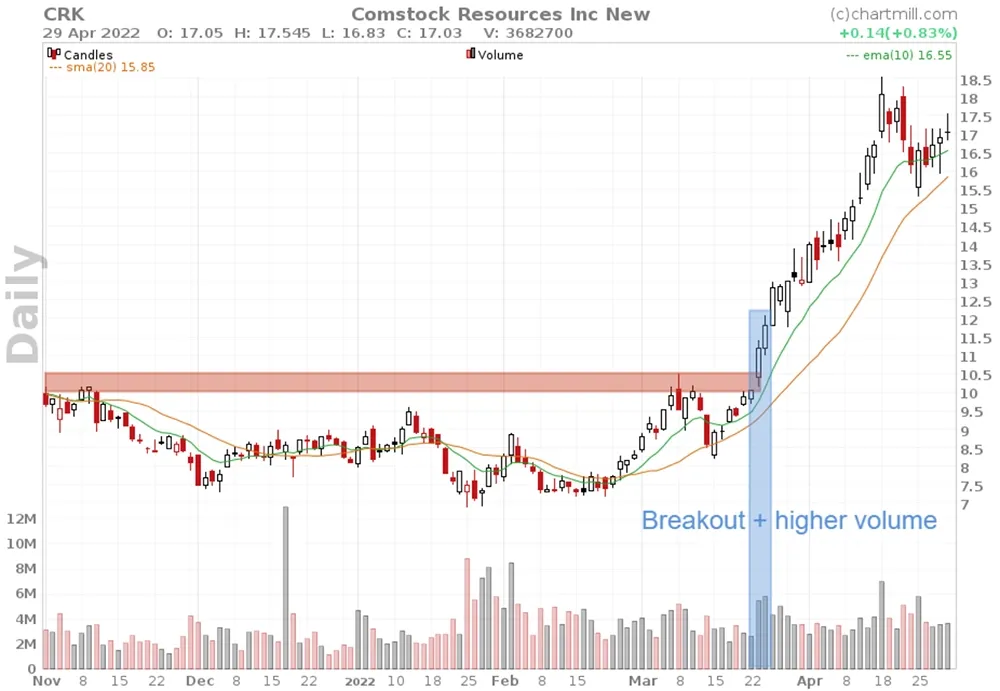
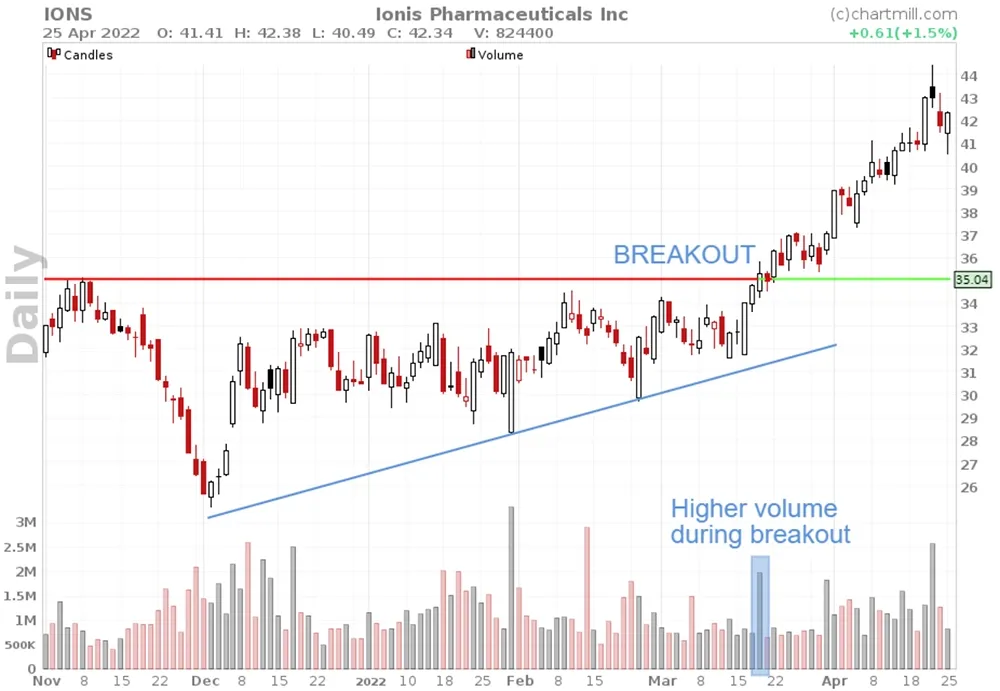
Volume plays a very important role when trading breakouts. An upward breakout above a previous resistance level should be supported by strongly rising volume which is a proof that the stock is being picked up by significantly more buyers.
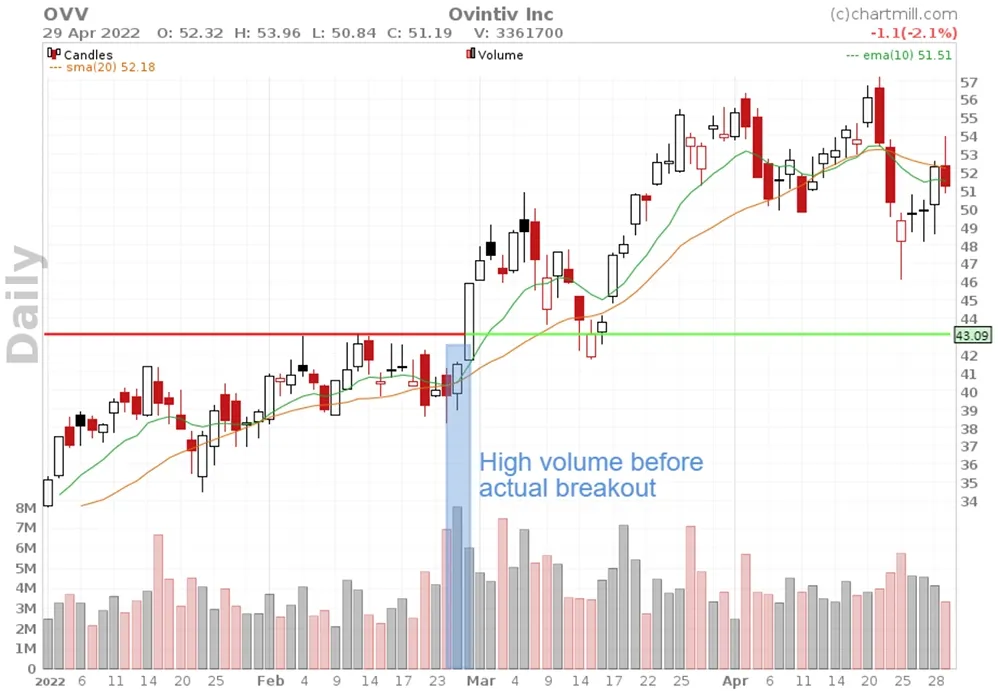
Even better is when the breakout is preceded by strong rising volume. After all, this means that the stock is being bought, just because it is assumed that the breakout movement will effectively occur.
A breakout or breakdown without clearly rising volume increases the chance that you are holding a false breakout. Trading breakouts and breakdowns without volume confirmation is the biggest mistake made mainly by investors with little or no experience.
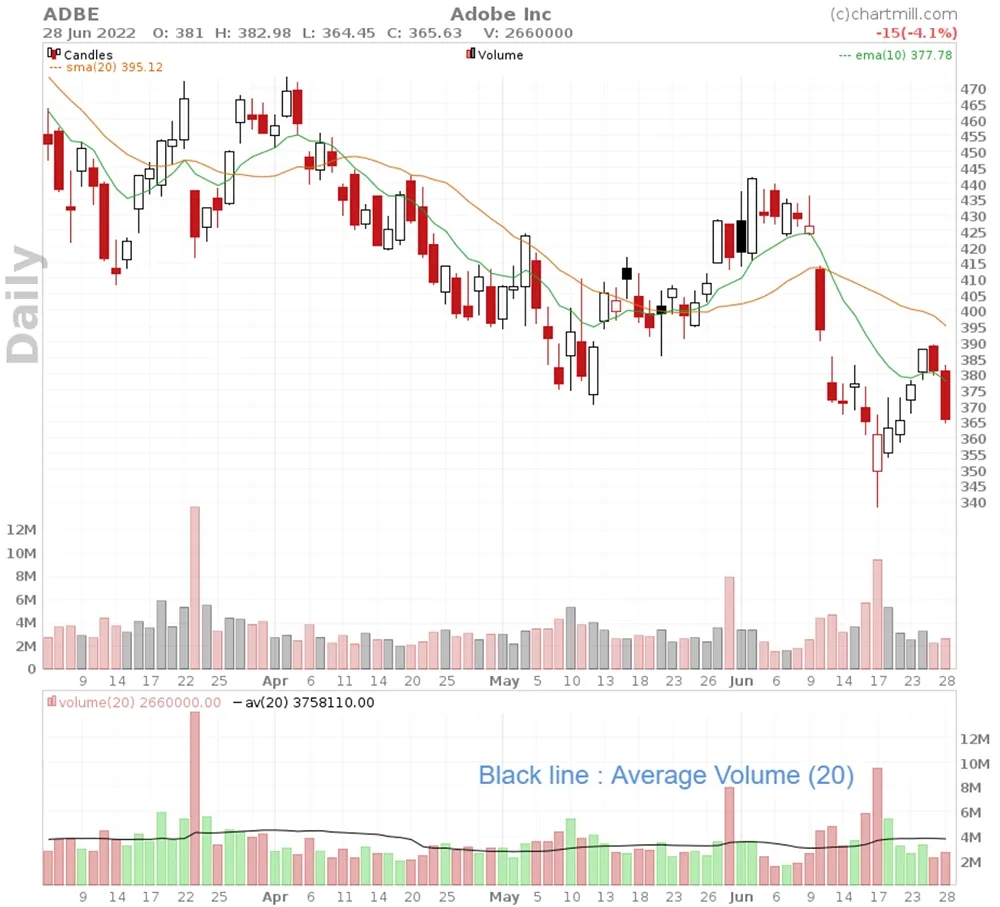
When talking about rising volume, you can interpret this in comparison with the previous day(s) but also in comparison with the average volume over a certain period. In ChartMill you can add average volume as a separate indicator. You can then set the period yourself, in the daily chart. Below I have set the average volume over a period of 20 trading days.
Low Volume Pullback
Price retracements are opposing movements in an existing main trend. Price movements are never linear even in very clear trends, therefore an ascending trend will always be a sequence of higher tops and higher bottoms.
However, you never know if a price drop in an ascending trend is just the beginning of a real trend change. Volume can then help put that movement into perspective. If the volume remains low during the decline, it is more likely that it is only an interim decline, especially if the price decline is fairly calm with moderate movements.
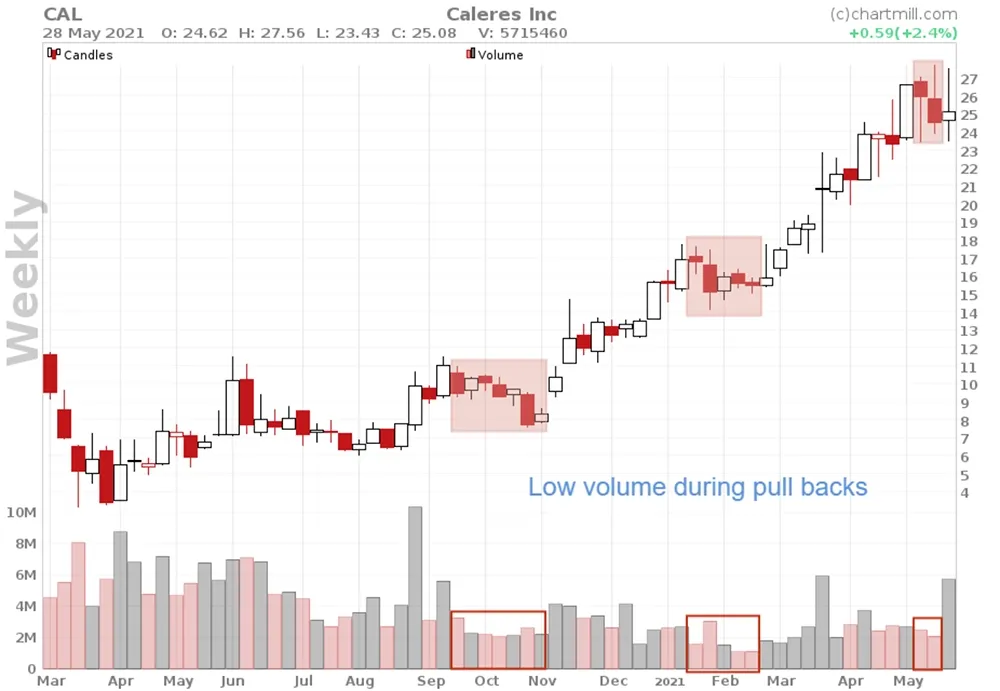
However, if the sell volume is significant higher than the previous buyer's volume then there is probably more to it. Often you will also notice that the price is moving in a much more volatile way. In that case it's time to cash in on the profits or to secure a part of it with a stoploss.
And the result so far…
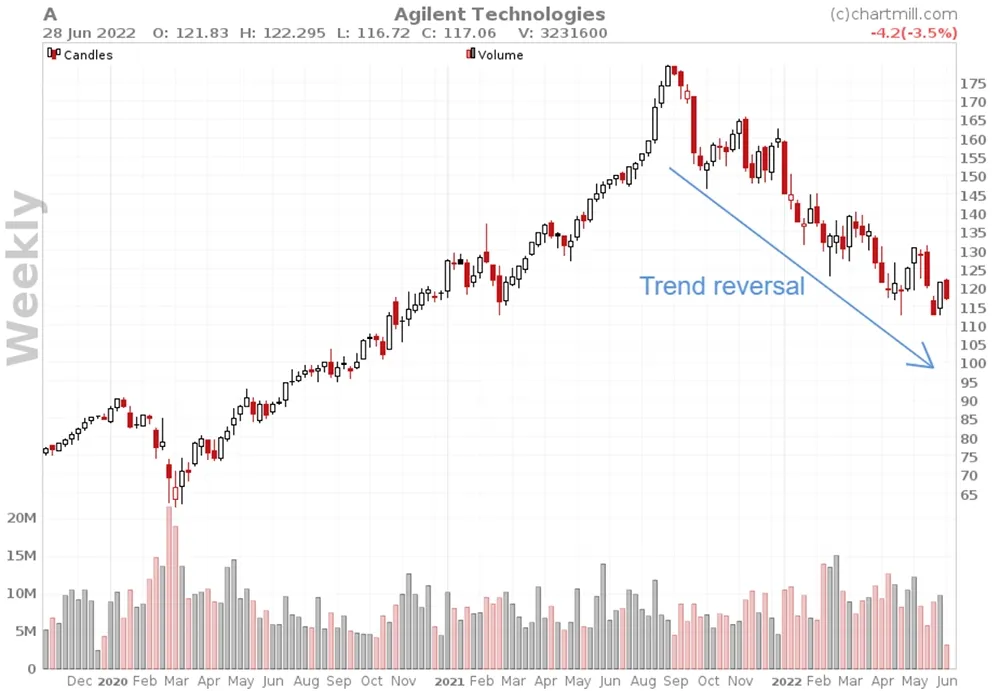
The same phenomenon can be observed in falling markets with intermediate price increases.
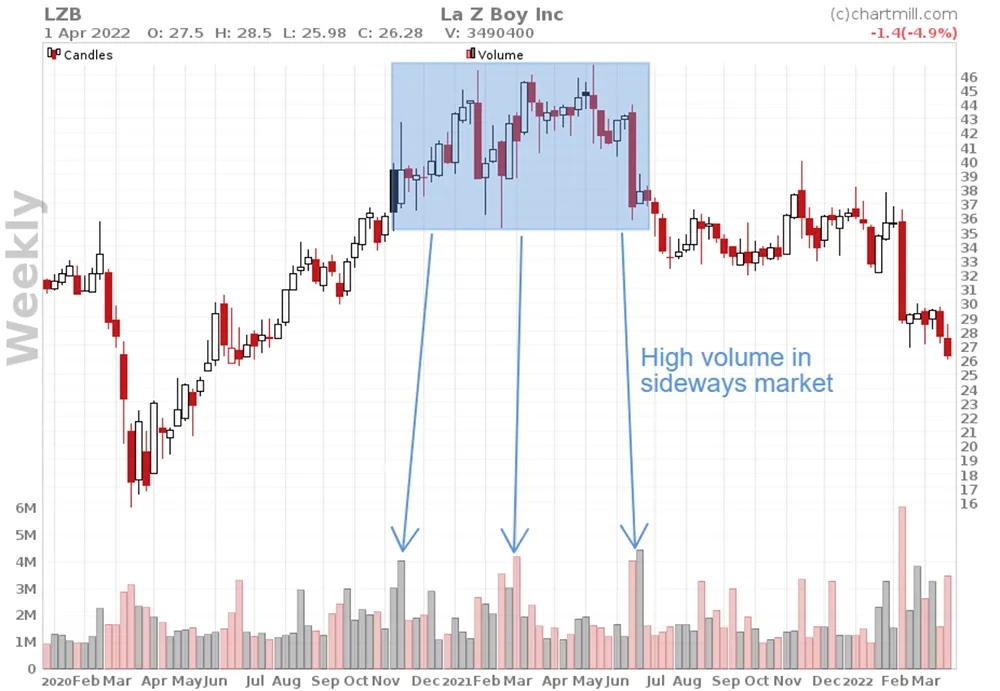
Volume during sideways movement
After a significant rise, in many cases a period follows in which prices tend to move sideways within a limited range. If this is accompanied by relatively high volume, it signals that distribution is taking place. This is the phenomenon whereby large numbers of shares change hands. This may be as a result of large (institutional) parties getting rid of their pieces. Partial selling ensures that the market is not flooded with sell orders which would cause the price to fall too quickly. Just to avoid that, large blocks of sales are gradually distributed over time.
Distribution only works well if there are still enough buyers who see the sideways movement as an ideal moment to enter the market or to expand existing positions. But it can be an indication that the long-term trend has ended. After all, one can ask why large parties are liquidating their positions.
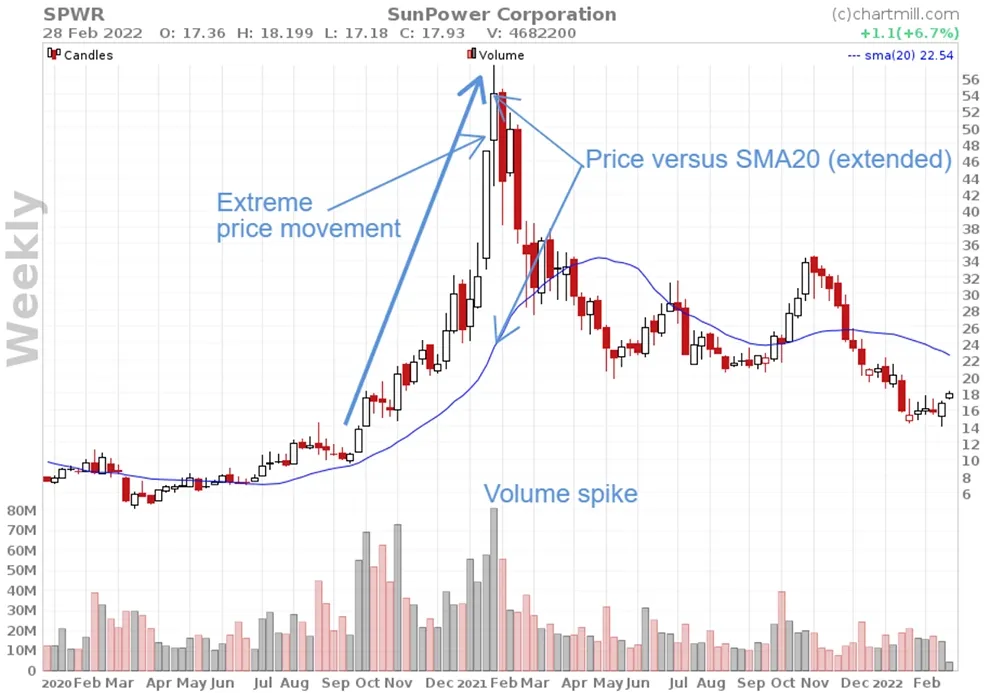
High volume at top or bottom prices (exhaustion moves)
Rising volume at the start and sufficiently high volume during a rising trend are necessary elements if the trend is to continue. However, you should be careful if there are sudden new volume spikes after strong upward price movements.
Beware, we are not talking about rising volume after an intermediate price drop or after a period in which the price moved sideways after an initial price increase.
A new sudden volume spike during a strong price movement can be a typical FOMO-movement, caused by traders who missed the surge and now want to jump on board because they fear they will miss the further "big upward movement". The problem, however, is that all those who have been in positions for quite some time may use this new strong rise to partially liquidate positions and secure profits. Such volume spikes cause price extremes in which there is a significant chance of a recovery movement (regression to the mean).
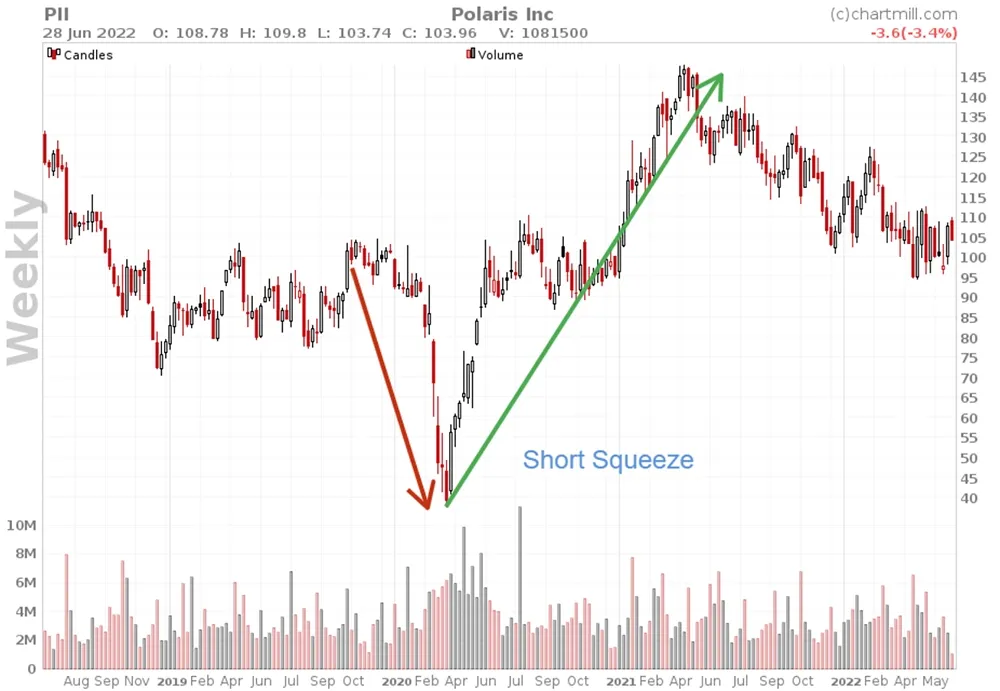
The same problem occurs in a strong downward trend. In this case shorters are speculating on a further downward movement after the price has already fallen sharply. When at the same time the earlier shorters close their positions and secure their accumulated profits you are faced with the typical short squeeze phenomenon...
Volume indicators
There are several technical indicators which are derived from volume. And while all of these indicators are merely a delayed representation of what the volume is showing on the chart, they can still be interesting to visually represent what volume is telling us. In this chapter I will briefly discuss two indicators that are available in the platform.
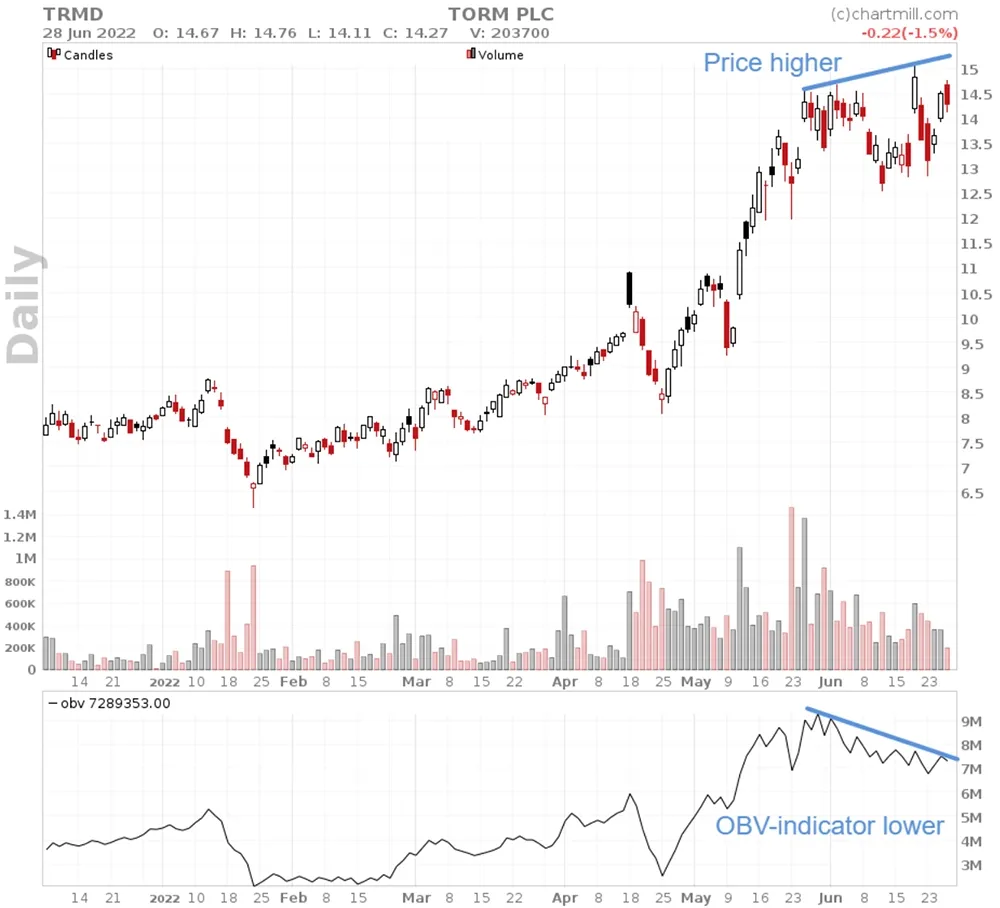
On Balance Volume Indicator
The OBV indicator is a momentum indicator and compares changes in price with the evolution of volume. This is useful for detecting divergences between volume and price.
The chart below shows exactly what we mean. While the price sets a new top we fail to see this in the progression of the OBV indicator. Higher tops in price, lower tops in the indicator. A sign of declining momentum and perhaps the harbinger of a further price decline.
More about the OBV indicator can be read in this article, there is also a video available.
Money Flow Index
This is also a momentum indicator that uses price and volume to identify overbought and oversold levels that can be used to assess price retracements or pull backs in an existing trend.
And as with the OBV indicator, this indicator can also spot divergences. More in depth info on this indicator is available in this article.
Volume in combination with other technical indicators
As with all other indicators, volume and volume indicators should never be used in a vacuum. While volume provides interesting information about price movement, it does not tell us everything.
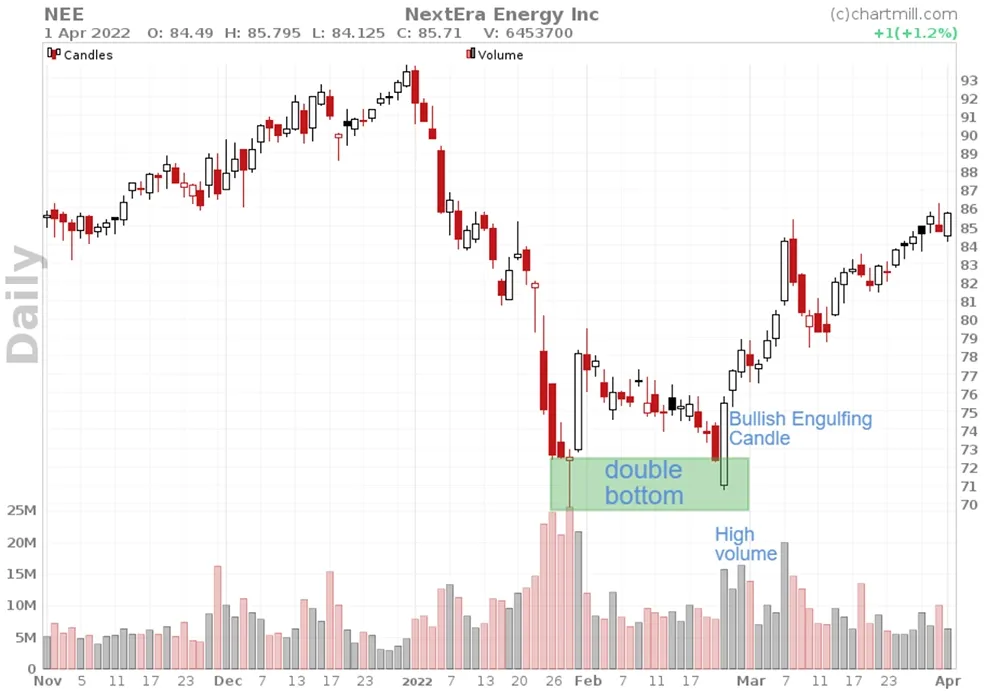
Typical volume trends can be confirmatory when looking at support and resistance levels (whether or not in combination with classic chart patterns). Also, the combination of volume and specific candlestick patterns can help in identifying trading setups that have a higher chance of success or in detecting reversal signals at an early stage so that accumulated profits are not completely lost.
Volume filter options in ChartMill
The basic volume filter in ChartMill is set via the general tab in the stock screener. This allows you to define what the minimum volume should be for the stocks you're looking for. The precise minimum average volume setting depends on the market. For the US I usually use 300,000 to 500,000 as a lower limit while for Europe it is more in the range of 100,000 to 300,000.
However, the most interesting filter in the screener is located on the Indicators tab where, via the "Volume Increase" option, you have a lot of possibilities to search for stocks whose volume has increased or decreased (substantially) compared to the previous trading day or compared to the average volume.
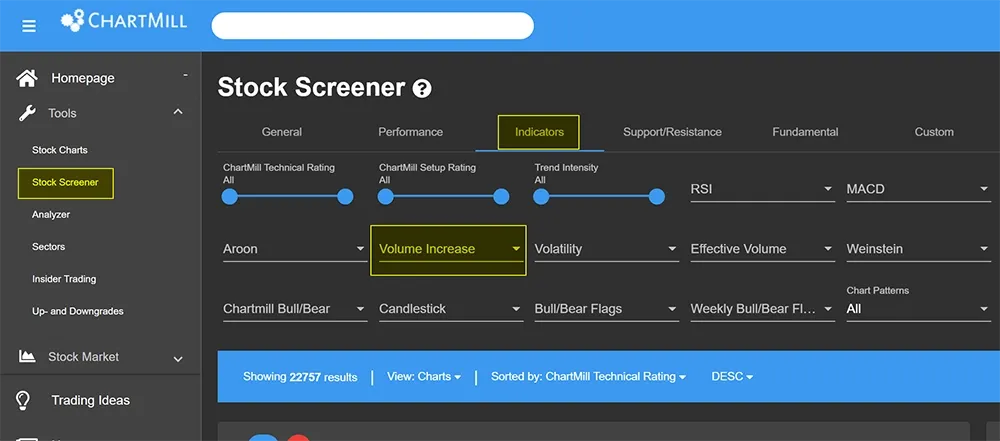
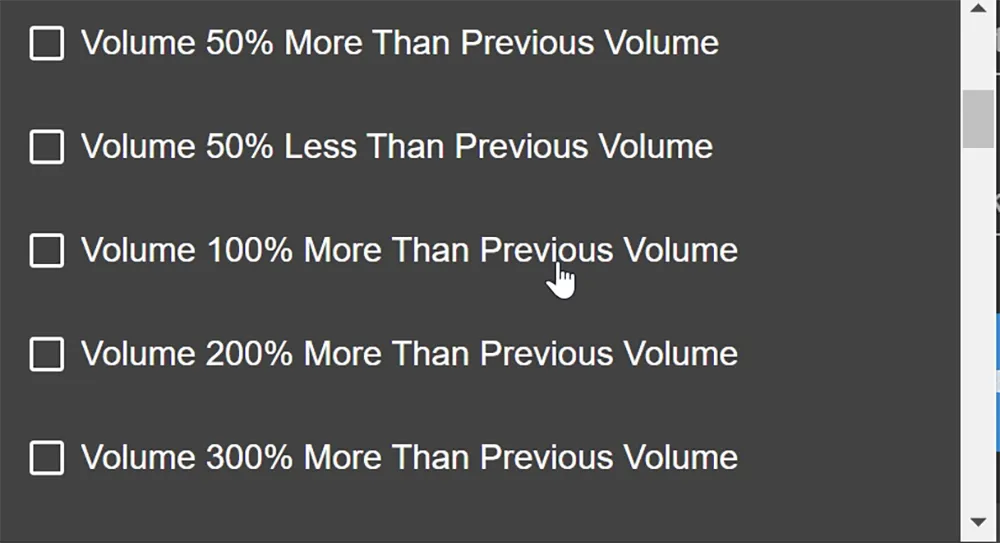
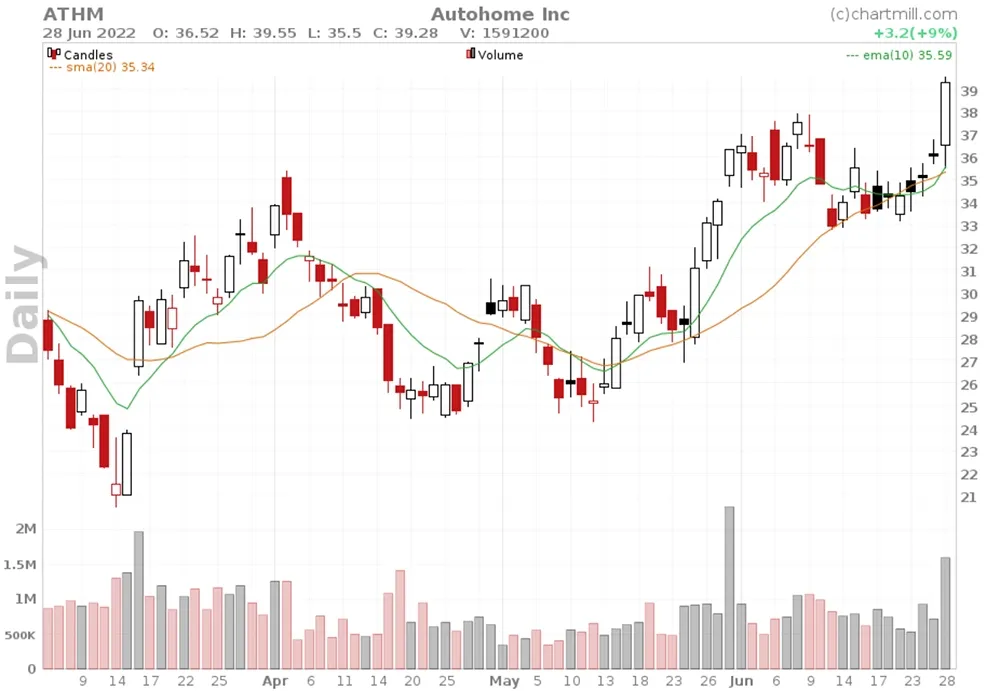
The 'volume increase' filter is ideal for finding breakout setups associated with strongly increasing volume. For example, this screen will look for stocks that break out above their 10-day high on higher volume. Below is an example of one of the screen results.
This video provides more info on a specific breakout screen that uses this specific volume filter.
Conclusion
- Volume is a very versatile but still too often underestimated indicator... However, it is the indicator which is closest to the price, which makes the information more accurate and reliable than for other indicators.
- Strong trading volume ensures that there is sufficient liquidity so that stocks can be easily bought or sold.
- Volume indicates the force with which a movement is occurring, you can use it to visualize the strength of a trend or better estimate the chances of success of typical breakout or retracement strategies.
- Volume indicators such as the OBV indicator and the Money Flow Index combine price and volume and display their information as momentum indicators. They are primarily used to identify divergences between price and volume.
- Our stock screener is equiped with specific volume filters which makes it very easy to detect high quality low risk breakout setups.