
Mark Minervini Strategy | Think and Trade Like a Champion Part 1 | Technical and Fundamental Filters

Mark Minervini is a well-known stock trader and teacher. His approach blends technical rules with fundamental checks. In this guide, you’ll learn how the Mark Minervini strategy works, why it focuses on risk first, and how to prepare your own screens before placing a trade.
We’ll also show how these ideas translate into simple filters you can use in ChartMill.
Who is Mark Minervini?
Mark Minervini is a professional trader who started young. He left school at 15 to focus on the stock market. He studied great traders like Jesse Livermore, Richard Love, and Stan Weinstein. Over time, Mark Minervini created a complete system that mixes charts and company data. The big lesson from Mark Minervini is clear: smart risk management drives long-term success.
He has shared his ideas in books and interviews, including Momentum Masters, Stock Market Wizards, and his own bestsellers. Many traders use Mark Minervini rules because they are clear, practical, and repeatable.
Key takeaways
-
Mark Minervini blends technical and fundamental analysis.
-
His method highlights risk control and position sizing.
-
The goal is to find strong stocks early and cut losers fast.
Two-Time U.S. Investing Champion (and Why Risk Matters)
In 1997, Mark Minervini won the U.S. Investing Championship with a 155% return using his own money. In 2021, he won again with an even larger 334% return. Big numbers can be a red flag if they come from wild risk. That’s not the case here. The Mark Minervini approach is strict about keeping losses small.
Many “gurus” post high returns by taking huge risks. That’s closer to gambling. Mark Minervini does the opposite. He focuses on:
-
Small losses via clear stop-loss rules
-
High-quality setups that match his criteria
-
Consistency over months and years
His results also challenge the “Efficient Market” idea that you cannot beat the market except by luck. The Mark Minervini track record shows skill, rules, and discipline can make a difference.
What We’ll Cover in Part 1
This part explains the Mark Minervini filters you apply before you buy:
-
The SEPA method (Specific Entry Point Analysis)
-
Trend, fundamentals, catalysts, and entry/exit points
-
The Trend Template rules and how to screen for them in ChartMill
(In Part 2, we’ll handle trade entries, stop-loss placement, position size, and taking profits.)
Understanding the Mark Minervini SEPA Ranking System
The Mark Minervini SEPA System stands for Specific Entry Point Analysis. It is the foundation of his entire trading method. Every lesson and rule he teaches connects back to SEPA.
The Mark Minervini strategy is built on three simple ideas:
-
Timing matters. There are good and bad times to buy stocks.
-
Predictability exists. Future winners often show clear clues before they explode.
-
Growth can be exponential. Trading the right stocks at the right time can turn small gains into large profits.
The SEPA approach helps traders find stocks that are about to move sharply higher. Mark Minervini created SEPA after decades of studying winning stocks and their patterns.
The Five Key Elements of the Mark Minervini SEPA Strategy
The Mark Minervini SEPA concept includes five main traits that define strong stocks:
-
Trend – Great stocks rise from an existing uptrend. A clear upward trend must be in place before the stock makes a major move.
-
Fundamentals – Leading stocks usually show big improvements in sales, profits, and margins. These gains often appear early in the price move.
-
Catalyst – There is almost always a trigger, such as a new product, better-than-expected earnings, or a positive outlook from management.
-
Entry Points – Mark Minervini looks for exact price points where the risk/reward balance is best. These points often appear when a stock breaks out of a strong base.
-
Exit Points – Rules for getting out are just as strict. Stops protect capital from losses, while planned profit-taking locks in gains before the move ends.
The Mark Minervini strategy uses these elements together. You look for stocks with strong growth, rising prices, and a clear catalyst. Then you wait for a low-risk entry point with solid upside potential.
Stage Analysis in the Mark Minervini Strategy
The Mark Minervini method also relies on Stage Analysis. Every stock moves through four stages:
Stage 1 – Consolidation: The stock trades sideways after a decline.
Stage 2 – Uptrend (Accumulation): The stock starts to climb and attracts more buyers.
Stage 3 – Distribution: The uptrend slows as selling increases.
Stage 4 – Decline (Capitulation): The price falls sharply.
Mark Minervini focuses on Stage 2, when the stock is already trending upward. That’s where most super-performers begin their biggest runs.
While Stage Analysis was first described by Stan Weinstein, Mark Minervini refined it within his SEPA system to help traders find the best risk-to-reward setups.
The Mark Minervini Trend Template Rules
The Mark Minervini Trend Template defines the exact technical conditions a stock must meet before it becomes a trading candidate. If a stock fails even one of these rules, Mark Minervini simply ignores it, no exceptions.
These rules make sure you only trade stocks that are already strong and trending upward.
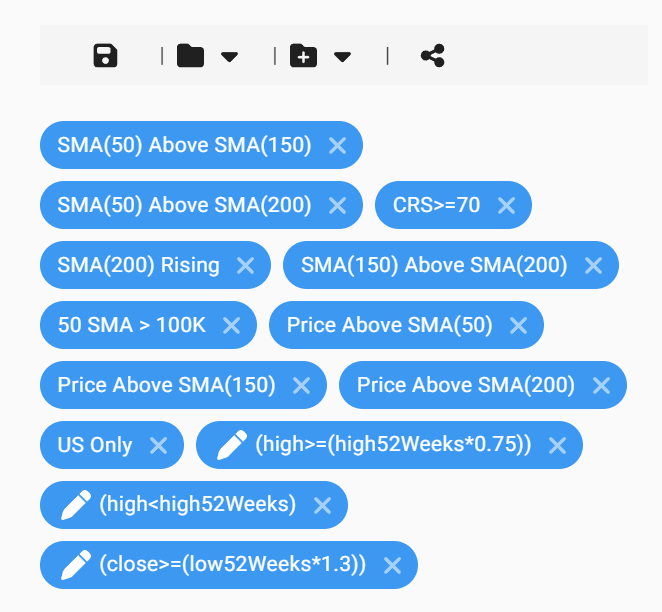
Moving Averages
For a valid Mark Minervini setup, the moving averages must align perfectly:
-
The current stock price must be above the 50-day, 150-day, and 200-day simple moving averages (SMA).
-
The 200-day SMA must be trending up for at least one month (four to five months is even better).
-
The 50-day SMA must be above both the 150-day and 200-day SMAs.
-
The 150-day SMA must also be above the 200-day SMA.
These conditions show that the stock is in a strong uptrend and that buyers are clearly in control.
52-Week High and Low Rules
Mark Minervini looks for stocks close to their highs, not the ones that are cheap or have fallen.
-
The current price should be at least 30% above its 52-week low. (Many top stocks are 100%, 200%, or even 300% above their lows before making new highs.)
-
The current price should also be within 25% of the 52-week high. The closer to a new high, the better.
These rules help you focus on strength, not weakness.
Relative Strength
-
The Mark Minervini strategy favors stocks with top relative strength, the leaders in their sector or market.
-
The Relative Strength (RS) ranking should be at least 70, and ideally above 80 or 90.
High-RS stocks show strong demand and are often the first to break out in bull markets.
Screening the Trend Template in ChartMill
You can easily apply these technical conditions in the ChartMill stock screener.
The Mark Minervini Trend Template Screener includes all key filters, except one, the rule that the 200-day average must rise for at least one month.
That’s because this trend can be checked visually on the chart. If you see a flat or falling 200-day line, you can quickly skip the stock.
Direct link to the Mark Minervini Trend Template Screener
This screener gives you a fast way to find stocks that already match the Mark Minervini technical blueprint, saving hours of manual chart study.
Example of a stock that meets all these requirements

Fundamentals That Drive Super-Performance
The Mark Minervini strategy is powerful because it doesn’t rely on charts alone. The real strength comes from combining technical analysis with fundamental analysis.
In his book 'Think and Trade Like a Champion', Mark Minervini explains that the biggest stock market winners almost always show strong earnings and sales growth before they make their biggest price moves.
The goal is to find companies that are already growing fast, not ones that might grow someday.
What to Look for in Fundamentals
According to Mark Minervini, top-performing stocks share these traits:
-
Strong and accelerating earnings growth
-
Rising revenue growth over several quarters
-
Positive earnings surprises that beat analyst expectations
-
Upward revisions in future earnings estimates
-
Improving profit margins over time
Minervini sums it up as:
“Big earnings attract big attention.”
When a company surprises analysts with much better-than-expected results, large investors notice. Their buying pressure often drives prices up fast — and that’s where Mark Minervini setups often appear.
Why Upward Revisions Matter
Mark Minervini also pays attention to earnings revisions.
When analysts raise their forecasts - often by 5% or more - it shows growing confidence in the company’s future.
Stocks with upward earnings revisions tend to outperform the market, especially when this trend is supported by rising sales and strong profit margins.
Improving margins matter, too. A company that can raise prices without losing customers shows pricing power, a key trait of long-term winners.
How to Apply Fundamentals in ChartMill
In a perfect world, every stock would meet all of Mark Minervini’s criteria. But in practice, that would leave almost no candidates.
That’s why Minervini suggests screening step-by-step, focusing on separate groups of fundamental filters and then spotting the companies that appear in multiple lists.
You can easily do this in ChartMill using fundamental filter combinations. Each screen below focuses on one or more core elements of the Mark Minervini strategy.
Screen 1: Yearly Earnings Growth and Acceleration
-
EPS Growth (3 years): at least 15%
-
EPS Acceleration: positive in the last fiscal year
-
(Optional) Next Year EPS Revision (3 months): at least +8%
These filters identify companies with consistently strong and improving earnings growth.
Link to Screen 1 - EPS Growth & Acceleration Yearly
Link to Screen 1 + EPS Revision
Screen 2: Quarterly Earnings Growth and Acceleration
-
EPS Growth (Quarter over Quarter): at least 25%
-
EPS Acceleration: in the last two quarters
-
(Optional) EPS surprise in at least 2 of the last 4 quarters
-
(Optional) Next Quarter EPS Revision: +4% or more
-
(Optional) Profit Margin improved over 2 quarters
These filters look for companies showing rapid short-term growth and strong momentum.
Link to Screen 2 - EPS Growth & Acceleration Quarterly
Link to Screen 2 + Earnings Surprise
Link to Screen 2 + EPS Next Quarter Revision
Link to Screen 2 + Profit Margin
Screen 3: Yearly Revenue Growth and Acceleration
-
Revenue Growth (3 years): at least 15%
-
Revenue Acceleration: in the last fiscal year
-
(Optional) Revenue Next Year Revision (3 months): at least +8%
Link to Screen 3 - Revenue Growth & Acceleration Yearly
Link to Screen 3 + Revenue Revision Next Year
Screen 4: Quarterly Revenue Growth and Acceleration
-
Revenue Growth (Quarter over Quarter): at least 25%
-
Revenue Acceleration: in the last two quarters
-
(Optional) Revenue surprise in at least 2 of the last 4 quarters
-
(Optional) Revenue Next Quarter Revision: +4%
-
(Optional) Profit Margin improved over 2 quarters
Link to Screen 4 - Revenue Growth & Acceleration Quarterly
Link to Screen 4 + Revenue Surprise
Link to Screen 4 + Next Quarter Revision
Link to Screen 4 + Profit Margin Improved
Screen 5: Combined Yearly Growth (EPS + Revenue)
-
EPS Growth (3 years): at least 15%
-
EPS Acceleration: positive last fiscal year
-
Revenue Growth (3 years): at least 15%
-
Revenue Acceleration: positive last fiscal year
Screen 6: Combined Quarterly Growth (EPS + Revenue)
-
EPS Growth (Q2Q): at least 25%
-
EPS Acceleration: in the last two quarters
-
Revenue Growth (Q2Q): at least 25%
-
Revenue Acceleration: in the last two quarters
Code 33 Alert
This is a very rare but powerful setup in the Mark Minervini strategy.
-
EPS Acceleration: at least 3 quarters
-
Revenue Acceleration: at least 3 quarters
-
Profit Margin improved: at least 3 quarters
Link to Code 33 Screen - (without adhering to the basic trend template)
Link to Code 33 Screen (with Trend Template)
Stocks that pass this filter often show explosive potential, but results are rare, so don’t expect a long list.
Manual Review: The Final Step in the Mark Minervini Strategy
Once you’ve created a watchlist using the Mark Minervini screens, the next step is to manually review each stock. This step is crucial, it’s where you separate the true market leaders from average performers.
Mark Minervini always stresses that screening is just the beginning. The real skill comes from analyzing the story behind each company.
When doing your manual review, focus on the following:
-
Industry and sector performance: How does the stock perform compared to others in its sector?
-
Growth drivers: Are there new products, markets, or innovations that could fuel further expansion?
-
Management outlook: Did management give positive guidance during recent earnings calls?
-
Price and volume action: Does the chart show healthy accumulation (rising prices on higher volume)?
-
Liquidity: Is the stock easy to trade with enough daily volume?
This review process filters out weak stocks that may have passed the screener by coincidence.
Predicting Key Turning Points
Another lesson from Mark Minervini is to recognize when the market environment is shifting. The best opportunities appear when the strongest stocks start to move up before the rest of the market.
He calls this “anticipating leadership.” These stocks show strength even when the indexes are still flat or weak, a sign that institutions are quietly accumulating shares.
Be Aware of the Market Leaders
In the Mark Minervini strategy, you focus on the true leaders in each sector — not just the biggest companies by market cap, but the ones with the strongest growth in earnings, sales, and relative strength.
Why does this matter? Because in early bull markets, these leading stocks usually:
-
Move up first
-
Move up faster
-
Deliver the biggest percentage gains
Ironically, many investors ignore them because “they’ve already gone up.” But as Mark Minervini explains, strength often leads to more strength. A strong move early on is usually a positive sign, not a warning.
How to Identify Market Leaders Using ChartMill
To find Mark Minervini-style market leaders, rank stocks within their sector or industry using multiple performance criteria.
Some practical examples (U.S. stocks only, minimum price $5, minimum daily volume 100,000):
-
Information Technology sector: RS ranking above 90%, sorted by 1-month performance - Direct link
-
Consumer Discretionary – Durables & Apparel: RS ranking above 95%, sorted by 12-month performance - Direct link
When a stock shows up on more than one of these lists, pay attention, that’s a potential leader.
Monitoring 52-Week Highs and Lows
Mark Minervini also watches the number of new 52-week highs and lows. This tells you whether the market as a whole is healthy or weak.
-
When the number of new 52-week highs increases each week → the overall trend is likely up.
-
When new 52-week lows dominate → the market is likely under pressure.
You can also track this by sector to see which areas are leading the next rally.
Example: This screen shows all U.S. energy stocks that hit a new 52-week high in the past week.
Bottom-Up vs. Top-Down: The Mark Minervini Approach
While many investors use a Top-Down method - starting with the market trend, then sectors, then stocks - Mark Minervini prefers a Bottom-Up approach.
Here’s the difference:
-
Top-Down: You wait for the general market to improve before looking for strong stocks.
-
Bottom-Up: You look for the best-performing stocks first, even when the market still looks weak.
Mark Minervini believes that the strongest stocks often recover and break out before the overall market turns. These stocks enter Stage 2 uptrends while the indexes are still building bases.
By identifying these early leaders, you can take small test positions before a new bull market officially starts.
What to Look for in Bottom-Up Trading
When using the Mark Minervini Bottom-Up method, watch for:
-
Stocks consolidating in a Stage 2 uptrend
-
Tight price action near recent highs
-
Volume increasing on up days and drying up on pullbacks
-
Positive fundamental trends backing the chart setup
These are often the setups that lead to explosive moves once the general market confirms the trend.
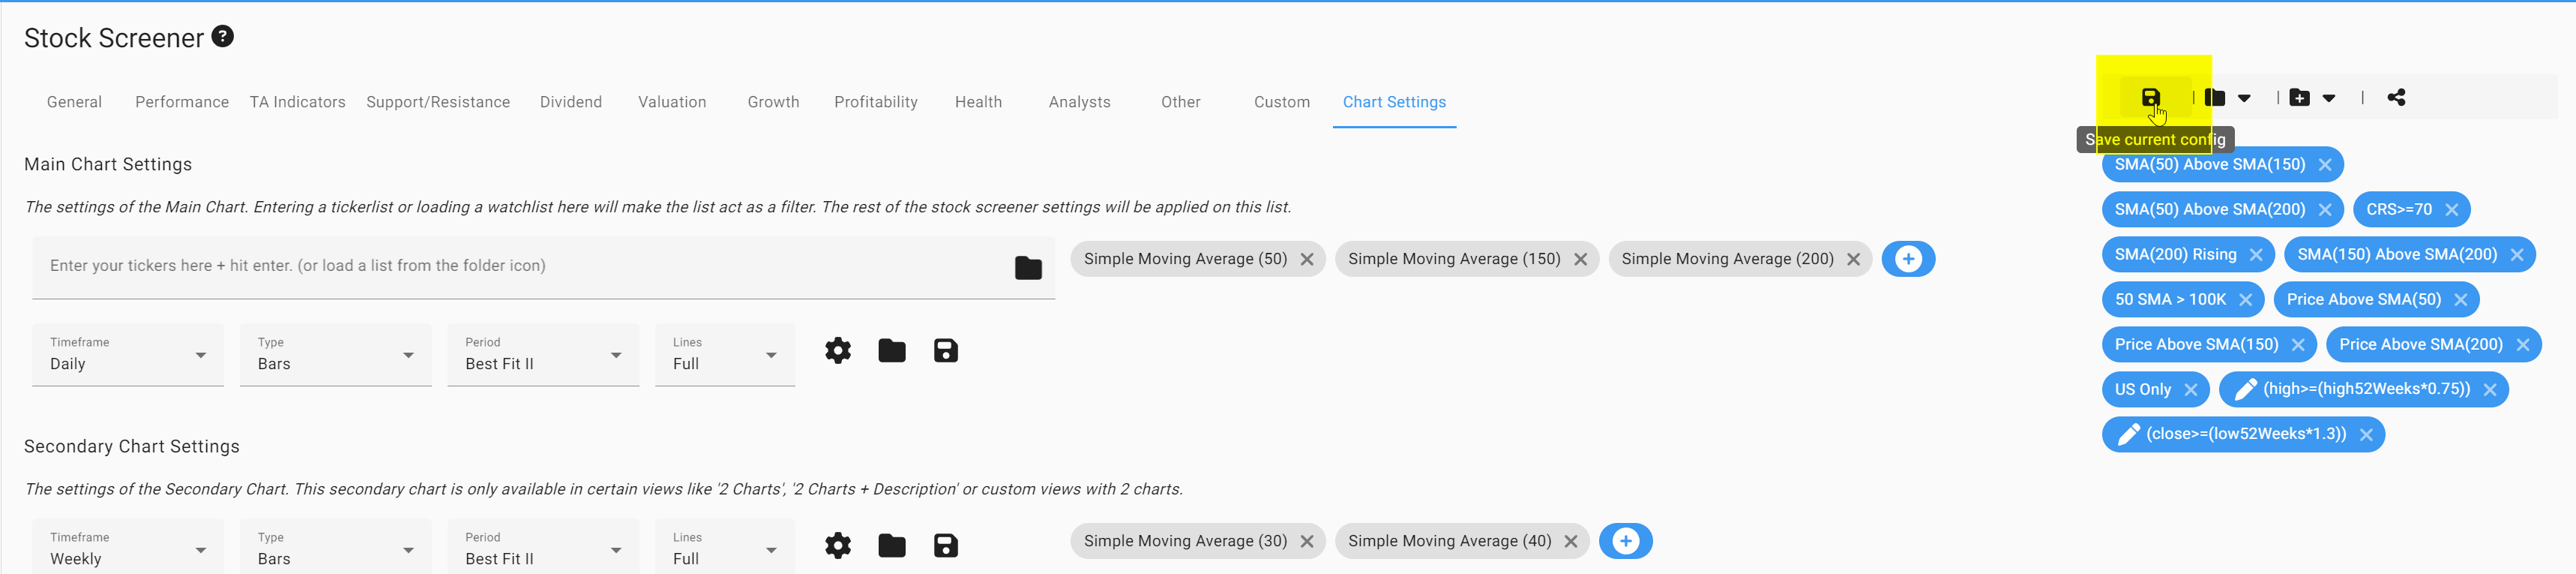
Using the Mark Minervini View in ChartMill
To help traders apply the Mark Minervini strategy quickly, ChartMill offers a special Mark Minervini View. This layout lets you visualize both the technical and fundamental conditions that define a valid Minervini setup.
By opening this view, you’ll see:
-
All key moving averages (50-day, 150-day, and 200-day)
-
Relative strength rankings
-
Price patterns that fit the Mark Minervini Trend Template
-
The overall chart setup within its current stage
Direct link to the Mark Minervini View in ChartMill
How to Save the View
Click the disk icon in the upper-right corner of the stock screener page.
Enter a name, for example: “Mark Minervini View”.
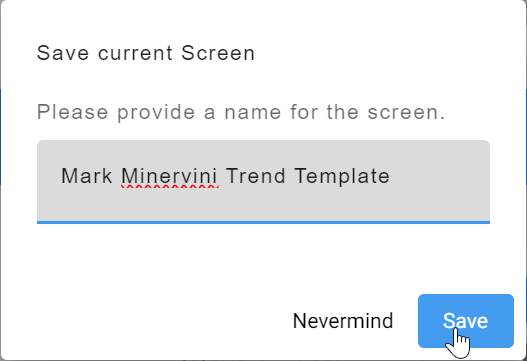
Click Save.
Now this layout will be available every time you log in.
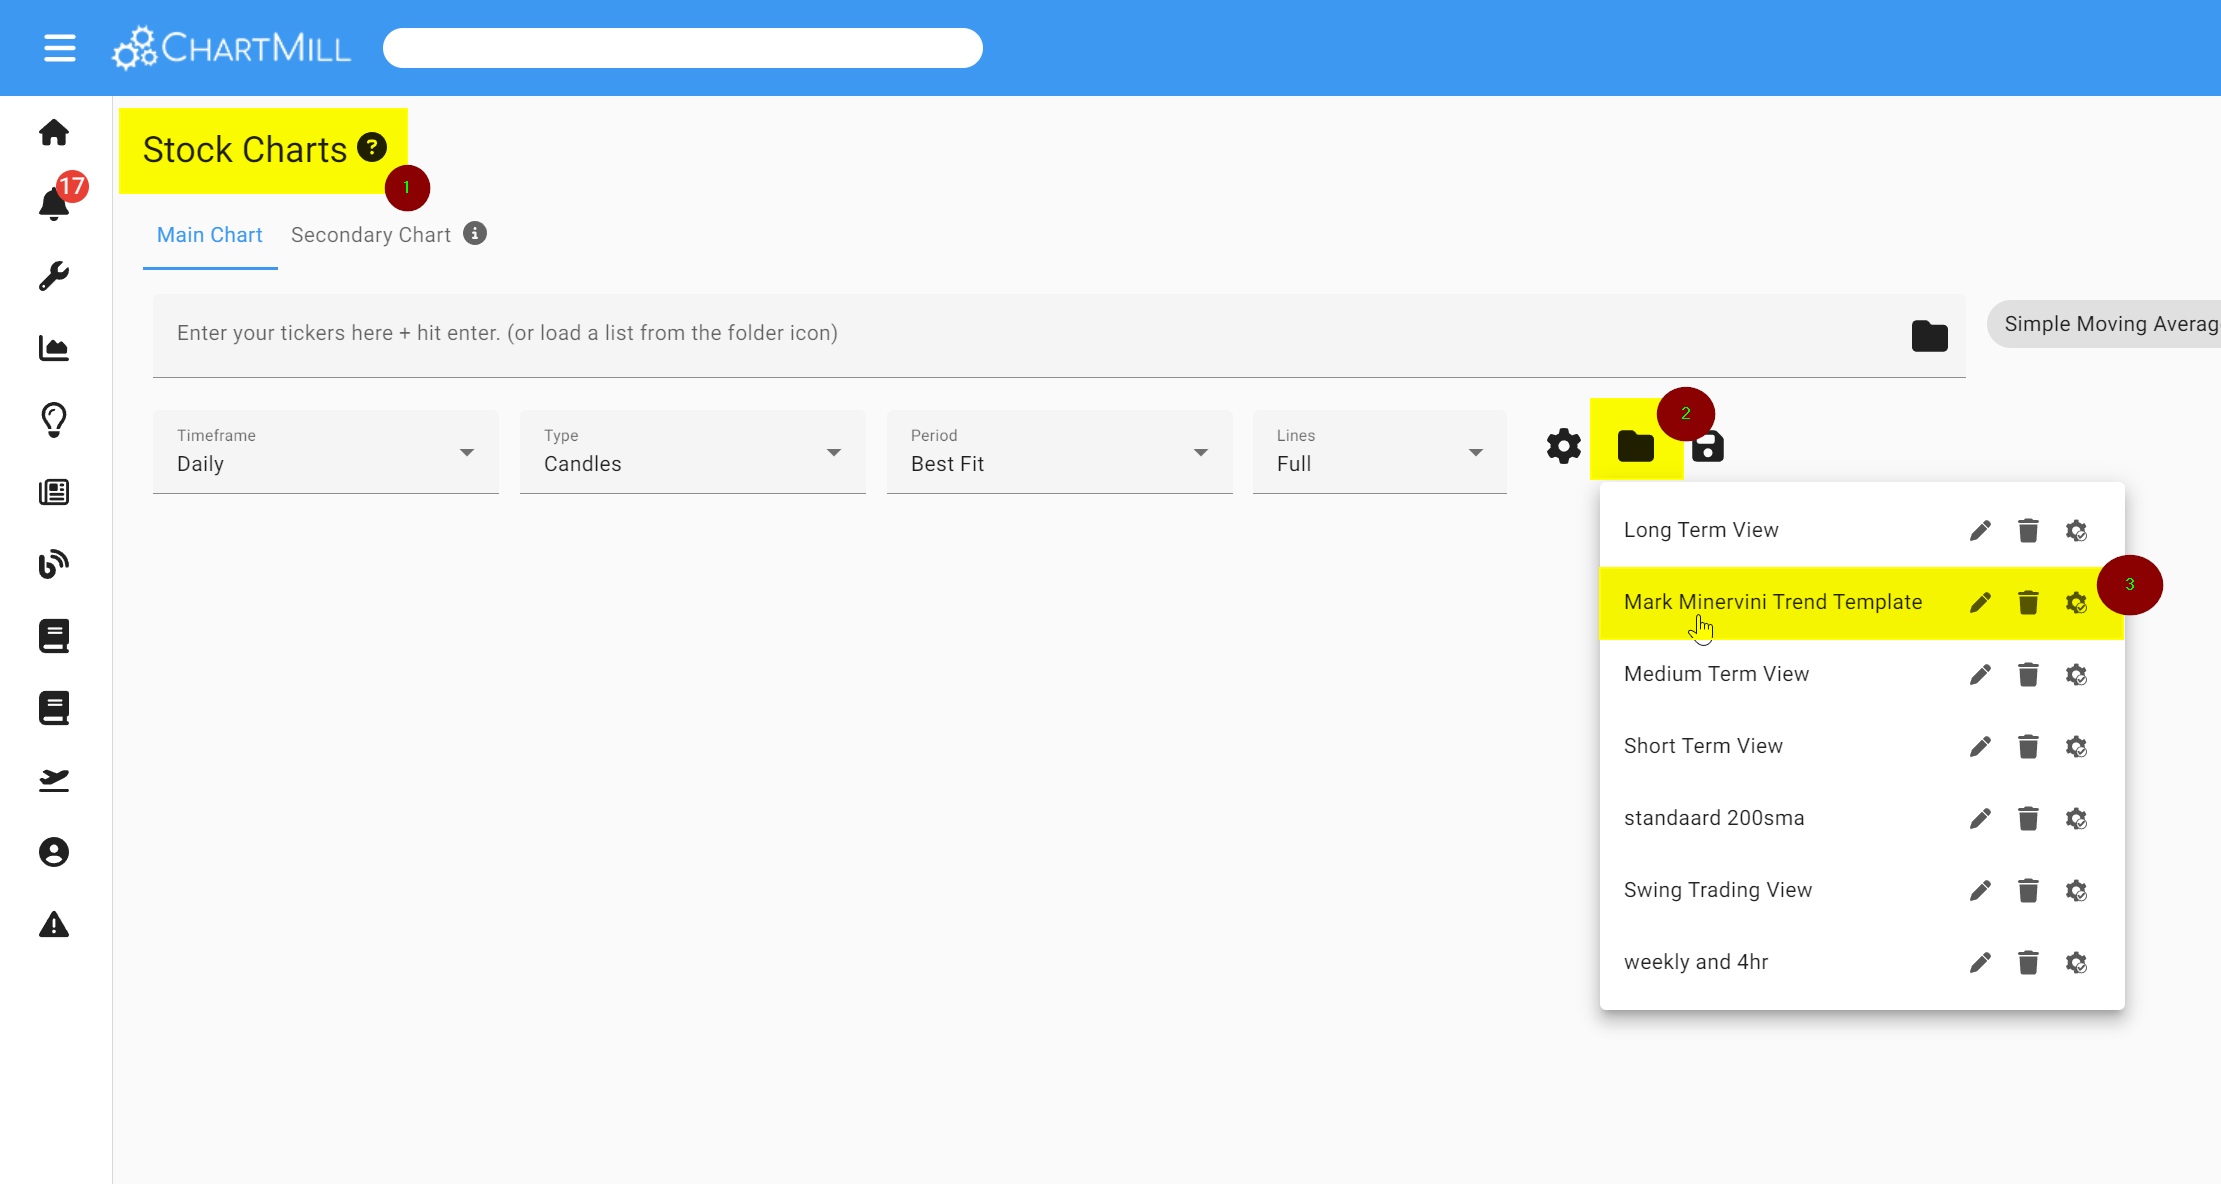
Accessing the Mark Minervini View from Different Pages
You can open the Mark Minervini View from two main areas:
- From the Stock Charts page: Select the saved view from your dropdown menu.
- From the Stock Screener page: Choose your view before or after applying filters.
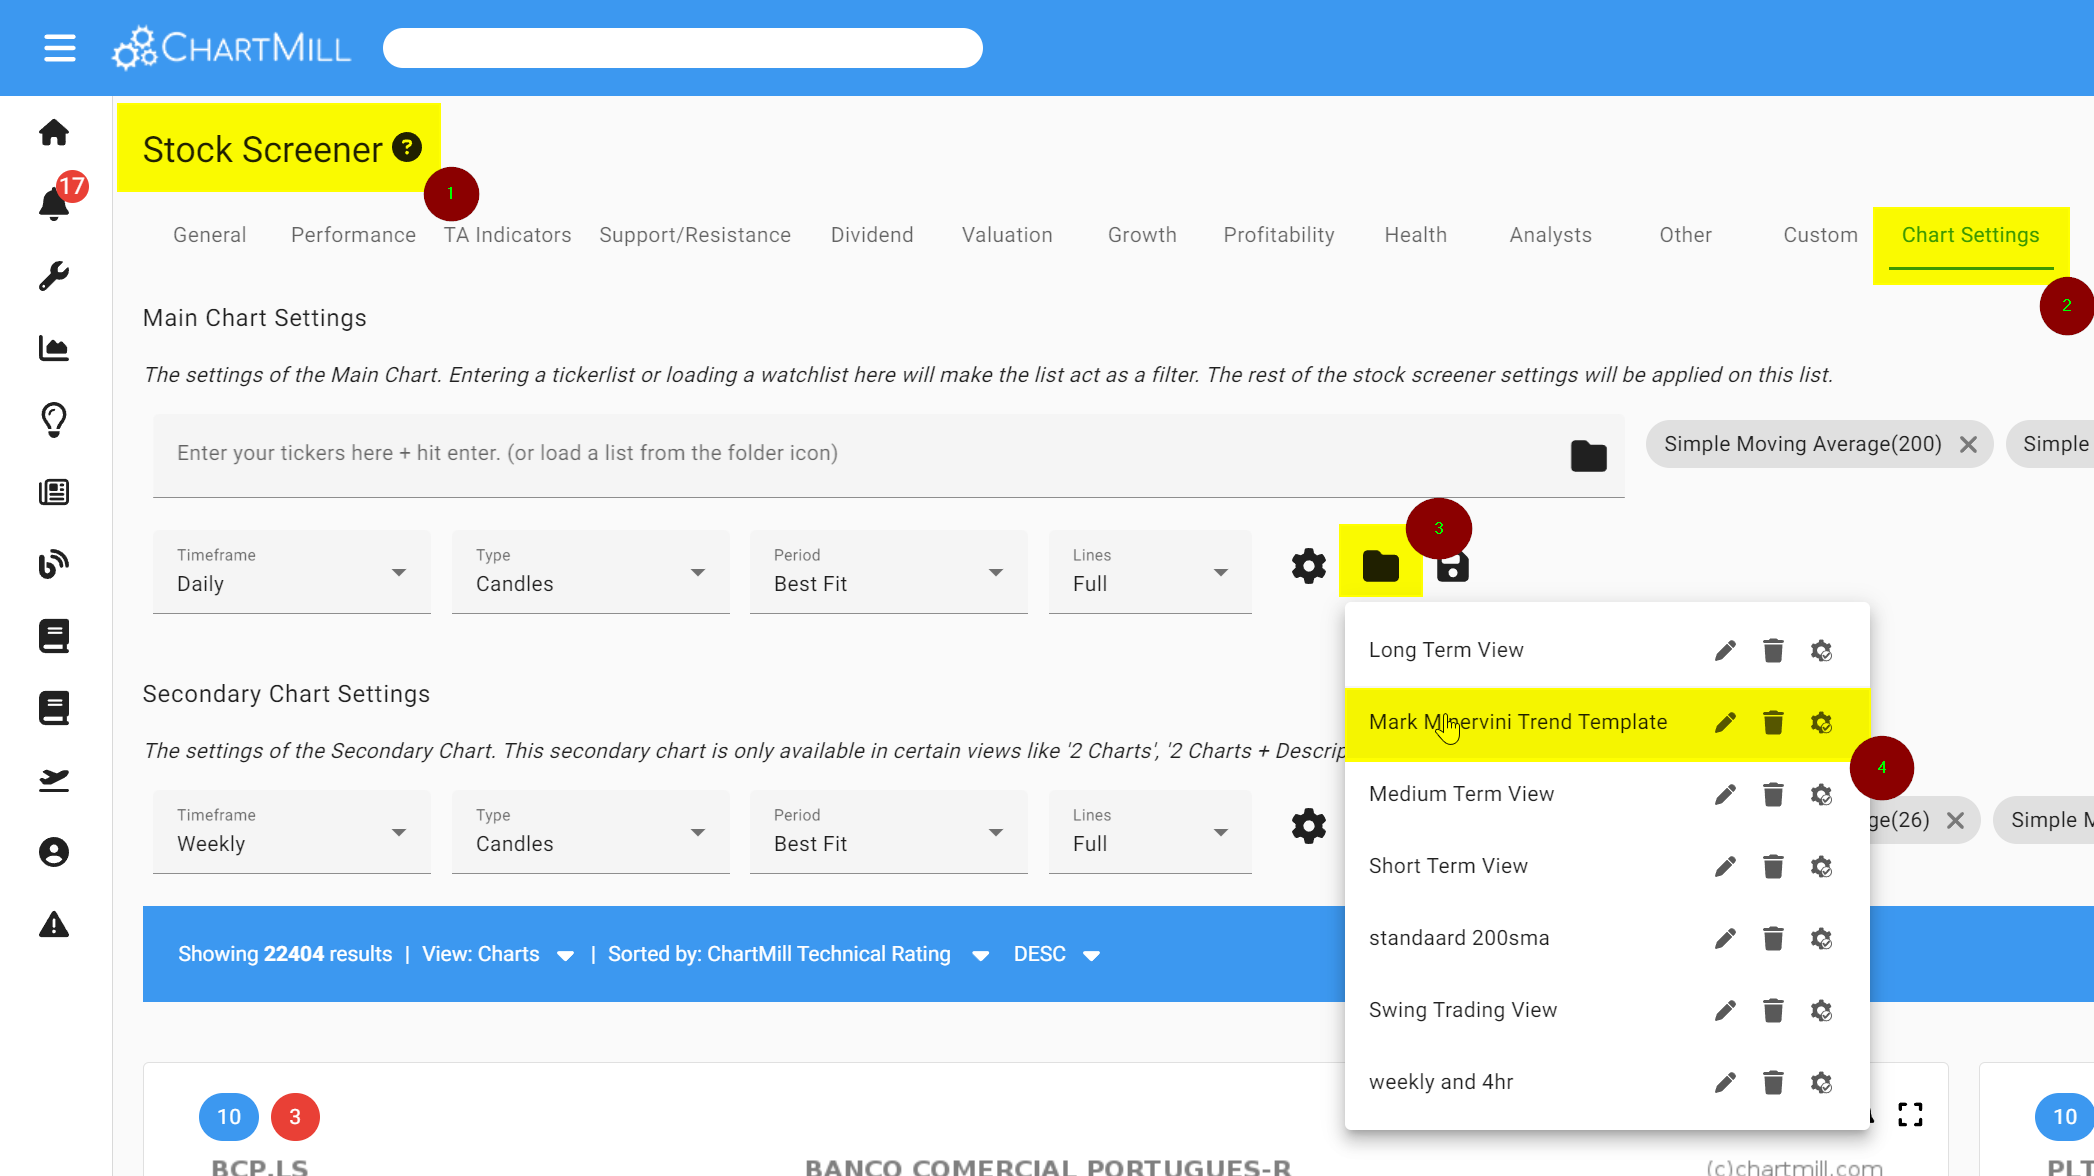
This flexibility lets you move easily between chart analysis and screening, just as Mark Minervini teaches in his books.
Further Reading on the Mark Minervini Strategy
If you want to understand the Mark Minervini trading philosophy in depth, his own books are must-reads. They go far beyond technical rules, explaining mindset, discipline, and money management.
Essential Books by Mark Minervini
The first 2 books detail the SEPA methodology and the psychology behind consistent trading success.
If you enjoyed this article, be sure to also read “Think and Trade Like a Champion Part 2 | Trading Strategy”.
In that follow-up article, we explore the practical side of the Mark Minervini strategy, including how to open and manage trades, set stop losses, take profits, and handle risk.
Together, both parts form a complete guide to applying Mark Minervini’s trading system with precision and confidence.
Other Books Recommended by Mark Minervini
Mark Minervini often credits several other authors who shaped his thinking. Here are his top recommendations:
-
Superperformance Stocks by Richard Love
-
The Relative Strength Concept of Common Stock Price Forecasting by Robert A. Levi
-
Stock Market Blueprints by Edward S. Jensen
-
How to Trade in Stocks by Jesse Livermore
-
Secrets for Profiting in Bull and Bear Markets by Stan Weinstein
These classics help traders understand the foundation of momentum and stage analysis, two key pillars in the Mark Minervini system.
Final Thoughts
The Mark Minervini strategy is a complete approach combining technical and fundamental analysis, strict risk control, and a disciplined mindset.
By using ChartMill’s Mark Minervini Trend Template and SEPA-based filters, you can screen, review, and trade with a clear set of rules that mirror those used by one of the world’s most successful traders.
“The key is not predicting the future, it’s preparing for it.”
Trade safe!
The ChartMill Team
Frequently Asked Questions About the Mark Minervini Strategy
1. What is the Mark Minervini Strategy?
The Mark Minervini strategy is a trading method that combines technical and fundamental analysis. It focuses on buying high-quality stocks that are trending upward and showing strong growth in sales and earnings. The goal is to identify stocks just before they make large price moves while keeping risk small through strict stop-loss rules.
2. What does SEPA mean in the Mark Minervini System?
SEPA stands for Specific Entry Point Analysis. It’s the foundation of the Mark Minervini trading strategy. SEPA helps traders find the exact point where the odds of success are highest, when a stock’s technical setup, fundamentals, and market conditions all align.
3. What is the Mark Minervini Trend Template?
The Mark Minervini Trend Template is a checklist of technical rules that define a strong uptrend. It includes specific moving average alignments, proximity to 52-week highs, and high relative strength.
In ChartMill, you can apply these filters directly with the Mark Minervini Trend Template Screener to quickly find stocks that meet all conditions.
4. How does Mark Minervini manage risk?
Risk management is central to the Mark Minervini approach. He keeps losses small by cutting trades quickly when they move against him. He never lets a single trade cause major damage to his account. By limiting each loss and compounding winners, he protects capital and grows it steadily.
5. How can I use ChartMill to trade like Mark Minervini?
ChartMill allows you to replicate the Mark Minervini screening process using both technical and fundamental filters. You can:
-
Apply the Trend Template Screener to find technically strong stocks.
-
Use fundamental filters for earnings growth, sales acceleration, and margin improvement.
-
Save your personalized Mark Minervini View for easy chart analysis.
Together, these tools help you build your own Minervini-style watchlist and trading plan.
6. Why is Mark Minervini considered one of the best traders?
Mark Minervini won the U.S. Investing Championship twice, achieving returns of 155% in 1997 and 334% in 2021, both with strict risk control. His consistent performance and detailed system have made him one of the most respected traders in the world.
7. Can beginners use the Mark Minervini strategy?
Yes, beginners can use the Mark Minervini strategy, especially when combined with tools like ChartMill. The system’s clear rules make it ideal for learning how to spot trends, manage risk, and develop trading discipline.
Disclaimer - This is not financial advice. Our content is intended to be used and must be used for information and education purposes only. Please read our disclaimer and terms and conditions to understand our obligations.