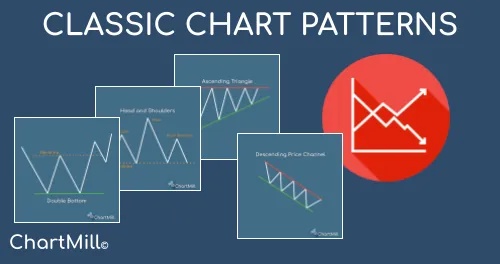
Classic Chart Patterns
Chart patterns are a common tool used by traders to identify potential trading opportunities in the financial markets. These patterns are formed by the price action of a security, and can provide valuable information about the direction in which the price is likely to move.
Some of the most common chart patterns include head and shoulders, double tops and bottoms, triangles, and flags and pennants. By analyzing these patterns, traders can make informed decisions about when to enter or exit a trade.
It's important to note, however, that chart patterns are not a guarantee of future price movements, and should only be used in conjunction with other technical and fundamental analysis tools to make informed trading decisions.
The Three Major Groups
A distinction is made between three different types of chart patterns which indicate the direction of the most likely price movement. Keep in mind however that some chart patterns may belong to multiple groups. The market conditions and the specific price action will always be decisive for the further course of the price which means that a typical reversal pattern may still lead to a continuation of the existing trend.
Continuation Patterns
Continuation chart patterns are formed when the price of a security continues in the same direction after a period of consolidation or correction. These patterns indicate that the current trend is likely to continue, and can be used by traders to identify potential entry or exit points in the market. Some examples of continuation chart patterns include triangles, flags and pennants, and cup and handle.
Reversal Patterns
Reversal chart patterns, on the other hand, are formed when the price of a security reverses its direction after a period of uptrend or downtrend. These patterns indicate that the current trend is coming to an end, and that the price is likely to move in the opposite direction. Some examples of reversal chart patterns include head and shoulders, double tops and bottoms, and wedges.
Neutral Patterns
Neutral chart patterns are those that do not provide a clear indication of the direction in which the price is likely to move. These patterns are typically characterized by a period of consolidation or indecision, during which the price of a security moves within a tight range. Neutral chart patterns can be either continuation patterns or reversal patterns, depending on the previous trend of the security. A symmetric triangle is an example of a neutral pattern.
It's important to note that while neutral chart patterns do not provide a clear indication of the direction of the price, they can still be useful for traders. For example, a neutral triangle pattern can provide information about the level of support and resistance in the market, which can be used to set stop-loss orders and target prices. Additionally, the breakout from a neutral chart pattern gives clues about the strength of the current trend, and can help traders make informed decisions about their trades.
These basic groups can be either bullish or bearish. For example, a bullish reversal signal means that the price is rising again after a previous downtrend. A bearish continuation pattern means that the downtrend eventually continues.
Classic Chart Patterns overview
Cup and Handle
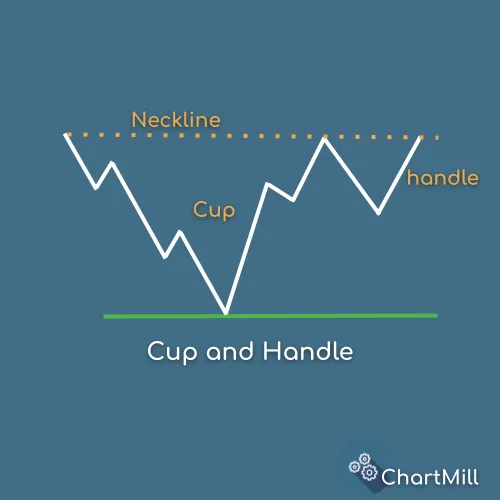
The cup and handle chart pattern is a bullish continuation pattern that is formed when the price of a security creates a rounded bottom, followed by a smaller pullback, and then a breakout to new highs. This pattern is named for its distinct shape, which resembles a cup with a handle.
Double and triple bottoms
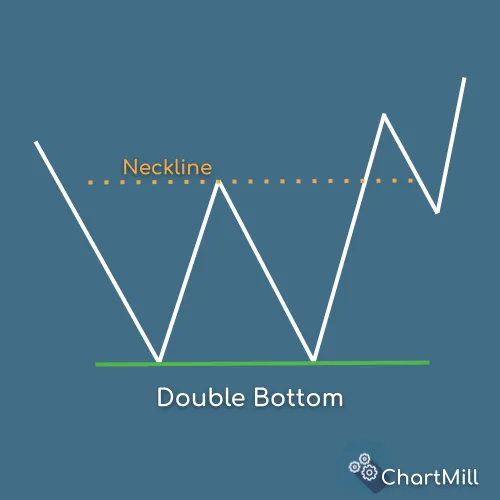
Double bottoms and triple bottoms are reversal chart patterns that are formed when the price of a security creates two or three distinct troughs at roughly the same price level. These patterns are considered bullish signals, as they indicate that the downtrend is coming to an end and the price is likely to rise.
Double and triple tops
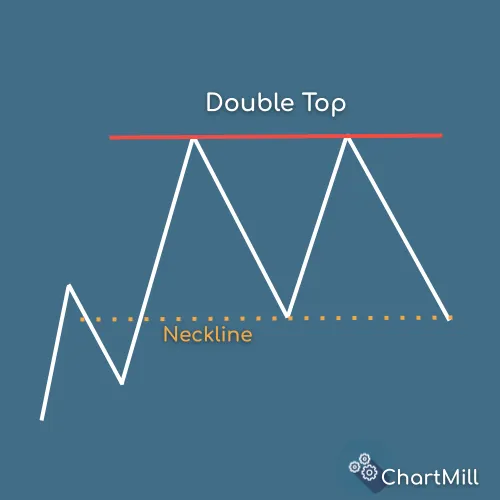
Double tops and triple tops are also reversal patterns but they are considered - unlike price bottoms - to be bearish signals. Traders assume that the prevailing upward trend is coming to an end and the price is likely to fall.
Head and Shoulders
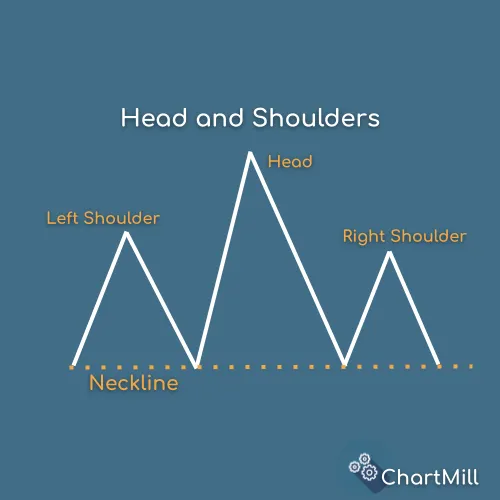
The head and shoulders pattern is a reversal chart pattern that is formed when the price of a security creates a peak (the left shoulder), a higher peak (the head), and then a lower peak (the right shoulder). This pattern is considered a bearish signal, as it indicates that the uptrend is coming to an end and the price is likely to fall.
Ascending Triangle
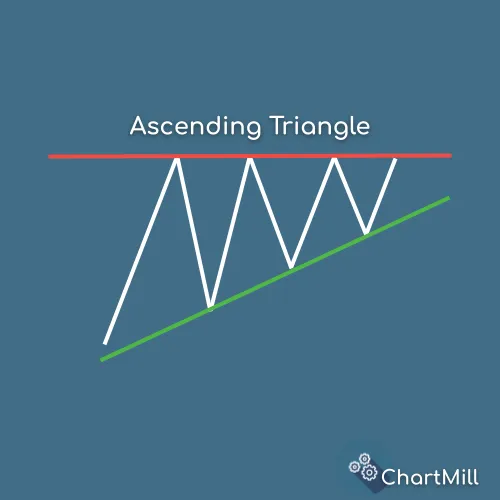
The ascending triangle pattern is formed when the price of the asset moves between a flat resistance level and an upward-sloping support level. This creates a triangle-like shape on the chart. The ascending triangle pattern is typically seen as a bullish signal, indicating that the price of the asset is likely to break out above the resistance level and continue to rise. It can either be a reversal pattern after a downtrend or a continuation pattern in an existing bullish trend.
Descending Triangle
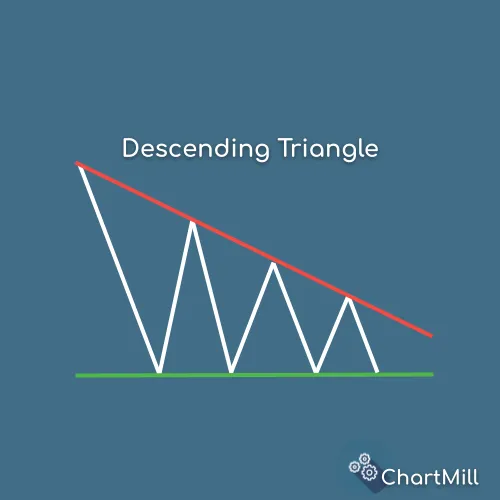
In contrast, a descending triangle pattern is formed when the upper trendline is downward-sloping and the lower trendline is horizontal. This pattern creates a triangle-like shape on the chart that is pointing downward. This pattern is typically seen as a bearish signal (reversal or continuation), indicating that the price of the asset is likely to break down below the horizontal support level and continue to fall.
Symmetric Triangle
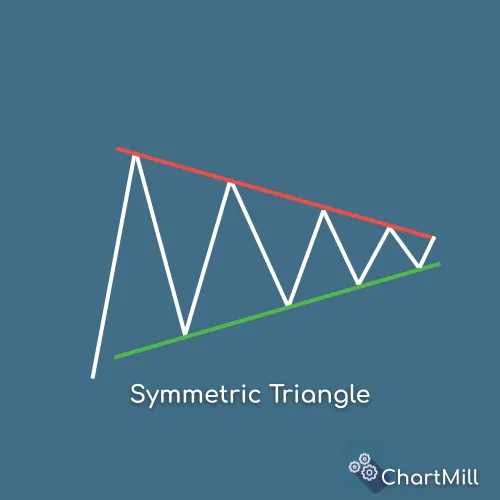
A symmetric triangle is a type of triangle pattern that is formed when the price of an asset moves between two converging trendlines. This pattern is called a "symmetric" triangle because both trendlines have a similar slope, creating a triangle-like shape on the chart that is symmetrical. It is a clear neutral pattern in which the bullish or bearish nature depends entirely on the direction in which the breakout eventually occurs. A breakout from the upper trendline is bullish, a breakout downward is bearish.
Rising Wedge
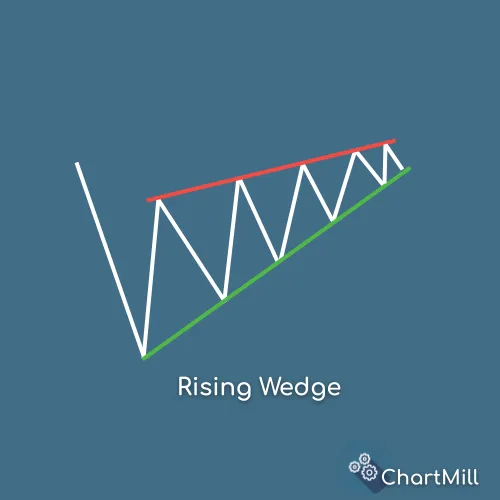
a rising wedge is a chart pattern in which prices are moving upwards but the trading range is getting smaller, forming a wedge shape. It is considered to be a bearish reversal pattern.
Falling Wedge
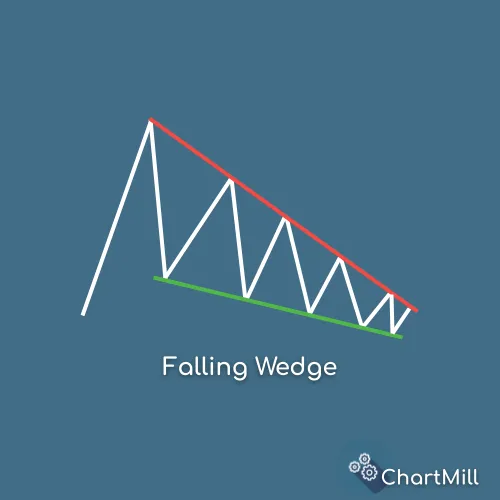
A falling wedge is the opposite, with prices moving downward and the same wedge shape created by a narrowing range. Logically, this is also a reversal pattern but in this case bullish where it is assumed that the price will start to rise again.
Bull Flags (and pennants)
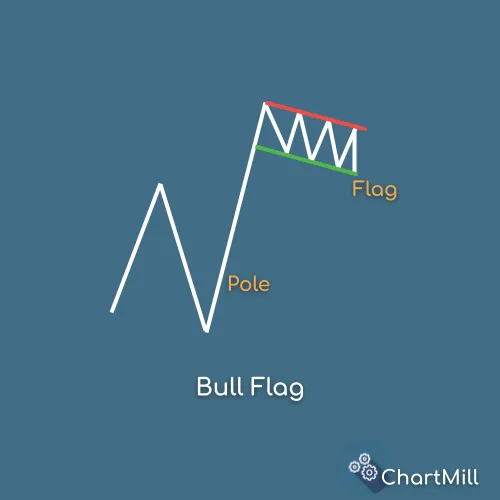
A bull flag is a chart pattern that is formed when the price of a security makes a strong upward move, followed by a period of consolidation, during which the price moves horizontally or slightly downpwards. The consolidation phase is often referred to as the "flag" portion of the pattern. This pattern is considered a bullish continuation signal, indicating that the price may continue to rise after the consolidation period.
Bear Flags (and pennants)
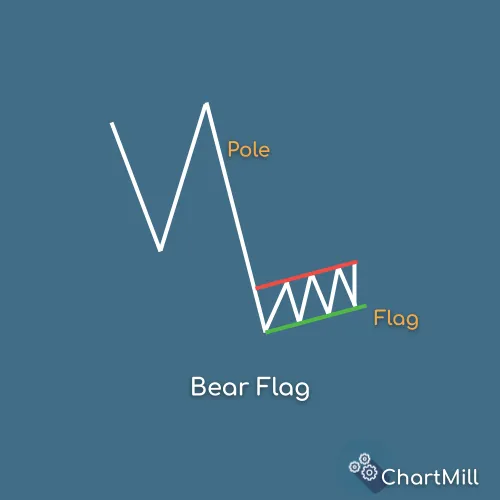
A bear flag occurs when the price of a stock initially falls sharply and the price eventually enters a period of consolidation (horizontal to slightly upward). At that point, the typical flag shape forms. In this case, we are dealing with a bearish continuation pattern. Traders assume that after this consolidation period, the price will continue to fall.
Ascending Price Channel
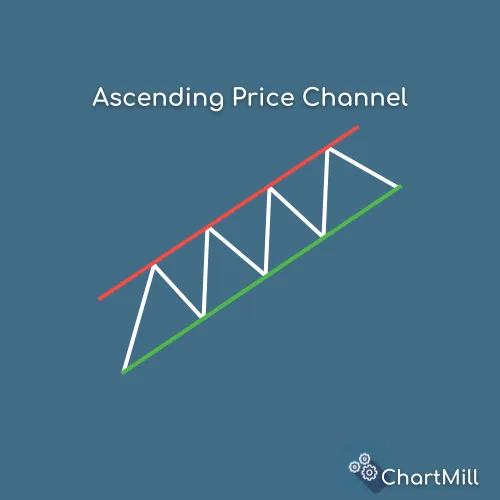
An ascending price channel is a chart pattern that is formed when the price of a security moves upwards in a well-defined trend. The price will typically make a series of higher highs and higher lows, creating a sloping channel that angles upwards. This pattern is considered a bullish continuation pattern, indicating that the price is likely to continue rising within the defined channel.
Descending Price Channel
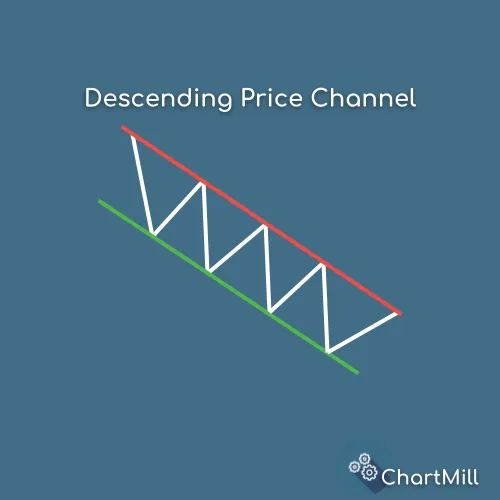
A descending price channel occurs when the price of a security moves downwards in a negative trend, making a series of lower lows and lower highs. The lower and upper boundaries of the channel are determined by the support and resistance levels, which are the levels at which the price has difficulty rising above (for the upper boundary) or falling below (for the lower boundary). As with the ascending price channel this descending price channel is considered a continuation pattern.
Diamond Formation
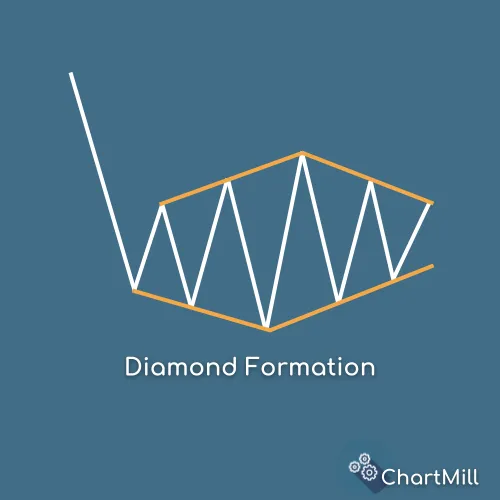
A diamond formation is a chart pattern that is formed when the price of a security makes a series of lower lows and higher highs, followed by a series of higher lows and lower highs, creating a diamond shape. This pattern is considered a neutral pattern, so it can be either a continuation or reversal pattern.
Rounding Bottom Pattern
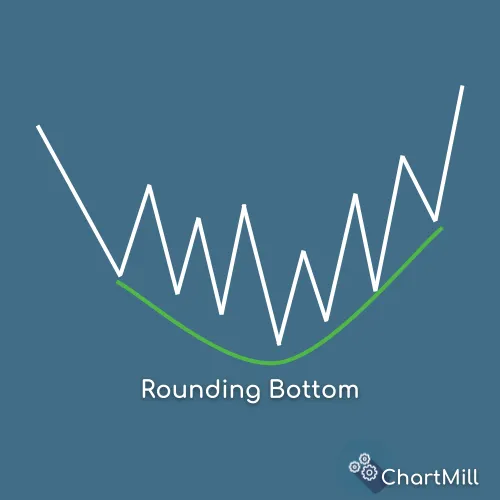
The rounding bottom pattern is also known as the U-shaped pattern, where the price of a security makes a series of lower lows and higher lows. This pattern is considered a bullish reversal signal, indicating that the price is likely to reverse direction and start moving upwards.

