Price-to-Earnings Ratio (P/E)
Valuation ratios are ideally suited to determine the value of a company in a statistically sound and objective manner. The most well-known valuation ratios are Price-to-Earnings (P/E), Price to Sales (P/S) and Price to Book (P/B).
Each of these ratios contains vital information that leads to a specific insight into the firm. It is very important not to look at this information in isolation but always in a broader context.
In this article, we focus on the Price-to-Earnings ratio.
Formula and explanation
P/E ratio is calculated by dividing the current share price by earnings per share.
P/E ratio = Stock price / Earnings per share (EPS)
The ratio represents how many times a company's earnings are paid by investors on the stock market. This implies that the ratio is only useful for profitable companies. An extremely high value can be a sign that the high stock price is ultimately just an artificial and inflated bubble. This bubble can burst at any time, for example, if the company is unable to meet earnings expectations. If the bubble bursts, the stock price can fall at lightning speed.
- No value | If the company does not make a profit, the k/w ratio is undefined.
- 0-10 | Share price value is undervalued OR earnings are expected to decline
- 10-17 | This is a broad overall average which is considered reasonable
- 17-25 | Share price value is overvalued OR earnings have increased (significantly) since the last figures were announced.
- 25+ | Investors expect a great deal from the company; future expectations are high.
Stating that only companies with low P/E ratios are interesting to buy is too shortsighted. Typical growth companies, for example, where investors assume that both turnover and profit will increase strongly in the future, will often quote at very high P/E ratios.
For such companies, investors are often willing to pay a "premium" in the form of a (much) higher P/E ratio.
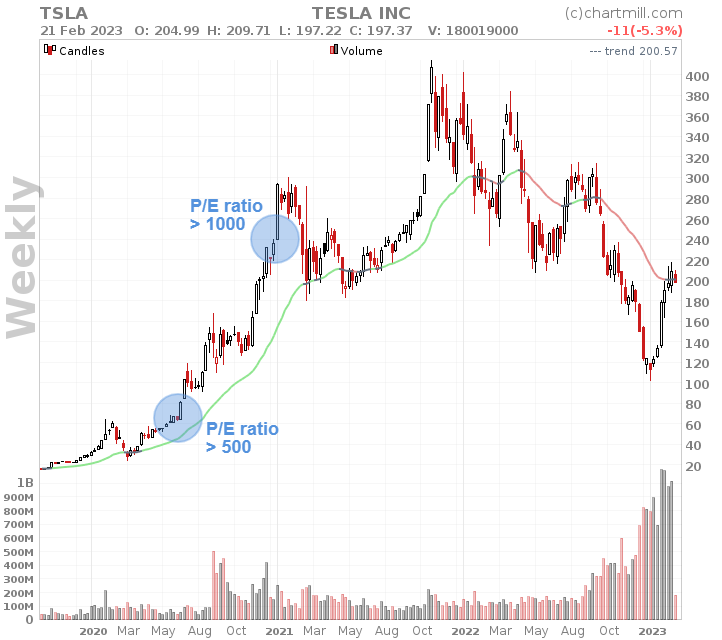
Tesla, for example, had a P/E ratio of over 500 on the date of 30/06/2020, its share price then quoted at $71.99. The stock seemed extremely overvalued. But by the end of 2020, the share price had risen to over $235 and the k/w ratio rose to over 1000!
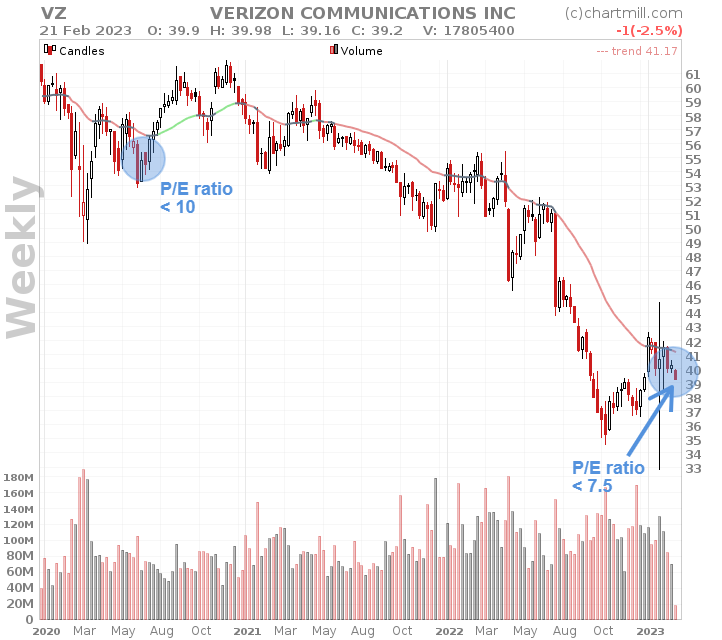
On the other hand, when it comes to stocks with low k/w ratios, one cannot simply assume that they are a bargain and the price will rise in no time.
Verizon Communications stock, for example. At the end of June 2020, the price was trading at just under $50 with a P/E ratio lower than 10. At the time of writing, February 2023, the P/E ratio has fallen further to 7.75. The stock price itself also fell more than 20% (+/- $39).
What should you keep in mind when using the P/E ratio?
What is profit?
Profit is part of the formula. The question to ask is what exactly is meant by that profit?
Exceptional profits or losses, for example, can have a pernicious impact on this ratio. Also, the way in which depreciation or non-recurring income and expenses appear on the balance sheet have a direct impact on the profit figures and thus on the P/E ratio.
Another disadvantage, which by the way does not only apply to the P/E ratio, is the fact that these figures are based on historical profits (Trailing Twelve Months figures). This undoubtedly gives a very accurate and correct figure for past years but says nothing at all about revenues and profits for future years. To remedy that, an investor can use forward P/E (which are also available in our platform). These forward earnings are objective estimates made by analysts. And although an attempt is made in this way to also take into account future projections when calculating the ratio, it obviously remains an estimate that will never be perfect.
Earnings per share growth
What the P/E ratio completely ignores are the growth prospects for earnings per share. If it turns out that the company is growing at a fast pace, for example, it is much less of a problem to buy such a company with a somewhat higher P/E ratio. After all, the rapid growth in earnings per share will cause the P/E ratio to move back to a more reasonable level.
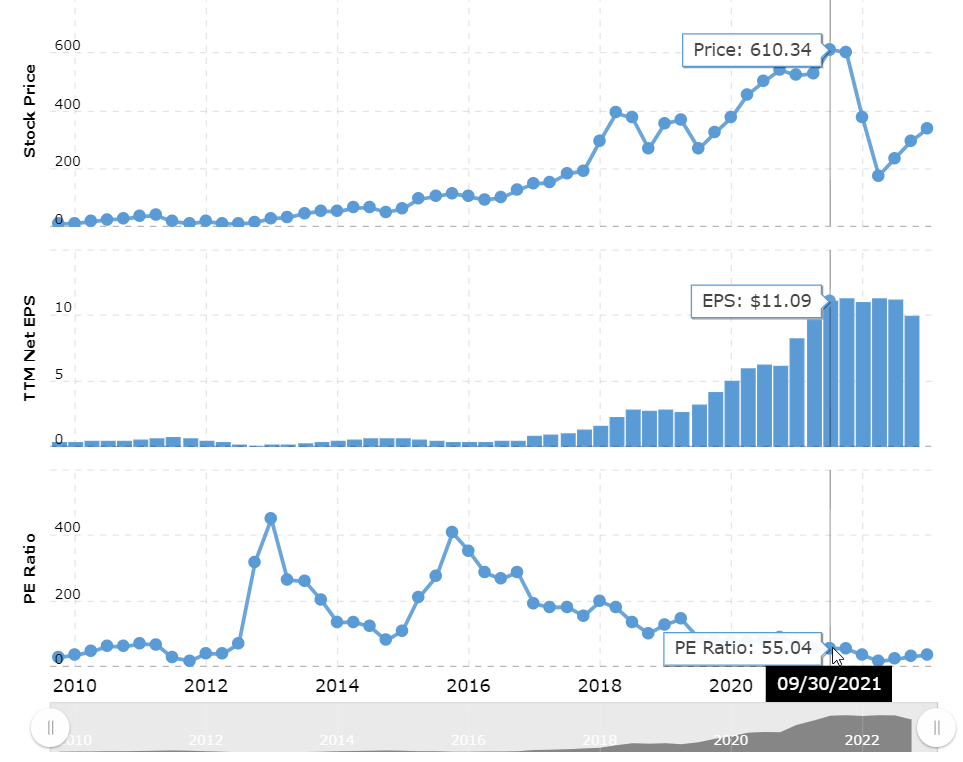
A good example of this can be found with Netflix stock, which on date of September 30, 2019, had a price value of $267.62 at a P/E ratio of 85.50. Earnings per share at the time were $3.13.
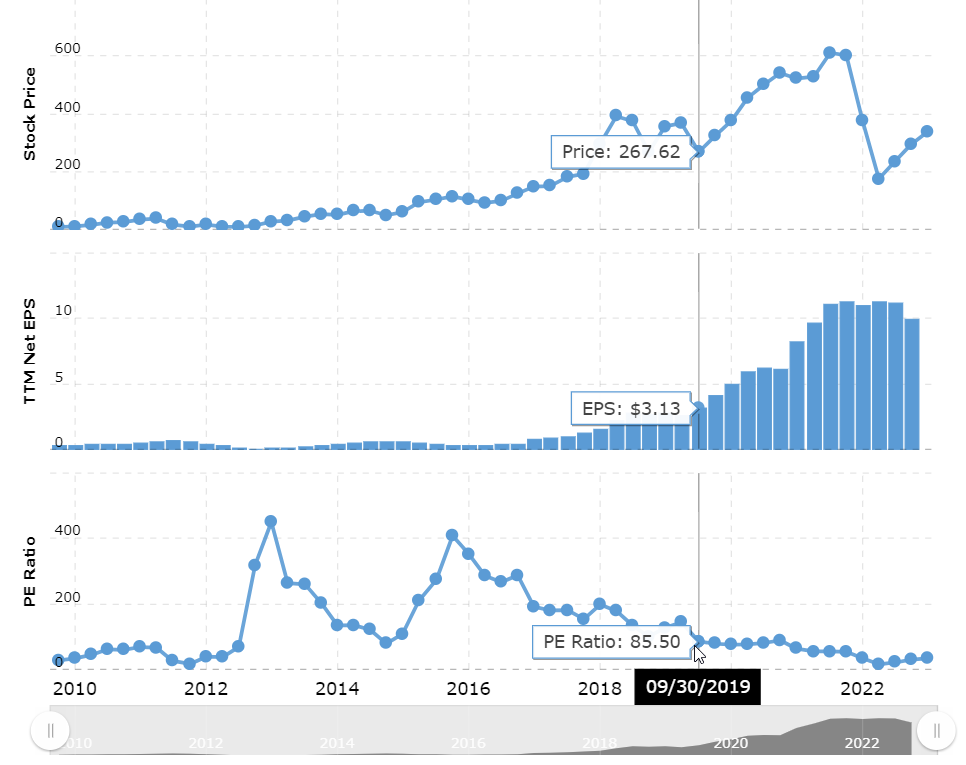
source: Macrotrends.net
From then on, the price went up sharply, from $267 to more than $600 in just 2 years. During that same period, earnings per share had nearly quadrupled. Its effect on the P/E ratio becomes immediately apparent. Despite the extreme price increase, we see a drop in the P/E ratio due to the still much steeper rise in earnings per share. This was initially 85.50 but dropped to 55. Still a high figure but nevertheless a clear sign that such ratios must be viewed in proper perspective and never in a vacuum.
source: Macrotrends.net
So always keep in mind the evolution of earnings per share. You can also rely on another valuation ratio for this, the Price-Earnings-Growth ratio (PEG). More on that in this seperate article.
Debt
Finally, we cannot ignore the amount of debt a company has on its balance sheet. This is another factor the P/E ratio does not take into account, even though it can have a major impact on a company's valuation. Especially in times of economic difficulty with rising interest rates, the distinction between debt-free companies and companies that carry a lot of debt on their balance sheet becomes all the more important.
Comparing P/E ratios
Comparing P/E ratios of different companies should only be done within a certain sector. After all, the average P/E ratio is very sector-specific. But comparing within the same sector can provide very valuable information. When a company has a significantly lower P/E ratio compared to the sector average, this can be a sign of undervaluation (assuming there are no other obvious negative reasons for a too low P/E ratio).
P/E vs Forward P/E
While the P/E ratio considers the earnings over the past year, the Forward P/E ratio incorporates estimates of future earnings. It provides insight into the market's expectations for a company's future earnings. It is based on analysts' forecasts for the next 12 months and can be a useful metric for investors looking ahead. A lower Forward P/E may suggest that the market has more conservative expectations about future earnings growth.
Forward P/E Ratio = Market Price per Share / Estimated Earnings per Share (Next 12 months)
Conclusion
The P/E ratio is one of the most widely used ratios and owes its popularity mainly to the simplicity with which it is calculated. However, it also has disadvantages. After all, a number of parameters that can have a major impact on the valuation of a company are not included in the formula. Still, it is a ratio that can offer added value for a first rough filtering. The resulting selection should then be further investigated with other additional valuation methods.
P/E ratio screening filter example
Using this filter combination, ChartMill searches for stocks that have a price/earnings ratio of 12 or less. The other filters used (debt/equity + eps 3y >=10%) further ensure that the selected company has manageable debt and there is significant growth in earnings per share. The filter is applied worldwide but only to companies with a minimum capitalization of 300 million.
Related Articles
Fundamental Valuation Filters
In this article we will discuss all the fundamental filters related to the valuation of a stock. Read more...