Support and Resistance Stock Screener and Trading Strategies
The ChartMill Stock Screener has a complete tab dedicated to Support and Resistance, so the possibilities for screening are quite extensive:
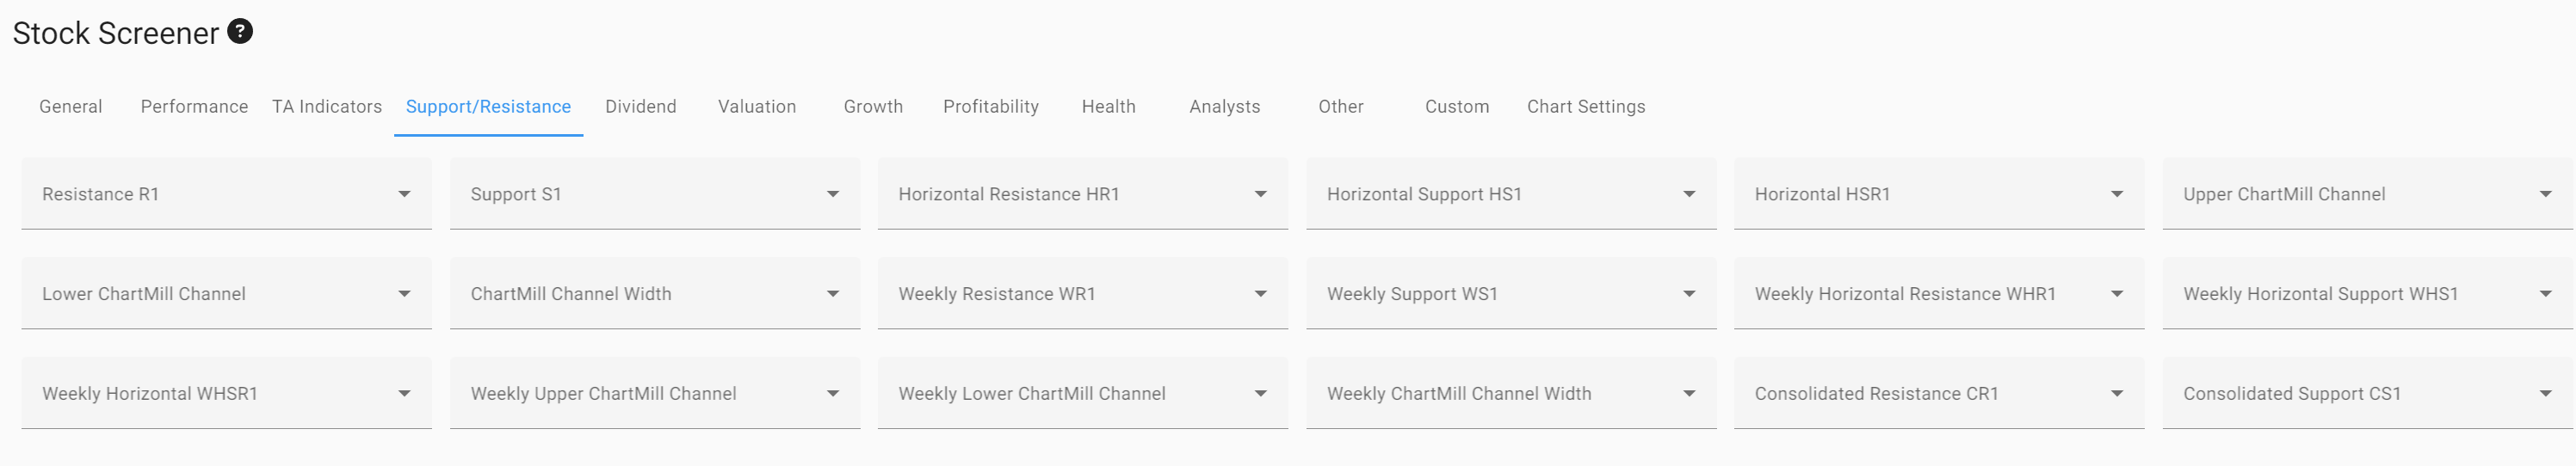
As you can see there are 18 fields, which are really 18 possible lines on the chart. Each of these lines can be filtered based upon:
Level value
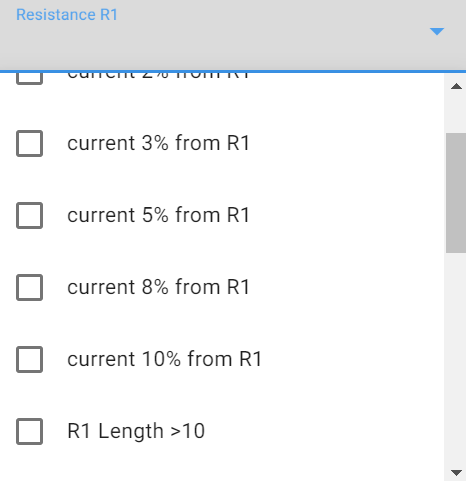
The level value is where the line is at on the price chart, or in other words at what level the support or resistance can be found. In the screener we can filter on the %-distance from the current price to the support or resistance level.
Strength
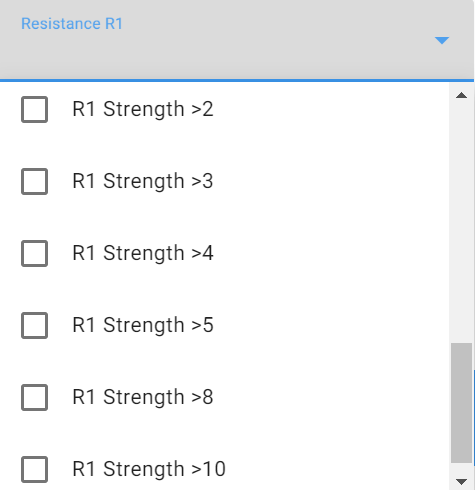
The strength of a line is an indicator for its significance. The higher the value, the stronger the line. The strength is determined by measuring how many times the line has been tested in the past.
Length
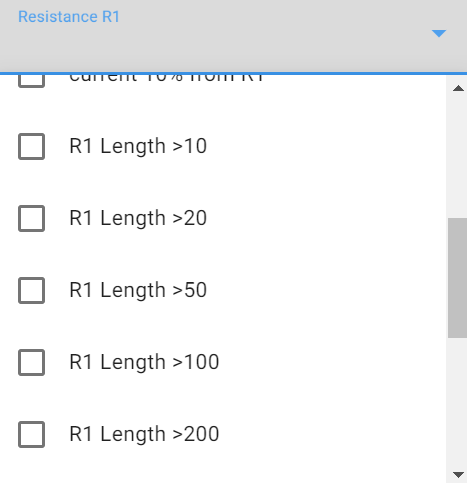
The length of a line specifies how long the line is, expressed in the same unit as the time frame. So for daily lines the length is measured in days, for weekly lines in weeks.
The (potential) lines themselves are documented in detail on the security properties page, but just quickly:
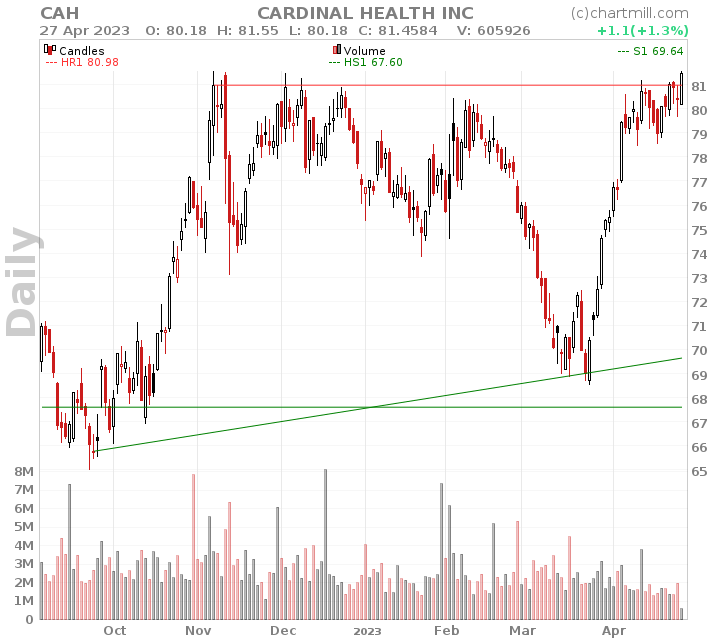
- R1 is the nearest resistance line, S1 the nearest support line on the daily chart. (WR1 and WS1 are the weekly counterparts). See also the support and resistance technical indicator article
- HR1 is the nearest horizontal resistance line, HS1 the nearest horizontal support line on the daily chart. (WHR1 and WHS1 are the weekly counterparts)
- HSR1 is a horizontal support/resistance lines on the daily chart, WHSR1 is the weekly counterpart. See also the support and resistance technical indicator article
- The ChartMill Channels identify support and resistance of the current trading range, their weekly counterparts are also available
- The Consolidated Support and Resistance are computed from several support and resistance indicators in different timeframes
In the video shown below, "ChartMill Academy Part 9 Support and resistance filter capabilities" we demonstrate through a number of examples the extensive filtering capabilities provided by the support and resistance tab.
Support and Resistance Trading Strategies
Support and resistance are powerful concepts for those who use technical analysis in determining entry and exit points.
You could even say that most trading strategies that are based on technical analysis use support and resistance analysis to some extent.
What support and resistance exactly means, and how to find and recognize such levels on a price chart can be read in our article "Support And Resistance: How To Find It?".
As Support and Resistance are levels where we expect price reversals or breakouts, we can identify the following support and resistance trading strategies:
Trading Reversals
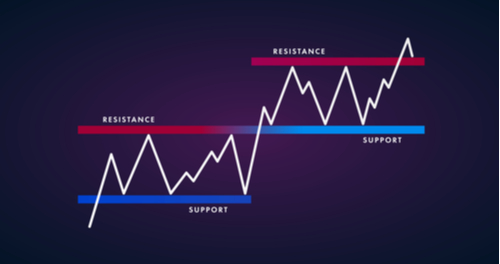
The basic premise of reversal trading is that prices move up and down within a certain range. Rising prices at the upper end of the range face resistance while falling prices find support at the lower end of the price range.
As a trader, you look for opportunities to go long if the price recovers from the support level. Short position opportunities occur when the price begins to fall again after reaching resistance.
Short stop losses ensure that the position is closed quickly once the stock effectively breaks through support or resistance.
Thus, there are two possibilities:
- Reversal at support: we expect a bounce from the support level, expect a limited downside, and use the support level to enter a stock.
- Reversal at resistance: we expect a bounce from the resistance level and enter a short trade around the resistance price level.
Trading Breakouts
Unlike reversal trading, breakout trading will involve waiting until there is an effective breakout above or below the respective resistance or support level.
After all, this is proof that a change is in progress in the chain of supply and demand. Demand exceeds supply when the breakout occurs on the upside. Precisely because there are a lot of interested buyers, the price of the stock is pushed through resistance. The reverse occurs when a downward breakout occurs causing the price to fall below support. This is a clear indication that there are no longer enough buyers willing to buy the stock around the support level up to that point.
Again, consequently, there are two options:
- Breakdown at support: we wait for the stock to break the support level and we enter a short trade once it is broken.
- A breakout through resistance: we wait for the stock to break the resistance level and enter a long trade once the resistance has been broken.
We will give some example screens for each of these strategies.
Reversal at Support
In this case, we see the support as a good area to enter a stock. As a basis, we may take the stocks nearing support screen. However, this screen does not take into account whether the stock is in an uptrend. By adding 1 additional filter (The ChartMill Technical Rating should be at least 7), we keep only the trending stocks. So now the screen shows trending stocks near a strong support line.
2 example results from this screen are:
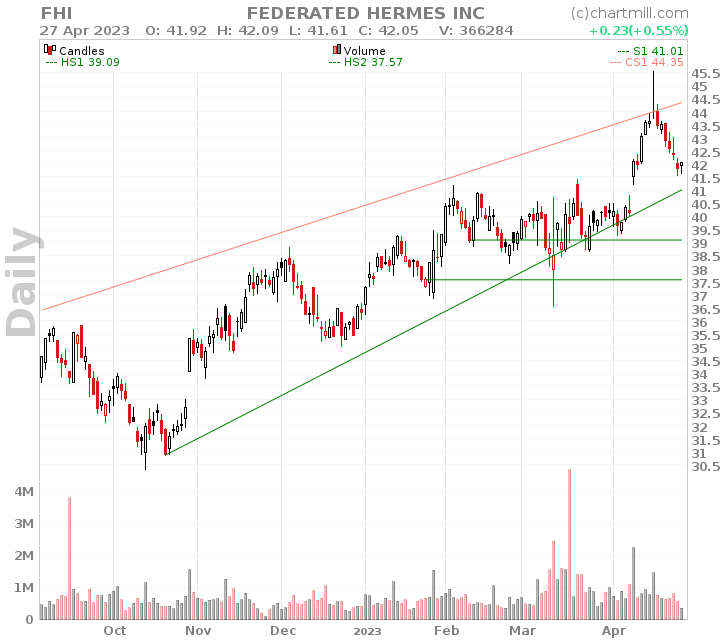
In both cases, low-risk entries are possible with a stop below the support zone. For the entry itself, it can always be a good idea to wait for the confirmation of the bounce, for instance by using a Buy Stop order. (= Only buy when the price exceeds a certain level).
Breakdown at support
By starting with the same screen as above, but filtering for stocks with a technical rating below or at 5, we get a list of stocks that are not as trending and nearing their support line. They may present an opportunity for shorting when the support line does not hold.
1 example results from this screen:
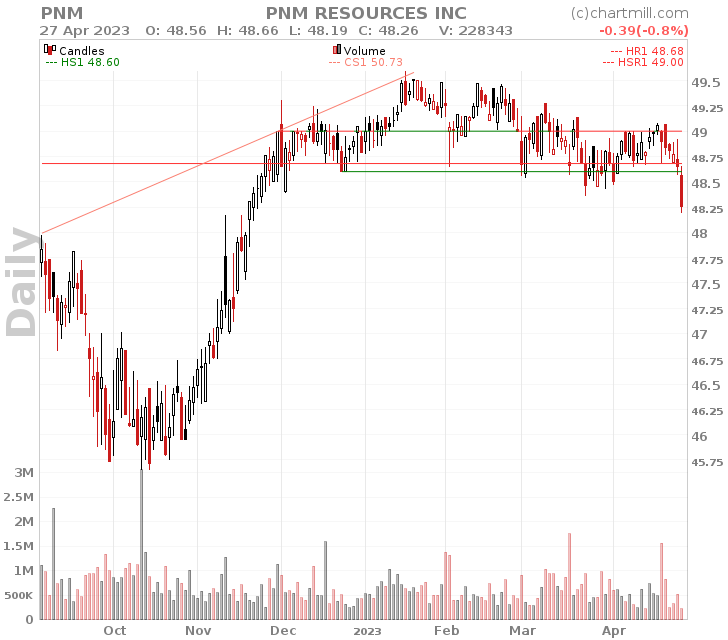
Note that screen results always need to be interpreted manually. The screener gives you a list of stocks that meet the criteria, but it is still up to the user to pick the best candidates for actual trading. Sometimes there will be no good fits. Also, when you do find good candidates, it is always a good idea to check whether there are no earning events planned nearby as they can have a significant impact on price.
In this case, for PNM Resources:
The stock has a closing price below the support line. A long red candle is visible. Taking into account that in the past there have been several false downward breaks, it is advisable to go short only when the price falls below the low of this last candle. At that moment the stop-loss can be placed just above the breakdown candle or, for more defensive traders, above the highest red horizontal line.
Reversal at Resistance
We use the stocks nearing resistance line, which looks for breakouts. Instead of strong stocks we just look for stocks with a weak TA rating. This screen looks for stocks nearing their resistance line while in a downtrend.
Example results are:
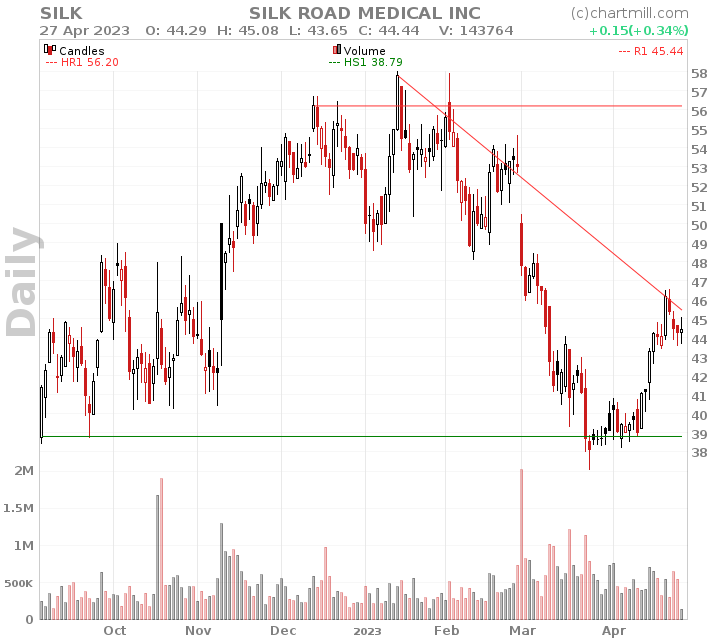
Both charts seem to be at a point where they could be shorted with a stop at a reasonable distance. Note the importance of a stop! There is never a way to predict what will happen, no matter how good the chart or general market conditions look.
A stop makes sure you can exit the position with a small loss should it go against you. Keeping your losses small is your most important task as a trader!
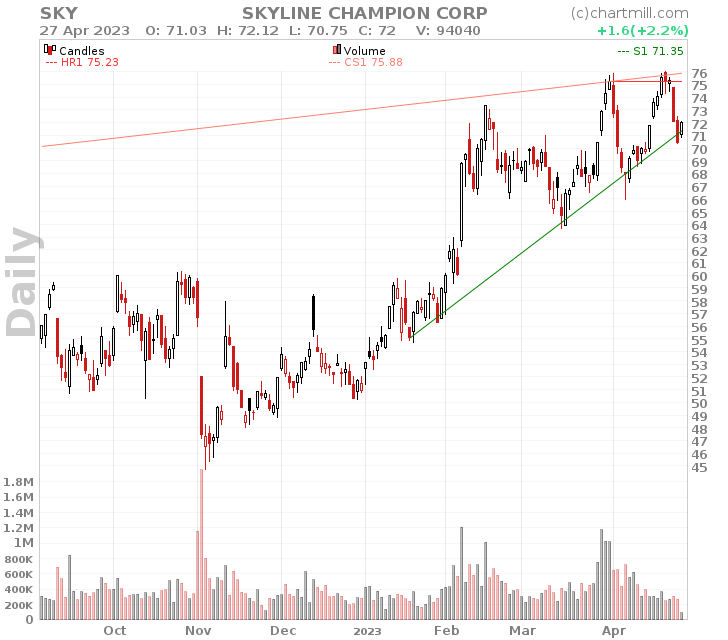
Breakout at Resistance
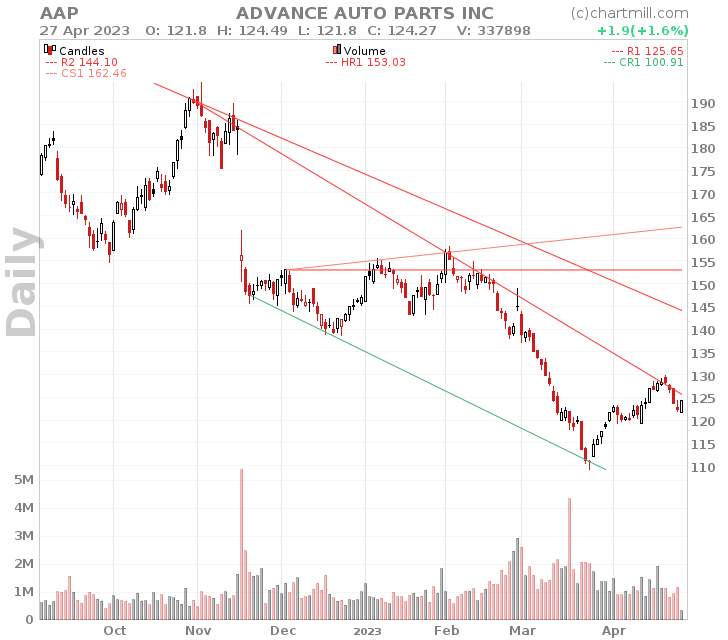
The stocks nearing resistance line from the trading ideas page is a good example of such a screen. The screen uses the strong stocks filter, so it is already configured to contain strong stocks and we are looking for stocks breaking their resistance.
In this case, we changed the trading idea to show only stocks that broke out above horizontal resistance. A great example to show how versatile the possibilities are with our stock screener!
At the time of writing one example springs out:
As always, the actual breakout is not a guarantee and several attempts may be needed before it happens (if it happens at all). But the psychology behind this is: many traders have a nice profit from the earlier move. When the stocks start basing, they may be tempted to sell to realize the profit.
The fact that there is a base formation points out that many other parties still think this is an interesting idea, even at these new prices, so they provide support. When the base formation lasts some time, lots of new shareholders (with no profit yet) will have a position in the stock. On a breakout, all these new shareholders will not be tempted to sell quickly (as they don't have a profit yet) which fuels a new move.
There is much more to say about trading breakouts, but that is beyond the scope of this article. Therefore, please refer to our article "When To Enter A Breakout Trade? 4 Different Ways To Master The Entry".