
The ChartMill High Growth Momentum Rating

The ChartMill High Growth Momentum Rating evaluates various aspects of high growth momentum stocks and summarizes them into one single rating.
The ChartMill Fundamental report already contains a growth rating, but that rating focuses more on past and future growth and is well suited to find stocks that are growing steadily (and can continue to grow). The High Growth Momentum Rating focuses more on short-term earnings momentum and is very well suited to identify stocks that typically emerge in CANSLIM and Minervini screens.
Aspects evaluated
While each of the items which make up the score can be screened individually in our stock screener, it is very useful to have an overall rating as sometimes interesting candidates may drop of the list because of a filter which is too tight, while the candidate scores well on every other aspect.
Our rating takes into account:
- The yearly EPS and Sales growth. (last year TTM)
- Q2Q EPS/Sales growth of the most recent quarters and the next quarter.
- FCF growth 1 year.
- Whether the EPS is positive or not
- Whether EPS and Sales are accelerating
- Whether the Profit Margin is expanding or not.
- Whether the company was able to surprise in recent quarters.
- Whether analysts have revised their estimates.
In short: Earnings and Sales growth, acceleration, expanding profit margins, surprises and revisions are all combined into a single rating and these are the typical aspects a high growth investor is looking for.
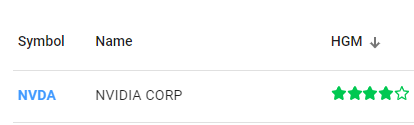
NVDA as an example.
An important point to note is that it is almost impossible to score 10 out of 10 on every aspect analyzed. A score of 6 or higher is already pretty good, even from 5 upwards there can be interesting companies on the list. But it is always good to understand exactly why a company gets a certain score, so you can dive into the details to evaluate it.
At the time of writing, NVDA is one of the companies with a score of 8 out of 10 and here we will show you why exactly.
The first thing to look at are the recent Q2Q numbers and surprises, which you can easily see in the table that can be inserted below your charts:
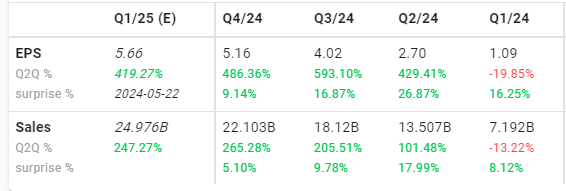
In this single picture, we can immediately see where the high rating is coming from:
- NVDA produced Q2Q numbers well above 400% for EPS and well above 100% for Sales growth.
- Sales Q2Q growth has been accelerating for 3 quarters in a row.
- We also see positive surprises everywhere, even above 10%,
- There was no EPS acceleration and there will be none going forward based on current estimates, so here some points are lost.
Finally, looking at the bottom of the estimates page, we see that NVDA also had positive revisions from analysts, which also contributes positively to the final score.
Notes
400%+ EPS growth is quite exceptional! For stocks with a score of 8 or higher, it's pretty obvious why that score is so high (and maybe you didn't need the score to discover NVDA). But the rating becomes very interesting to discover names that have a decent score but that - for whatever reason - may not have appeared on your radar before.
Stock Screening options and suggestions
We created 2 new ideas in our trading ideas screen library.
The first one can be used in addition to the many Minervini screens which are explained in the linked article at the beginning of this article. Our High Growth Momentum + TrendTemplate screen uses the Minervini Trend Template in combination with a High Growth Momentum Rating of at least 6. This single screen ensures positive price and earnings momentum and can replace the process of going through the different screens.
Our High Growth Momentum Breakout Setups Screen screen just uses ChartMill Ratings and finds High Growth Stocks with good technicals, showing a setup pattern.
Alternatively, you can easily combine the rating with:
- Bull flags
- Consolidations with Squeeze Plays
- Any other screen which identifies consolidations, pull backs or tight ranges