Stock Position Size Calculator
As an investor, limiting risk is crucial if you want to be consistently profitable over the long term. An investment strategy with a 90% success rate is meaningless if 1 losing position can cause you to lose a large portion (or all) of your investable capital.
An important part of risk management is inextricably linked to position sizing as this master thesis "Position-sizing Effects on Trader Performance: An experimental analysis," among others, demonstrates.
It should be clear that in addition to "why" and "when" you buy stocks, it is also important to consider how much you are investing and what risk you are running. Our Stock Position Size Calculator is the perfect tool for this!
Determining your risk
You should determine risk at two levels:
- The risk you face with the position itself; where do you place a stop loss? This is known as trading risk.
- The potential impact on your overall investment portfolio: what effect does an individual loss position have and what if you were unexpectedly faced with a complete loss of that position? This is referred to as account risk.
By properly mapping both issues in advance and delineating them to your trading style and risk profile, you avoid unpleasant surprises.
ChartMill’s Position Sizing Tool
The position size calculator built into ChartMill is capable of calculating your risk accurately. In this article, using a practical example, we will show you how to get started with our PST tool and what insights the results provide. After you submit some basic data you will find out with just a few clicks:
- The number of shares you can buy,
- The total investment concerning the available capital,
- The possible loss on your portfolio if you are stopped out at your anticipated stop loss,
- The cost associated with the purchase.
- The breakeven price is the minimum price level at which all costs incurred are covered if you sell the shares.
In addition, the tool can generate several alerts such as:
- When the investment in one position is too large relative to your total available investment capital.
- When the stock you wish to buy may have too great an impact on the liquidity of the stock (useful to avoid stocks with extremely low trading volumes).
- When the stop distance is set at less than 2 ATR, increasing the chance of being stopped out early during volatile price movements.
Position Size Calculator Example
Both on the Stock Charts and Stock Screener page, you can access the Position Sizing Tool in the blue horizontal bar by clicking on the appropriate icon (2). Make sure the view is set to 'Charts' (1).
The following screen appears:
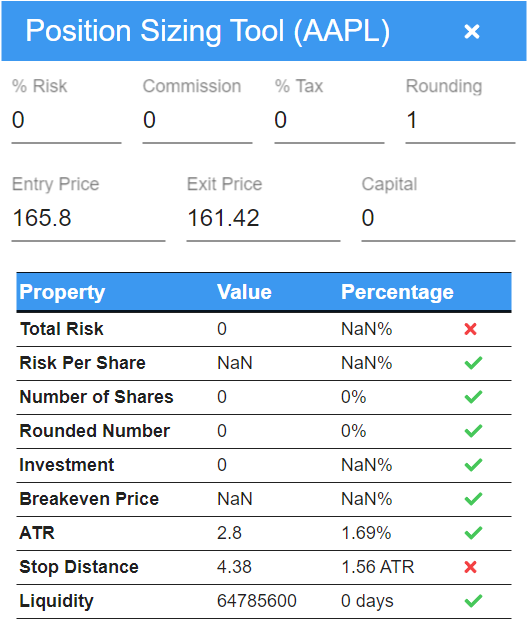
For the Entry Price and the Exit Price (stop loss), by default, the highest and lowest price of the most recent period is displayed on the selected chart. The tool restarts automatically as soon as you click on the chart of the stock you want to trade. We start with the parameters you need to fill in yourself:
Capital
This is the total amount of your investment portfolio with which you are trading. Let's use $25000 as an example.
Entry Price
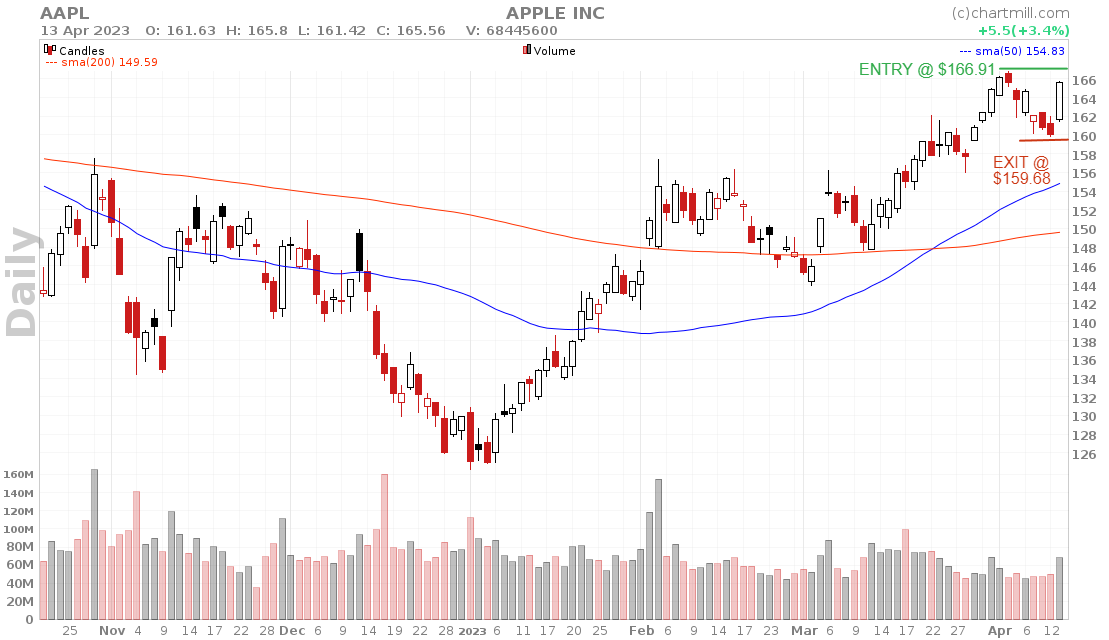
In the white box next to 'Entry Price' you enter the desired purchase price of the shares you will buy. On the date of April 14, Apple closed at 165.8. As an example, I set a buy price of $166.91 (slightly above the most recent swing high).
Exit Price
This is where you enter the stop loss, the price level at which the shares will be sold at a limited loss to protect capital. I change the stop loss to $159.68, just below the most recent swing low.
Rounding
By default, this box is set to 1. In that case, the exact number of shares specified will remain the same. However, if the number is set to 5, the tool will automatically change the number of shares to a multiple of five. I will leave this to 1.
% Risk
This percentage represents the total percentage of risk one is willing to take for each stock position relative to the total available risk capital. The exact percentage varies from trader to trader but is usually set at a minimum of 0.25% to 2.00% (maximum). In the example above, the percentage is set at 1.00%. I set a risk percentage of a maximum of 1. That means if the stop loss is hit, the loss will be a maximum of 1% of the total investment portfolio. Therefore, since in this example we have set the capital at $25000, the maximum will be $250.
Commission
The brokerage fee one must pay to acquire the shares is entered here. I enter $5 as an example. Of course, this will be different for everyone, depending on the broker you use and the number of shares you buy.
Tax
the tax on the transaction can be entered here (if applicable in your country). I will leave this blank.
The pst tool should now look like this:
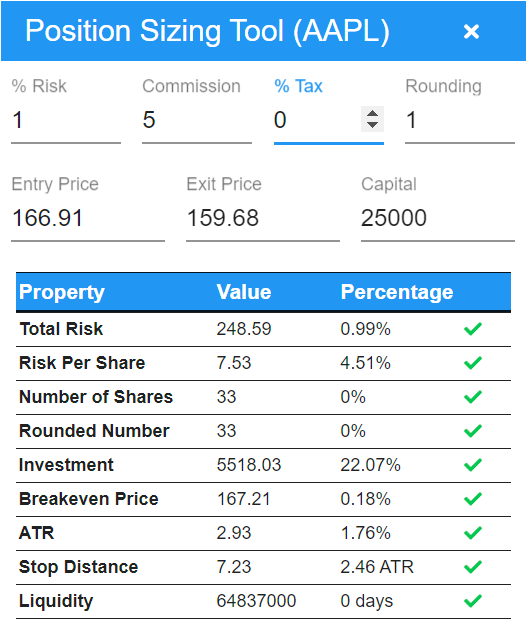
With all fields filled in, you will be given the following information from the tool:
Total risk
The amount you will lose if the set stop loss is hit. This also includes the costs. The height of this amount is determined by the previously set risk%. A red circle (warning) appears if the total risk for this position exceeds 2.5% of the set trading capital.
Risk per share
The difference between the purchase price and the stop loss level of the stock (including commission and costs). red circle if the risk per share is bigger than 15% of the price.
The number of shares
The number of shares you can buy with the set parameters. This number is determined by dividing the total risk by the risk per share. red circle if the desired number of shares is larger than 10% of the average daily volume (average over 20 days).
Investment
The total purchase price to buy the shares, including commission and any taxes. A red circle appears if the investment of the setup becomes more than 25% of the total trading capital.
Breakeven price
This parameter is closely related to the brokerage commission and tax costs. Many traders tend to underestimate this kind of cost, but this part of the position sizing tool clearly shows that we need to keep an eye on it. The breakeven price tells us how much the stock has to rise before we have recovered our brokerage commission and taxes. If the breakeven price is more than 2.50% higher (lower in case of a short position) than the entry price you will get a warning.
ATR
The Average True Range, or the volatility of a stock on a daily basis over a specific period. In the tool, the ATR is set to 22 days. The value of the average true range simply indicates how much a stock went up or down on average over the defined period. A high value indicates that prices change significantly during the day. A low number indicates that prices remain relatively constant. No warnings here, the value and percentage are only informative.
Stop distance
The difference between the entry price and the stop loss price without taking into account commission and any taxes. The stop distance is then converted into an ATR value. Red circle if the stop distance is less than twice the ATR value.
Liquidity
This number shows the average volume over a 20-day period. The percentage in the third column shows how many days it takes to cover the number of shares you wish to buy. The red circle is not applicable, the value and percentage are informative only.
Some Final Thoughts To Consider
Trade risk is not the same as account risk
The trade risk defines the total amount you lose if your stop loss is hit. Account risk, however, looks at the total size of the position and what effect there is on the total account if the position's valuation is suddenly worth nothing.
Example
Buying 1000 shares at $10 means an investment of $10,000. A stop loss at $9.5 would give a trade risk of $500 (2% on the invested capital). Applied to a $200,000 investment portfolio, this gives an account risk of 5% (200,000 / 10,000).
The same position with a $50,000 investment portfolio gives the same trade risk but the account risk is quite a bit higher, more specifically 20% (50,000 / 10,000).
Position management
The values you arrive at when using a position sizing tool apply before you enter a position. If a position evolves favorably after you enter it and you increase the stop loss to protect a larger part of your accumulated profit, your trade risk will decrease.
This affects your overall trade risk (the combined trade risk of all your open positions). However, until the position is effectively closed the account risk for each position remains the same, regardless of the virtual profit already realized on that position.
Conclusion
The importance of position sizing in the risk management of a trading account cannot be underestimated. The Position Size Calculator helps investors to calculate:
- the number of shares they can buy,
- the total investment relative to the available capital,
- and the potential loss on their portfolio if they are stopped out at their expected stop loss.
Moreover, this tool can generate several alerts if any of the set parameters leads to a potentially higher risk for the portfolio. Mitigating risk as much as possible is crucial for long-term profitability.