Price/Earnings-to-Growth Ratio (PEG)
Shares with a low P/E ratio remain popular with value investors, it is - alongside the P/S and P/B ratios - one of the most commonly used ratios to get a quick first impression about a company's valuation. However, it is by no means a perfect ratio, as it only looks at the profit in the past or current financial year, whereas it is the future performance that will determine the underlying valuation.
This is where the PEG ratio, which we take a closer look at in this article, offers a possible way out. It is a valuation measure that compares the P/E ratio with expected earnings growth in an attempt to get a more accurate picture of the true intrinsic value of a company. Consequently, the ratio is an extension of the P/E ratio where the "growth" parameter also becomes part of the formula. As with the classic P/E ratio, the lower the number obtained, the better.
Formula and explanation
Using this ratio, it's possible to discover attractive stocks that at first glance - when only the P/E ratio is taken into account - seem (very) expensive. However, these are stocks that promise solid growth.
PEG = P/E ratio ÷ annual earnings growth
It was Peter Lynch who introduced this ratio in his book 'One Up on Wall Street' in which he explained his thesis that seemingly expensive stocks can be interesting investments if there are clear indications that the company can continue to grow substantially. A PEG ratio of 1 is considered reasonable, in which case the P/E ratio is in line with the growth rate of the earnings. A lower ratio is a sign of undervaluation.
P/E versus PEG
Suppose we compare two industry peers. Company X has a P/E of 15 while company Y has a P/E of 30. Judging purely on this P/E figure, you would think that company X is the better choice. But that's without taking into account the rate at which the company is growing.
Suppose company X grows by 12%, then, one obtains a P/E growth ratio of 1.25 (15/12 = 1.25). However, Company Y, which has a significantly higher P/E ratio of 30, is growing at 35%. Hence, it results in a PEG ratio of only 0.86.
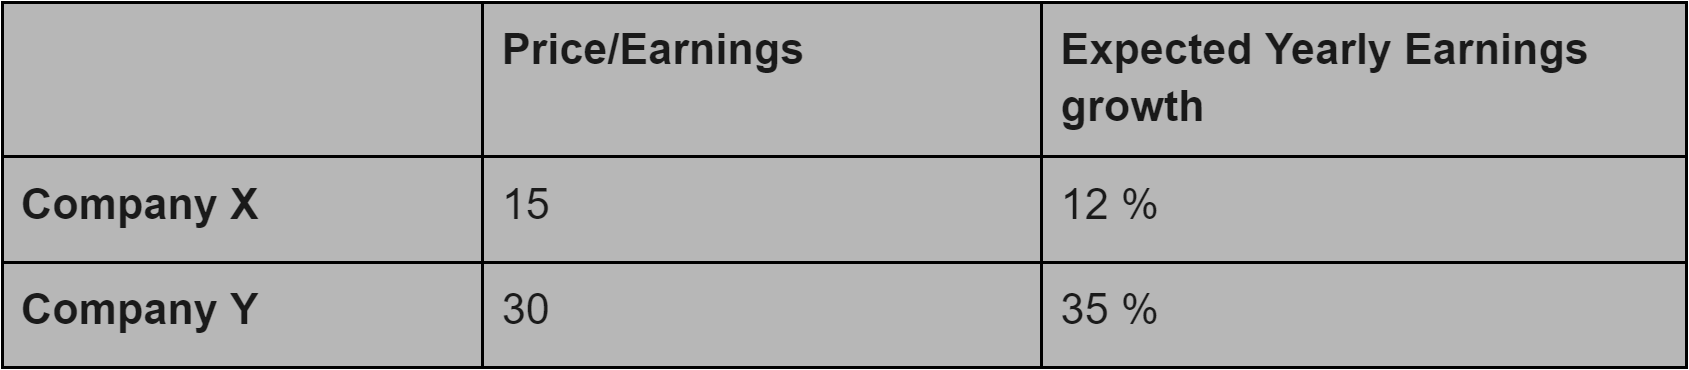
From this point of view (taking into account the growth rate), Company Y is a more interesting choice than Company X because it is trading at a discount to its growth rate. So it becomes perfectly justifiable to buy a company quoted at a high P/E of 30, but only if its growth rate can be maintained.
The disadvantage of this ratio undoubtedly lies in the fact that future growth requires an assumption. This ratio requires a prediction as to the future performance of the company. The accuracy of that prediction is closely related to how accurate the PEG ratio is.
In our stock screener, the PEG ratio is therefore available in two variants.
- PEG ratio (next year): this is based the forward price/earnings
- PEG ratio (past 5 years): it is based on the average earnings growth of the past five years. So in this case, it looks at past earnings growth in order to extrapolate over the future.
It is important to keep in mind that neither of these variants offer certainty. As already mentioned, assumptions about the future can be wrong, but so can a valuation that is arrived at based on historical data. Looking at and considering both possibilities may still be the best way to go.
Can the PEG-ratio be used for any type of business?
The above makes it clear that the ratio proves especially useful for companies that are still in a clear growth phase and use those profits exclusively to further finance their own growth. The ratio in this form is much less suitable for the really large mature companies that pay out a significant portion of their profits as dividends to shareholders. After all, they no longer focus on further significant growth.
For such dividend companies, the PEG ratio can still be used but in a modified format that also takes into account the dividend yield, being:
PEG = P/E ratio ÷ (annual earnings growth + dividend yield)
Let's have a look at an example. Company ABC has a P/E ratio of 23 and an expected growth rate of 18%. On top of that, the company pays an annual dividend to shareholders which corresponds to a dividend yield of 6%.
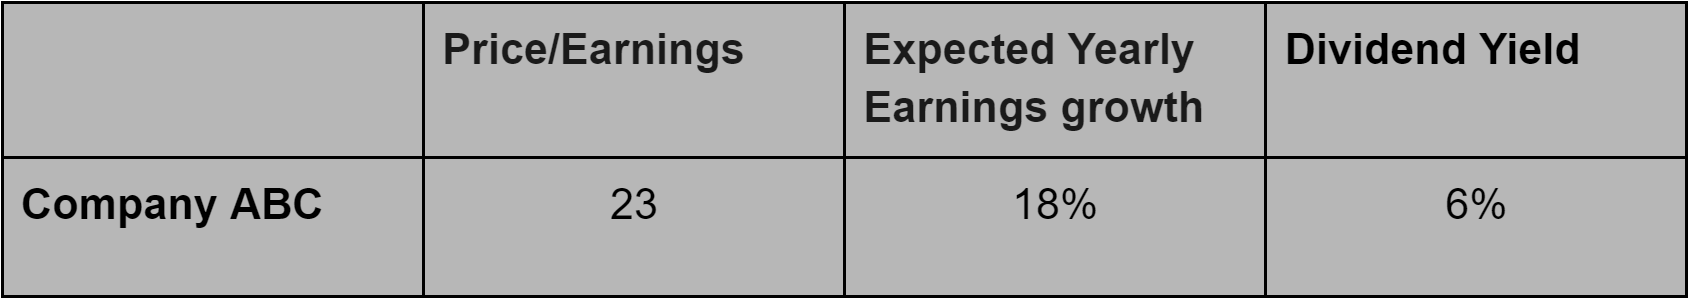
For the standard PEG ratio, which does not take into account the dividend yield, we would thus obtain a value of:
23/18= 1.27
However, if we also take into account the dividend yield, the formula changes as follows:
23/(18+6)= 0.96
By also taking into account the dividend yield in this case, one obtains a much more attractive PEG ratio < 1.
PEG-ratio screening filter example
This screen shows all US stocks with a market capitalization of at least 300 million, a minimum price of $5 and an average daily volume of at least 300,000 units traded. The peg ratio is set to maximum 1 and to exclude all dividend stocks, the ChartMill Dividend rating was set to 0.
Conclusion
The PEG ratio has the advantage over the ordinary P/E ratio that when determining the value of a company, the expected growth is also taken into consideration. In this way, it is sometimes justified to buy companies with a somewhat higher P/E ratio. However, keep in mind that expected growth is only an assumption and not a certainty. Moreover, one should also realize that valuing a company involves much more than merely looking at one or more quantitative ratios. More qualitative characteristics, such as management experience, competitive position, current market position,...etc., are also crucial to properly valuing the company.
Some other Valuation Ratios
Fundamental Valuation Filters
In this article we will discuss the fundamental filters related to the valuation of a stock. Read more...
