Trend Intensity Indicator
The Trend Intensity indicator measures the strength of the trend.
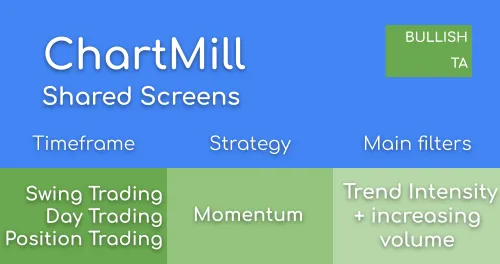
This screen finds stocks in a strong trend that are moving on increased volume. There is not necessarily a good entry point, if not it may still be interesting to put these stocks on a watch list.
The Trend Intensity indicator measures the strength of the trend.

In this article I will elaborate on a number of different screens that you can use to find qualitative momentum setups and I will go over a number of tweaks that allow you to fine-tune the screens so that they fit your personal situation even better.

In this video I’ll be covering 5 predefined momentum screening ideas from our Trading Ideas' section in ChartMill. Momentum trading means that you are primarily concerned with short-term positions. The intention is to buy stocks which are already rising and to sell them again quickly as soon as the first signs are visible that the rising is losing momentum. As an investor you try to benefit from the high volatility associated with the rise in this relatively short time.

Want to find strong momentum stocks in minutes? In this video, we’ll show you step-by-step how to use the ChartMill Stock Screener to quickly identify stocks with powerful trends, strong relative strength, and rising trading volume.
This finds stocks showing a strong uptrend.
This filters for stocks moving at least 2% up today.
This excludes stocks trading less than 500K shares per day.
This filters for stocks that show an increase in volume over the last 5 days.
Just the default chart settings.
Run this screen in your favorite region. You can always further fine tune the screen by changing the general settings after it opened in the screener.