Trade the Swing with the Force Index Indicator
Trade the Swing Strategy whereby the Force Index Indicator is used both as a trend indicator and as a buy or sell warning.
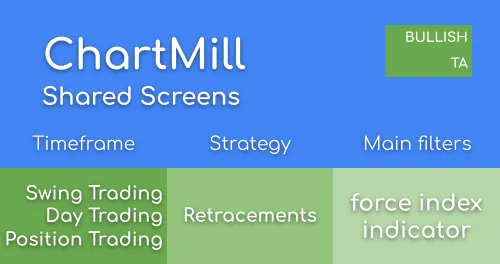
Look for minor price retracements in strong trends, using the Force Index Indicator
Trade the Swing Strategy whereby the Force Index Indicator is used both as a trend indicator and as a buy or sell warning.
The Force Index Indicator, developed by Alexander Elder, uses price change in combination with volume to identify the strength of a price movement.
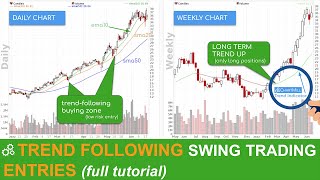
WHY TREND FOLLOWING? Typical trend investors have only three consecutive goals in mind: 1. Identify new potential long-term trends 2. Stay invested in clear strong trends as long as possible 3. Close positions as quickly as possible when it is clear that the trend has ended. Thus, the purpose of a Trend Following Swing Trading Strategy is not to predict tops or bottoms. The typical trend trader will try to identify the main trend before taking a position and then open a position in the direction of that prevailing trend in order to maximize potential profits. In this video we take a look at some trend following entry techniques.
In this video i’ll show the screening possibilities regarding the Force Index Indicator in ChartMill and a trading strategy whereby this indicator is used both as a trend indicator but also as a buy or sell warning signal.
Minor price drop
first sign of a rebound after decline in stock price
This filters for stocks with a minimum average daily volume of at least 300K. This filter ensures liquidity.
Increased volume supports the rebound
suggested minimum price, to be adjusted to your own preference.
Trend positive
suggested market, to be adjusted to your own preference.
Long term trend positive
5SMA, 10SMA and 20SMA + Force Index (2), Force Index (14) and Force Index (100)
Run this screen in your favorite region. You can always further fine tune the screen by changing the general settings after it opened in the screener.