
Fundamental Valuation Filters
A description of the fundamental filters related to valuation, like price/earnings, price/book, peg ratio

In depth documentation on fundamental indicators and ratios supported in the ChartMill analysis reports and stock screener.
A description of the fundamental filters related to valuation, like price/earnings, price/book, peg ratio

A description of the fundamental filters related to profitability, like ROE, ROA. Asset Turnover

Description of the fundamental indicators related to the health of a stock, like current ratio and quick ratio.

Fundamental analysis reports for growth, valuation, health, profitability and dividend.

A description of the fundamental properties related to stocks dividends, like dividend yield, dividend growth and dividend payout.

A description of the fundamental filters related to stock growth, like EPS and revenue growth.

The ChartMill Dividend Rating evaluates the yield, reliability and sustainability of a dividend
The Piotroski F-score, a proven method to identify undervalued financially sound quality stocks for your long-term portfolio
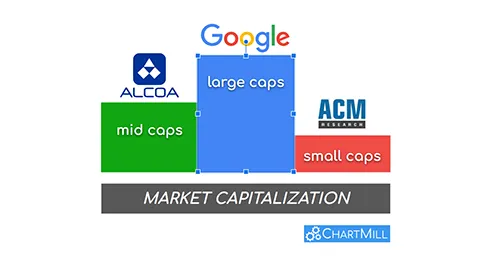
Market capitalization - along with price and volume - is one of the basic characteristics on which you can select stocks for your portfolio. It measures the overall relative size of a company which is calculated by multiplying all outstanding shares by the current price of the stock.

ROA stands for Return on Assets and is a widely used metric to examine how efficiently a company can use its assets (equity + debt) to increase its net profit.
The return on equity is often one of the first things investors check when looking for investment opportunities. It says a lot about profitability, and the ratio is calculated using two key indicators: net income vs. equity.
The ROIC ratio provides insight into the extent to which a company efficiently allocates capital to profitable investments or projects, thereby generating returns. Comparing the Return on Invested Capital to the weighted average cost of capital (WACC) reveals whether or not this is happening effectively.
Intangible assets are assets that are not physical in nature, such as buildings, vehicles or machinery. Nevertheless, they can represent an economic value under certain circumstances.
The WACC (Weighted Average Cost of Capital) is expressed as a percentage and represents the ratio of the cost incurred by the company in relation to the total capital used to finance the company.
An earnings surprise occurs when there is a significant difference between what was estimated in advance by analysts, based on the financial data known about a company, and the final publication of those earnings.
Gross Profit Margin, Operating Margin and Net Profit Margin are all financial metrics that help businesses and investors understand the profitability and efficiency of a company's operations.
The Altman Z-Score is a financial formula that is used to predict the probability of a firm going bankrupt. It was developed by Edward I. Altman, who was a professor at the NYU Stern School of Business. The score is calculated using a combination of five financial ratios that measure a company's ability to pay its debts.
Cash flow is the movement of money into or out of a business. It is the net amount of cash and cash-equivalents being transferred into and out of a business. Positive cash flow indicates that a company's liquid assets are increasing, while negative cash flow means that a company's liquid assets are decreasing.
Enterprise Value (EV) is a metric used in fundamental analysis to determine the value of a company. It is a useful ratio when comparing companies that have different levels of debt and present value, two aspects that enterprise value takes due account of, unlike some other valuation ratios.
P/E ratio = Stock price / Earnings per share (EPS). The ratio represents how many times a company's earnings are paid by investors on the stock market.
The P/S ratio is an important analysis and valuation tool for investors and analysts. The ratio shows how much investors are willing to pay per dollar of revenue.
The price-to-book value ratio values the company based on the market price to net assets. As with price/earnings and price/sales, it is a ratio that attempts to put a valuation on a publicly traded company.
Price/earnings to Growth (PEG) is a valuation measure that compares the P/E ratio with expected earnings growth in an attempt to get a more accurate picture of the true intrinsic value of a company.
When a company makes long-term investments in assets, these are considered capital expenditures (CapEx). Both tangible (land, buildings, machinery,...) and intangible assets (licenses, goodwill, patents,...) qualify. It can be either the purchase of new equipment or the maintenance/upgrading of already existing infrastructure.

The Price to Free Cash Flow ratio (P/FCF) is a valuation metric that compares a company's market price per share to its free cash flow per share. Free cash flow represents the cash generated by a company after accounting for its operating expenses, capital expenditures, and taxes.

Free cash flow per share is a financial metric that indicates the amount of cash generated by a company's operations after accounting for its capital expenditures (capex), interest expenses, and taxes.
DEBT/EBITDA represents the ratio of a company's total debt to its earnings before subtracting interest, taxes, depreciation and amortization. It is a popular indicator used to gain insight into a company's exposure to debt.
The debt-to-equity ratio represents the relative ratio of equity to debt. Both are used to finance a company's assets. The higher the ratio the higher the risk to the shareholder.

Return on Capital Employed or ROCE is a key figure that estimates the amount of profit a company can generate with the capital it uses. It is calculated by dividing earnings before interest and taxes (EBIT) by capital employed. The higher a company's ROCE, the more efficiently it uses its capital.

Free Cash Flow (FCF) margin is a financial metric that measures the percentage of revenue a company generates as free cash flow, relative to its total revenue.

Asset turnover is a financial metric that measures how efficiently a company utilizes its assets to generate revenue. It indicates the company's ability to generate sales from its assets, such as inventory, property, plant, and equipment.

The Debt/FCF Ratio offers valuable insights into a company’s ability to manage its debt obligations in relation to its free cash flow, providing investors with a nuanced perspective on financial strength and sustainability.

The Cash Conversion Ratio is a financial management tool that provides insights into how efficiently a company is converting its accounting profit into actual cash flow.

The interest coverage ratio, often referred to as the "debt-service ratio" or "times interest earned," is a crucial metric that sheds light on a company's ability to meet its interest obligations.

EBIT and EBITDA are both important financial metrics used to assess a company’s profitability. In this article, we examine the differences between the two ratios and provide guidance as to when it is best to use which of the two ratios when analyzing companies.

The ChartMill High Growth Momentum Rating evaluates different aspects of a high growth momentum stock and summarizes it into a single rating