
Navigating the Volatility: Bollinger Bands Explained
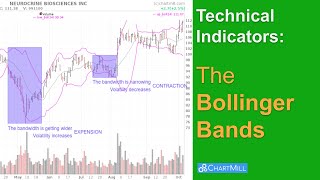
Bollinger Bands® is a dynamic indicator designed to measure volatility. It consists of three lines. A middle, upper, and lower band. The middle band is a simple moving average (SMA), set at 20 periods by default. The outer lines are standard deviations, representing the degree of price dispersion around that middle band.