Breakout Screens - Rising Wedge Pattern

Breakout Screens - Rising Wedge Pattern Image
RUN IN STOCK SCREENER
(7)

A rising wedge patterns is considered a reversal pattern within technical analysis. The wedge formation consists of a support and resistance line running in the same direction (upwards) but with different slopes. The formation gradually narrows until eventually the lower trend line is broken, leading to a sell setup.


Related Articles
Article Image

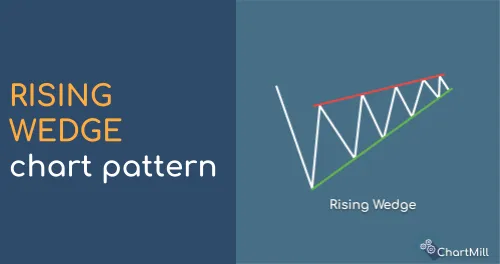
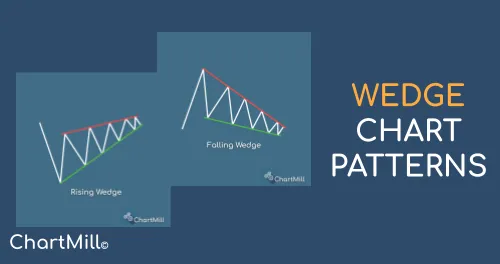
Wedge chart patterns

Wedge patterns are considered reversal patterns within technical analysis. The wedge formation consists of a support and resistance line running in the same direction but with different slopes. The formation gradually narrows until eventually the lower or upper trend line is broken, leading to a buy or sell signal.

Article Image

Rising Wedge Pattern

A rising wedge is a chart pattern characterized by two rising trend lines running in the same direction but with different slopes. The lower trend line is steeper than the upper trend line which in itself is a sign that buyers are moving increasingly faster into the market during intermediate price dips.

Related Videos

Video Image

Trading strategy for the wedge chart pattern

In depth explanation of the wedge chart pattern

Stock Screener Settings

Average Volume: 50 SMA > 200K

Minimum liquidity

Price: Above 5

Minimum price

Chart Patterns: Rising Wedge - ST

The rising wedge pattern filter

RUN
Chart Settings

Support and Resistance lines on the chart

Regional Run

Run this screen in your favorite region. You can always further fine tune the screen by changing the general settings after it opened in the screener.