Breakout Screens - Ascending Triangle Pattern

Breakout Screens - Ascending Triangle Pattern Image
RUN IN STOCK SCREENER
(87)

An Ascending Triangle Pattern is a bullish pattern and is formed when the price is trapped between horizontal resistance above and an upwards support trendline.


Related Articles
Article Image

Triangle Chart Patterns

Triangle patterns are well-known chart patterns within the field of technical analysis. They exist in different formations, bullish, bearish or symmetrical.

Article Image

Ascending Triangle Pattern | What is it? How to trade it?

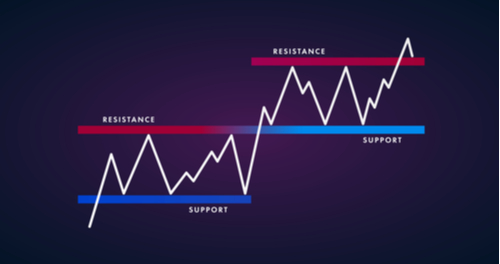
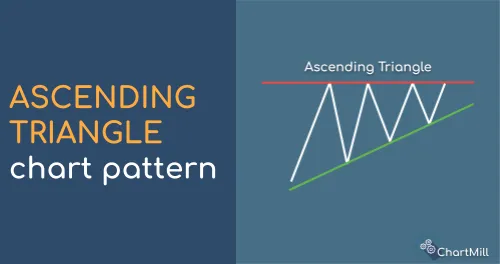
An ascending triangle is a bullish continuation chart pattern that forms when there is a strong upward trend in the price of an asset. It is characterized by a series of higher lows and a horizontal resistance area.

Article Image

Support and Resistance Stock Screener and Trading Strategies

The Stock Screener supports different support and resistance trading strategies. Some examples are listed in this article.

Related Videos

Video Image

What is the triangle chart pattern and how to trade it

In depth explanation of triangle chart pattern and how to use it

Stock Screener Settings

Average Volume: 50 SMA > 500K

Minimum Liquidity

Ascending Triangle

Showing an Ascending Triangle Pattern

Price: Above 20

Minimum price

RUN
Chart Settings

Support and Resistance lines on the chart

Regional Run

Run this screen in your favorite region. You can always further fine tune the screen by changing the general settings after it opened in the screener.