Mark Minervini - Trend Template + FA Screen 3

Mark Minervini - Trend Template + FA Screen 3 Image
RUN IN STOCK SCREENER
(38)

Trend Template + Decent Yearly Revenue Growth and Acceleration


Related Articles
Article Image

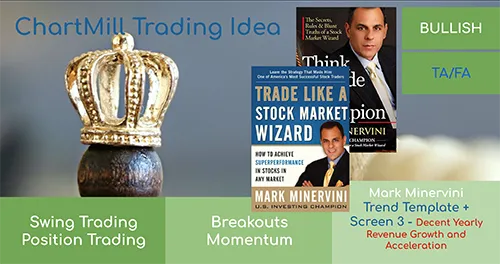
Mark Minervini Strategy | Think and Trade Like a Champion Part 1 | Technical and Fundamental Filters

Mark Minervini, two-time U.S. Investing Champion, uses a strategy that combines both technical and fundamental analysis with tremendous attention to risk management as the key to long-term success.

Article Image

Mark Minervini Strategy | Think and Trade Like a Champion Part 2 | Trading Strategy

Mark Minervini Strategy to Achieve Superperformance in Stocks in Any Market

Related Videos

Video Image

Stocks Setup- and Watchlist | March 25 - 2024 (Before Market Open)

Weekly setup- and watchlist before market opening. The screening is done based on last Friday's closing prices.

Video Image

Mark Minervini Screens in ChartMill - Part II - Trading Strategy Example Setups

How I use the different Minervini screens to find stocks that meet the criteria for this trading strategy and how they are further analyzed to arrive at real setups is covered in this video.

Video Image

Mark Minervini Screens in ChartMill - Part I - Trend Template and Fundamental Filters

In this video, we discuss some Mark Minervini screens we recently added in ChartMill based on two books by Mark Minervini, two-time US Investing Champion (1997 and 2021).

Video Image

A Swing Trading Workflow Using the Stockscreener ChartMill

In this video i share my daily ChartMill swing trading workflow , using the Minervini Screening Filters.

Video Image

Stocks Setup- and Watchlist | March 18 - 2024 (Before Market Open)

My current setup- and watchlist before market opening. The screening is done based on last Friday's closing prices.

Stock Screener Settings

(high>=(high52Weeks*0.75))

Current high within 25% of 52-week high

sma200: SMA(200) Rising

Long-term trend bullish

Price VS SMA: Price Above SMA(150)

Medium-term price trend up

CRS>=70

Solid Relative Strength

sma50: SMA(50) Above SMA(200)

Short-term trend positive 2

Price VS SMA: Price Above SMA(200)

Long-term price trend up

Average Volume: 50 SMA > 100K

Decent liquidity

Exchange: US Only

Only US stocks

Price VS SMA: Price Above SMA(50)

Short-term price trend up

sma50: SMA(50) Above SMA(150)

Short-term trend positive 1

(close>=(low52Weeks*1.3))

Current close at least 30% higher than 52-week low

Revenue growth 3Y>=15%

Decent revenue growth long-term

EPS/Revenue acceleration: Revenue acc. last FY

Decent revenue growth acceleration last year

sma150: SMA(150) Above SMA(200)

Medium-term trend positive

RUN
Chart Settings

Daily timeframe

Regional Run

Run this screen in your favorite region. You can always further fine tune the screen by changing the general settings after it opened in the screener.