The Bullish Hammer Candlestick Pattern in Technichal Analysis
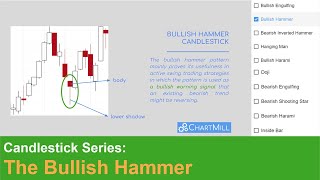
Candlesticks come in all shapes and sizes, they are used as a component within technical analysis.. One of them is the bullish hammer. This specific candlestick pattern mainly proves its usefulness in active swing trading strategies in which the pattern is used as a warning signal that an existing bearish trend might be reversing.
By combining this pattern with other candlesticks before and after the bullish hammer itself, even real reversal signals arise, consisting of several consecutive candlesticks, which benefits the reliability of the signal.