3 Bar Play
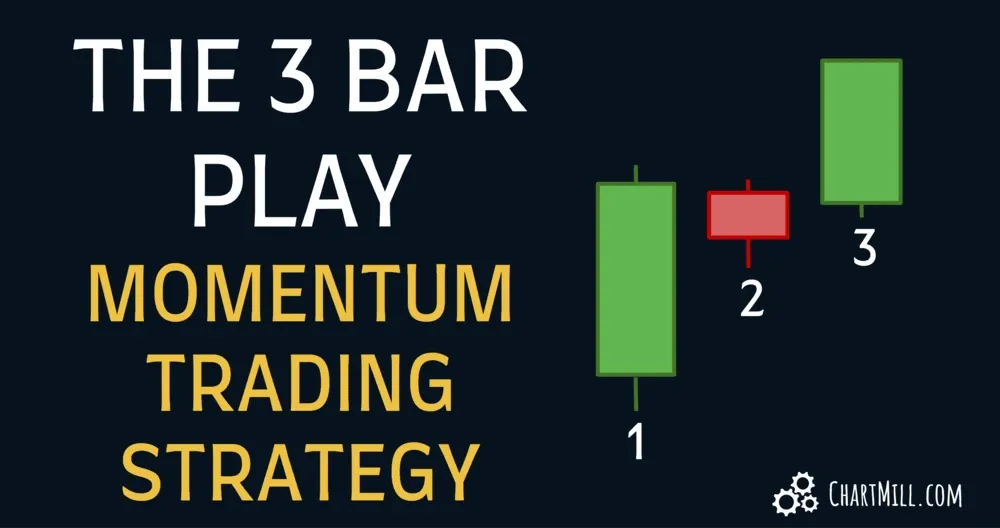
The 3 Bar Play is a bullish continuation pattern that appears after a stock has made a strong directional move. It signals that a brief pause in price is likely to be followed by a continuation in the same direction.
Stock Screener Settings
(previousHigh<=(previousClose*1.03))
Defining the previous bar's High and Closing Price
Exchange: US Only
Only US Stocks
(high<=(previousHigh*1.005))
Defining relation between the latest and previous bar
Price VS SMA: Price Above SMA(200)
Long Term Trend Positive
(previousHigh>=high10days)
Defining relation between previous and latest bar
Price: Below 100
Maximum Price
Average Volume: 50 SMA > 200K
This filter ensures liquidity.
(high>=(previousHigh*0.995))
Defining relation between the latest and previous bar
Price: Above 5
Minimum Price
(low>=(previousOpen*1.01))
Defining relation between latest and previous bar
(previousClose>(previousOpen*1.03))
Defining the previous bar's closing and openings price
Chart Settings
Daily Candles
Regional Run
Run this screen in your favorite region. You can always further fine tune the screen by changing the general settings after it opened in the screener.