
Bullish Engulfing Candlestick Pattern - Definition and usage
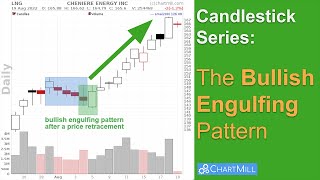
A bullish engulfing pattern is a technical analysis, two-candlestick pattern signaling a potential trend reversal. It occurs when a downward bearish candlestick is followed by a larger upward bullish candlestick which completely engulfs the body of the previous candle.