Bull Flag Chart Pattern Explained
Discover the bull flag chart pattern—a continuation pattern signaling strong uptrends. Learn how to identify and trade this setup with practical examples and expert tips.
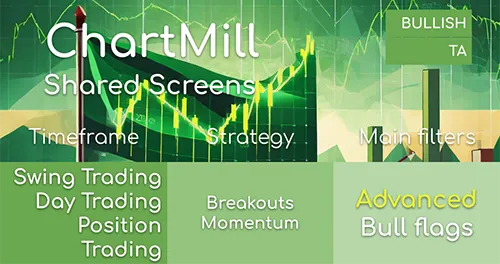
Only stocks in bullish trend, showing strong price run-up, decent relative strength and diminishing volume in the flag itself.
Discover the bull flag chart pattern—a continuation pattern signaling strong uptrends. Learn how to identify and trade this setup with practical examples and expert tips.
This Bull Flag Trading guide explains how to take advantage of the pattern, both as a swing and day trader.
Discover the High Tight Flag pattern – one of the most powerful breakout setups in technical analysis. Learn how to identify, trade, and maximize gains from this rare but explosive chart pattern.
In this video, we break down one of the most explosive chart patterns in technical analysis: the High Tight Flag.
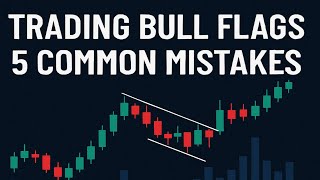
Are you struggling to trade bull flag patterns successfully? In this video, we break down the 5 most common mistakes traders make when trading bull flags — and how you can avoid them to improve your results.

In this video, I show you how to use the ChartMill stock screener to find these types of setups.
Only US stocks
Medium-term trend positive
Sufficient liquidity
Short-term trend positive 2
Short-term trend positive 1
Less volume in the flag itself
Current high within 25% of 52-week high
Length of Flag Pole higher than 10%
Solid relative strength
Long-term price trend up
Short-term price trend up
Pattern recognition
Current close at least 30% higher than 52-week low
Medium-term price trend up
Long-term trend bullish
Daily timeframe
Run this screen in your favorite region. You can always further fine tune the screen by changing the general settings after it opened in the screener.