
Bull Flag Chart Pattern Explained
Discover the bull flag chart pattern—a continuation pattern signaling strong uptrends. Learn how to identify and trade this setup with practical examples and expert tips.
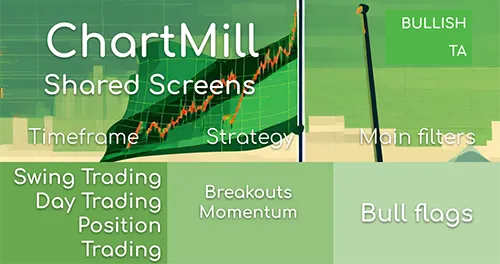
This screen finds bull flag patterns. A bull flag is a technical continuation pattern which can be observed in stocks with strong uptrends. The pattern takes shape when the stock retraces by going sideways (or by slowly declining) after an initial big rise in price. When you see the graphical representation of this pattern, you’ll notice that it somehow looks like a flag on a pole.
Discover the bull flag chart pattern—a continuation pattern signaling strong uptrends. Learn how to identify and trade this setup with practical examples and expert tips.
This Bull Flag Trading guide explains how to take advantage of the pattern, both as a swing and day trader.

In depth explanation of the bullish flag pattern
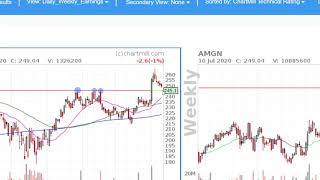
In this video I discuss a number of potentially interesting shares that were spotted with the predefined screens in our stock screening tool Chartmill. At the same time I show you how to manage your risk properly using the position sizing tool.
Are you struggling to trade bull flag patterns successfully? In this video, we break down the 5 most common mistakes traders make when trading bull flags — and how you can avoid them to improve your results.

In this video, I show you how to use the ChartMill stock screener to find these types of setups.
This filters for a minimum average daily volume of 500K to ensure liquidity.
This filters for the bull flag pattern.
The Flag pattern is shown on the charts.
Run this screen in your favorite region. You can always further fine tune the screen by changing the general settings after it opened in the screener.