
Mean Reversion Stock Screener
Use the stock screener to find mean reversion trading ideas
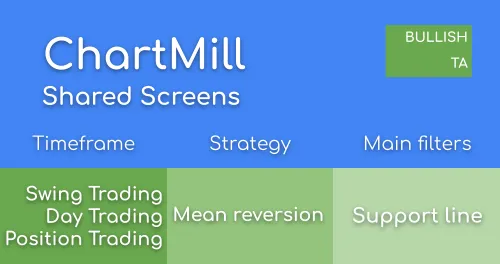
This screen finds stocks approaching a strong support line and where there may be opportunities to buy the stock.
Use the stock screener to find mean reversion trading ideas
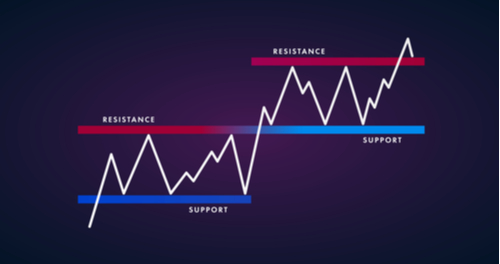
The Stock Screener supports different support and resistance trading strategies. Some examples are listed in this article.
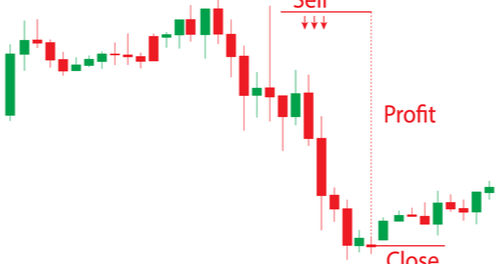
A collection of screens to find good short trading candidates.
This filter excludes all stocks that are trading below 5 dollar.
This filter finds stocks that are trading above, but close to the support line
This filter excludes all stocks that have a lower daily average volume than 500K.
This filter excludes all non US stocks.
This filter excludes all ETFs.
The support line should have a minimum length of 50 days.
The support line should have a minimum strength of 4. This means that the support line was tested at least 4 times in the past.
The support line is shown on the charts.
Run this screen in your favorite region. You can always further fine tune the screen by changing the general settings after it opened in the screener.