

(All data & visualisations by ChartMill.com)
Daily Market Trend Analysis – November 19, 2025 (After Market Close)
The charts show that while large caps (QQQ, SPY) are attempting to stabilize, small caps are under notable pressure, a classic sign of narrowing leadership.
Short Term Trend
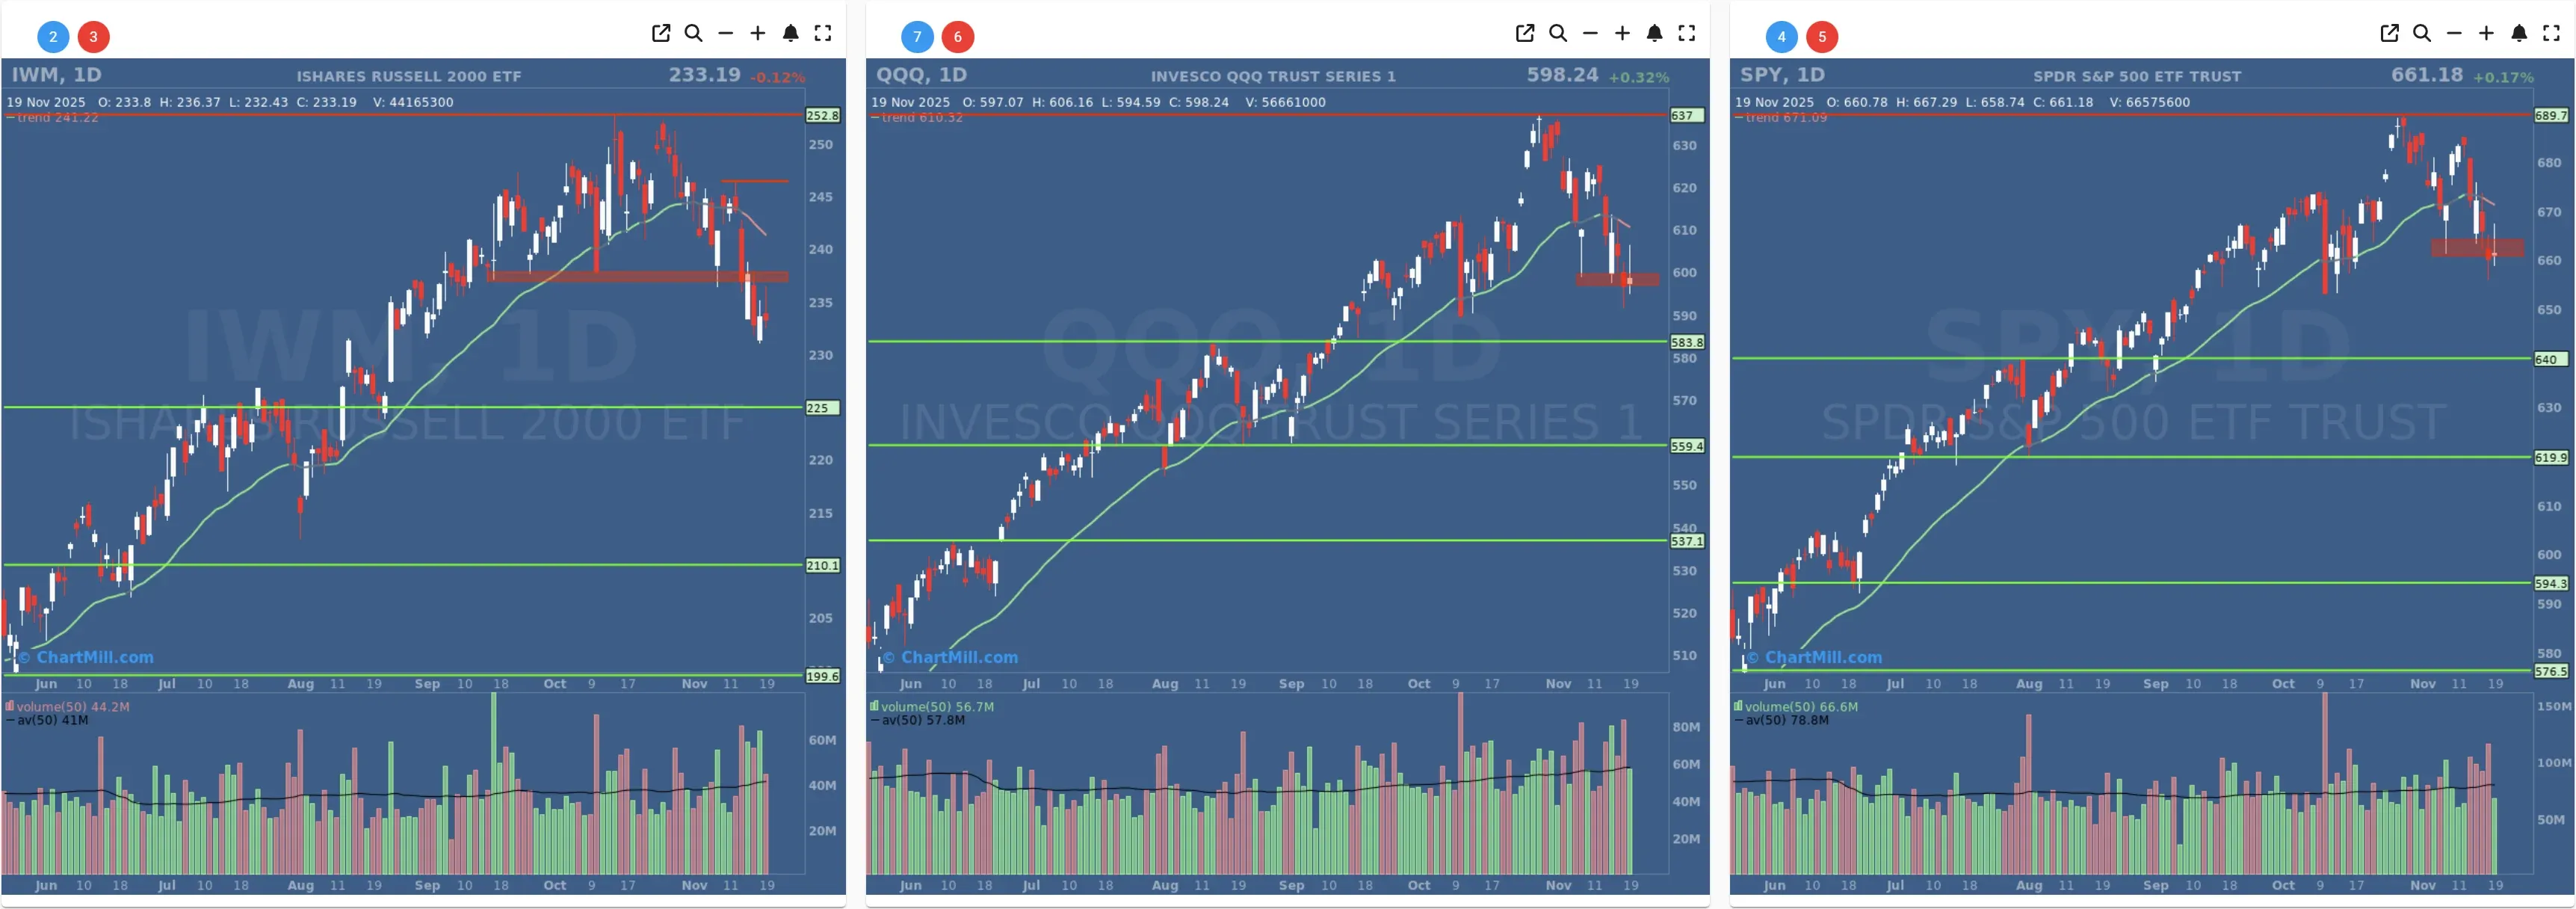
- Short-Term Trend: Negative (no change)
- Next Support at $652
- Next Resistance $660 - $670
- Volume: Below Average (50)
- Pattern: Up Day - Doji Candle
- Short-Term Trend: Negative (no change)
- Next Support at $589
- Next Resistance $600
- Volume: At Average (50)
- Pattern: Up Day - Doji Candle
- Short-Term Trend: Negative (No Change)
- Next Support at $225
- Next Resistance at $236
- Volume: At Average (50)
- Pattern: Down Day - Doji Candle
Long Term Trend

- Long-Term Trend: Positive (no change)
- Long-Term Trend: Positive (no change)
- Long-Term Trend: Positive (no change)
Daily Market Breadth Analysis – November 19, 2025 (After Market Close)
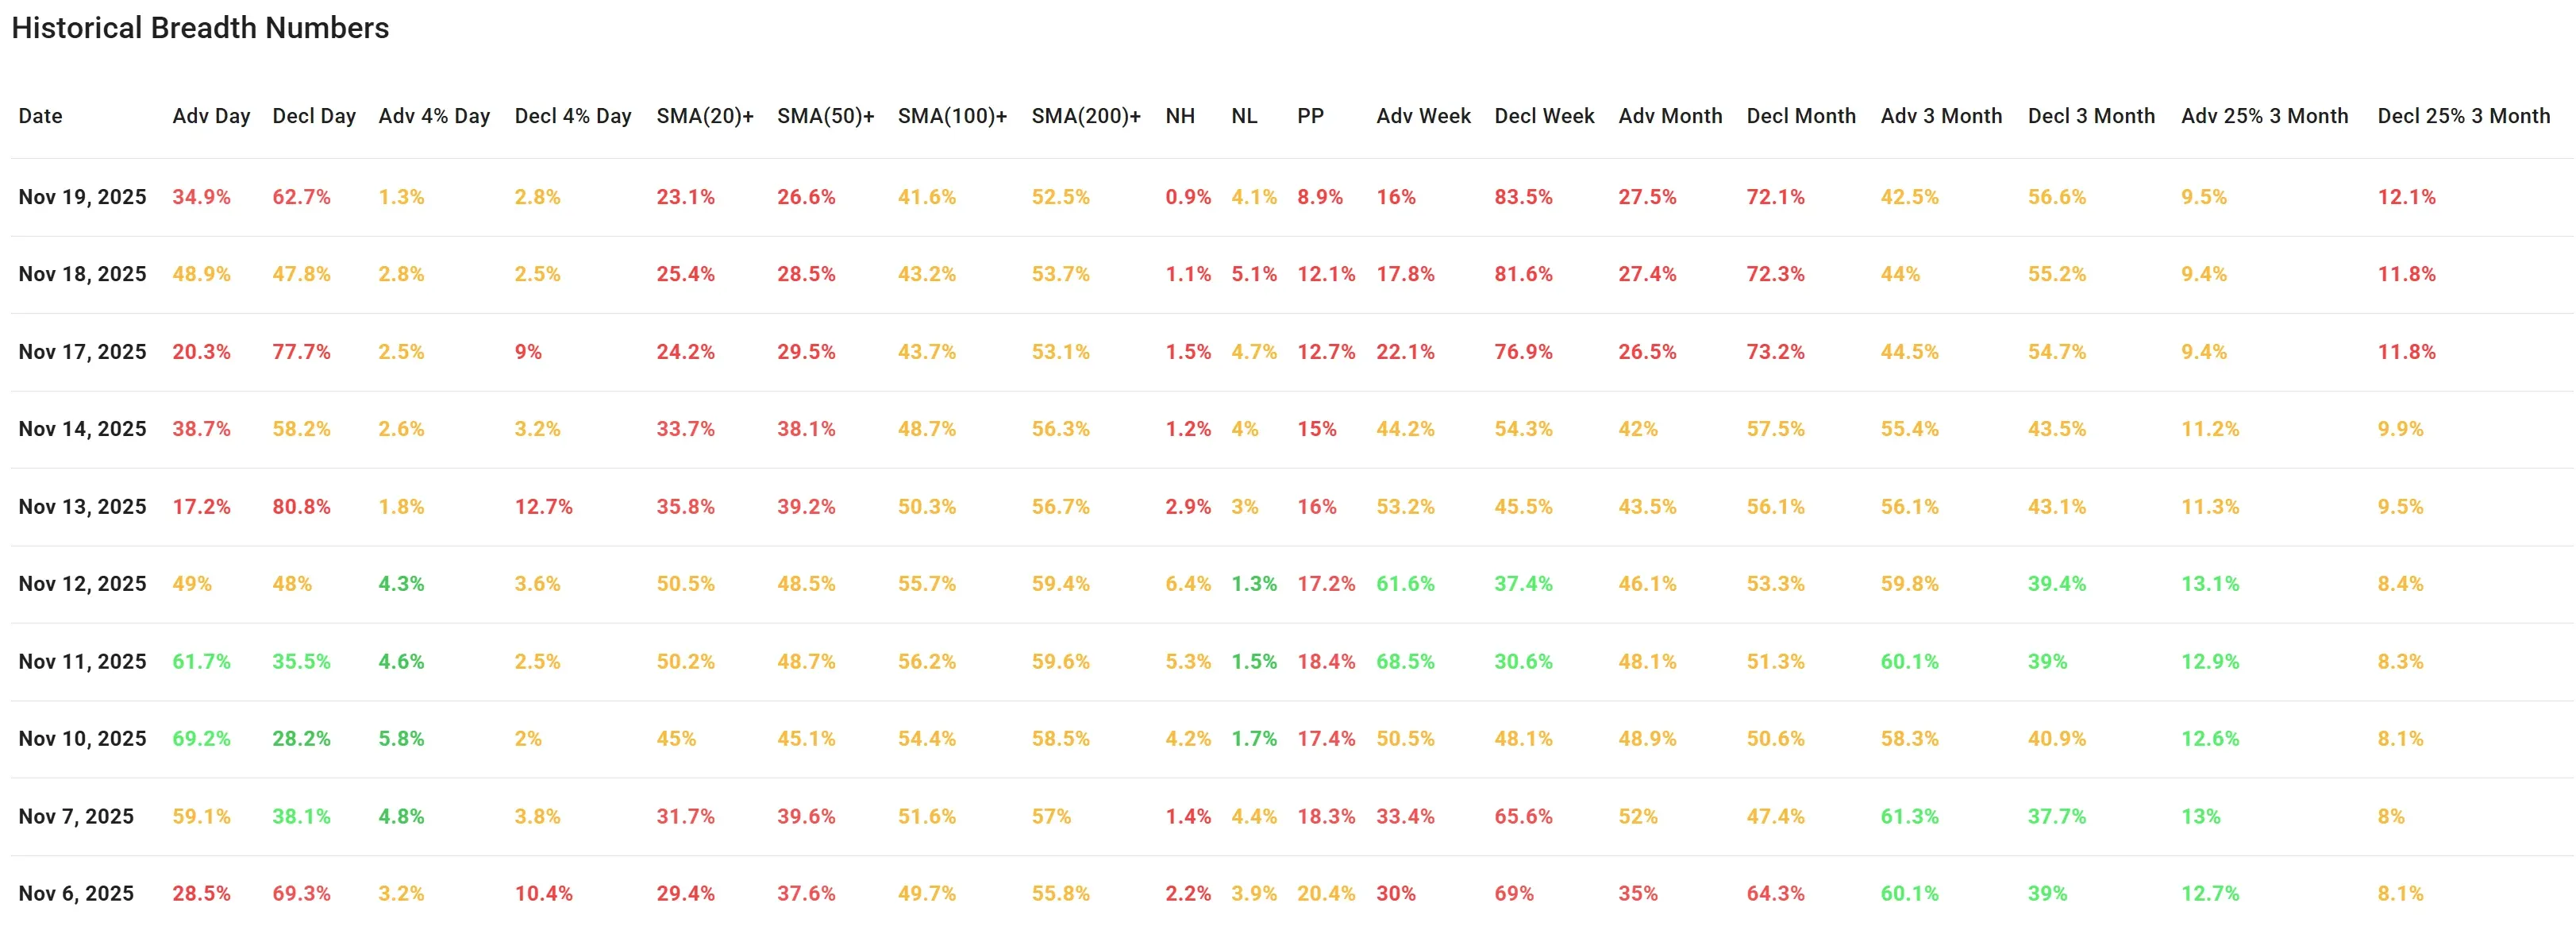
After a one-day reprieve, market breadth deteriorated once more on Wednesday, confirming that the bounce earlier in the week lacked internal strength. While headline indices like the QQQ and SPY managed slight gains, breadth data and small-cap performance painted a very different - and far more cautious - picture.
Breadth Metrics Confirm Renewed Weakness
The overall percentage of advancing stocks dropped sharply:
-
Advancing stocks: 34.9% (down from 48.9% on Monday)
-
Declining stocks: 62.7%
-
Stocks up more than 4%: 1.3%
-
Stocks down more than 4%: 2.8%
This is a noticeable reversal from Monday’s near-even split between advancers and decliners. Moreover, the number of significant advancers (4%+) fell, while moderate downside pressure grew, not as extreme as Nov 13 or 17, but confirming the market remains under distribution.
The percentage of stocks above key moving averages also deteriorated slightly:
-
SMA(20): 23.1% (down from 25.4%)
-
SMA(50): 26.6% (down from 28.5%)
-
SMA(100): 41.6%
-
SMA(200): 52.5%
The decline in SMA(20) and SMA(50) participation reflects fading short-term momentum. Longer-term breadth metrics have not broken down yet, but there’s a clear risk of further erosion if current weakness persists.
New Highs vs. New Lows Deteriorate Again
-
New Highs (NH): 0.9% (vs. 1.1% on Monday)
-
New Lows (NL): 4.1% (vs. 5.1%)
The new lows remain elevated and new highs continue to shrink, a bearish signal for breadth. This confirms the internal market pressure seen in the declining SMA levels.
ETF Charts: SPY, QQQ, IWM
IWM (Russell 2000): Broke below short-term support and failed to hold the prior base around $236. The close at $233.19 and strong red candle suggest the small-cap segment is leading on the downside.
QQQ (Nasdaq 100): Held relatively better, closing slightly higher at $598.24 (+0.32%), but remains stuck in a short-term downtrend. The bounce from the $590–595 support zone is unconvincing without stronger participation.
SPY (S&P 500): Closed modestly higher at $661.18 (+0.17%) but still within a weak downtrend channel. Tuesday's action looks more like a bear flag than a true reversal.
The charts show that while large caps (QQQ, SPY) are attempting to stabilize, small caps are under notable pressure, a classic sign of narrowing leadership.
Breadth Trend Rating
Based on the deterioration in breadth metrics, the renewed weakness in small caps, and failure to follow through on Monday’s improvement:
→ Breadth Trend Rating: Negative
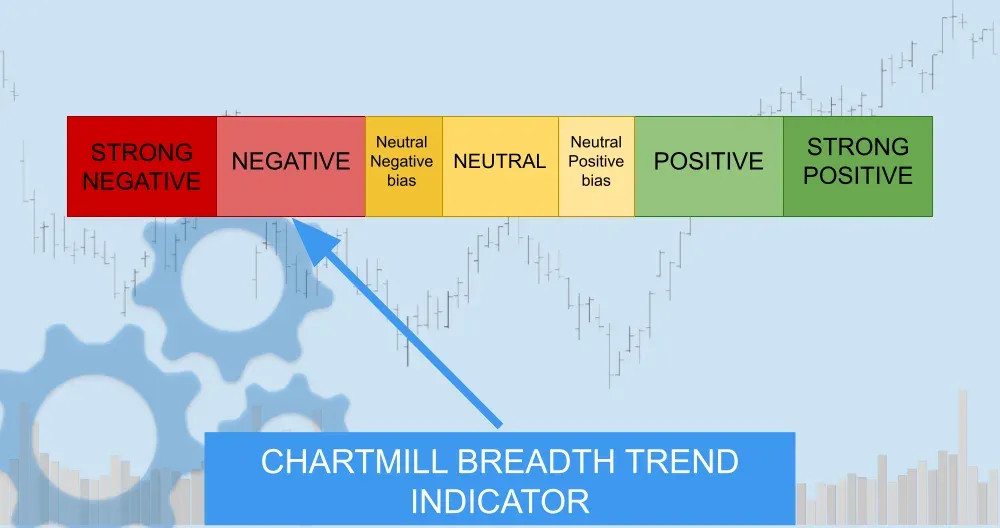
This maintains the same rating as Wednesday’s assessment. While the weakness is continuing, the trend has not yet worsened enough to warrant a further downgrade, but risks are clearly elevated, and any further deterioration may push this lower in the coming days.
Conclusion
Despite surface-level stability in major indices, the internal market picture is weakening again.
A resilient tech sector (QQQ) is masking the underlying fragility, particularly in the broader market and small caps (IWM). This divergence should be monitored closely, as it could set the stage for further volatility if leadership falters.
Unless we see a broad-based improvement in advancing volume and percentage of stocks reclaiming key moving averages, caution remains warranted.
Kristoff - ChartMill
Next to read: Nvidia Blasts Past Expectations and Pulls Wall Street Out of Its Slump