(All data & visualisations by ChartMill.com)
Daily Market Trend Analysis – November 24, 2025 (After Market Close)
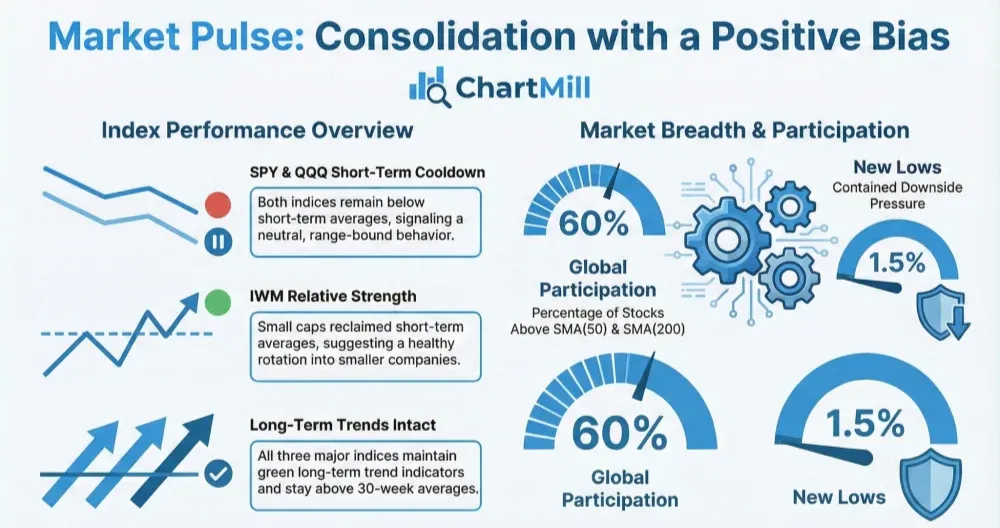
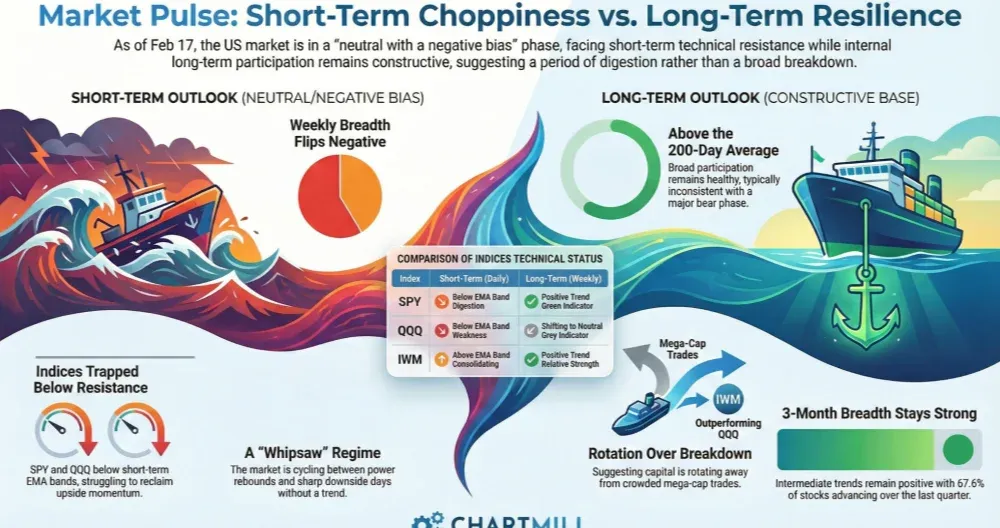
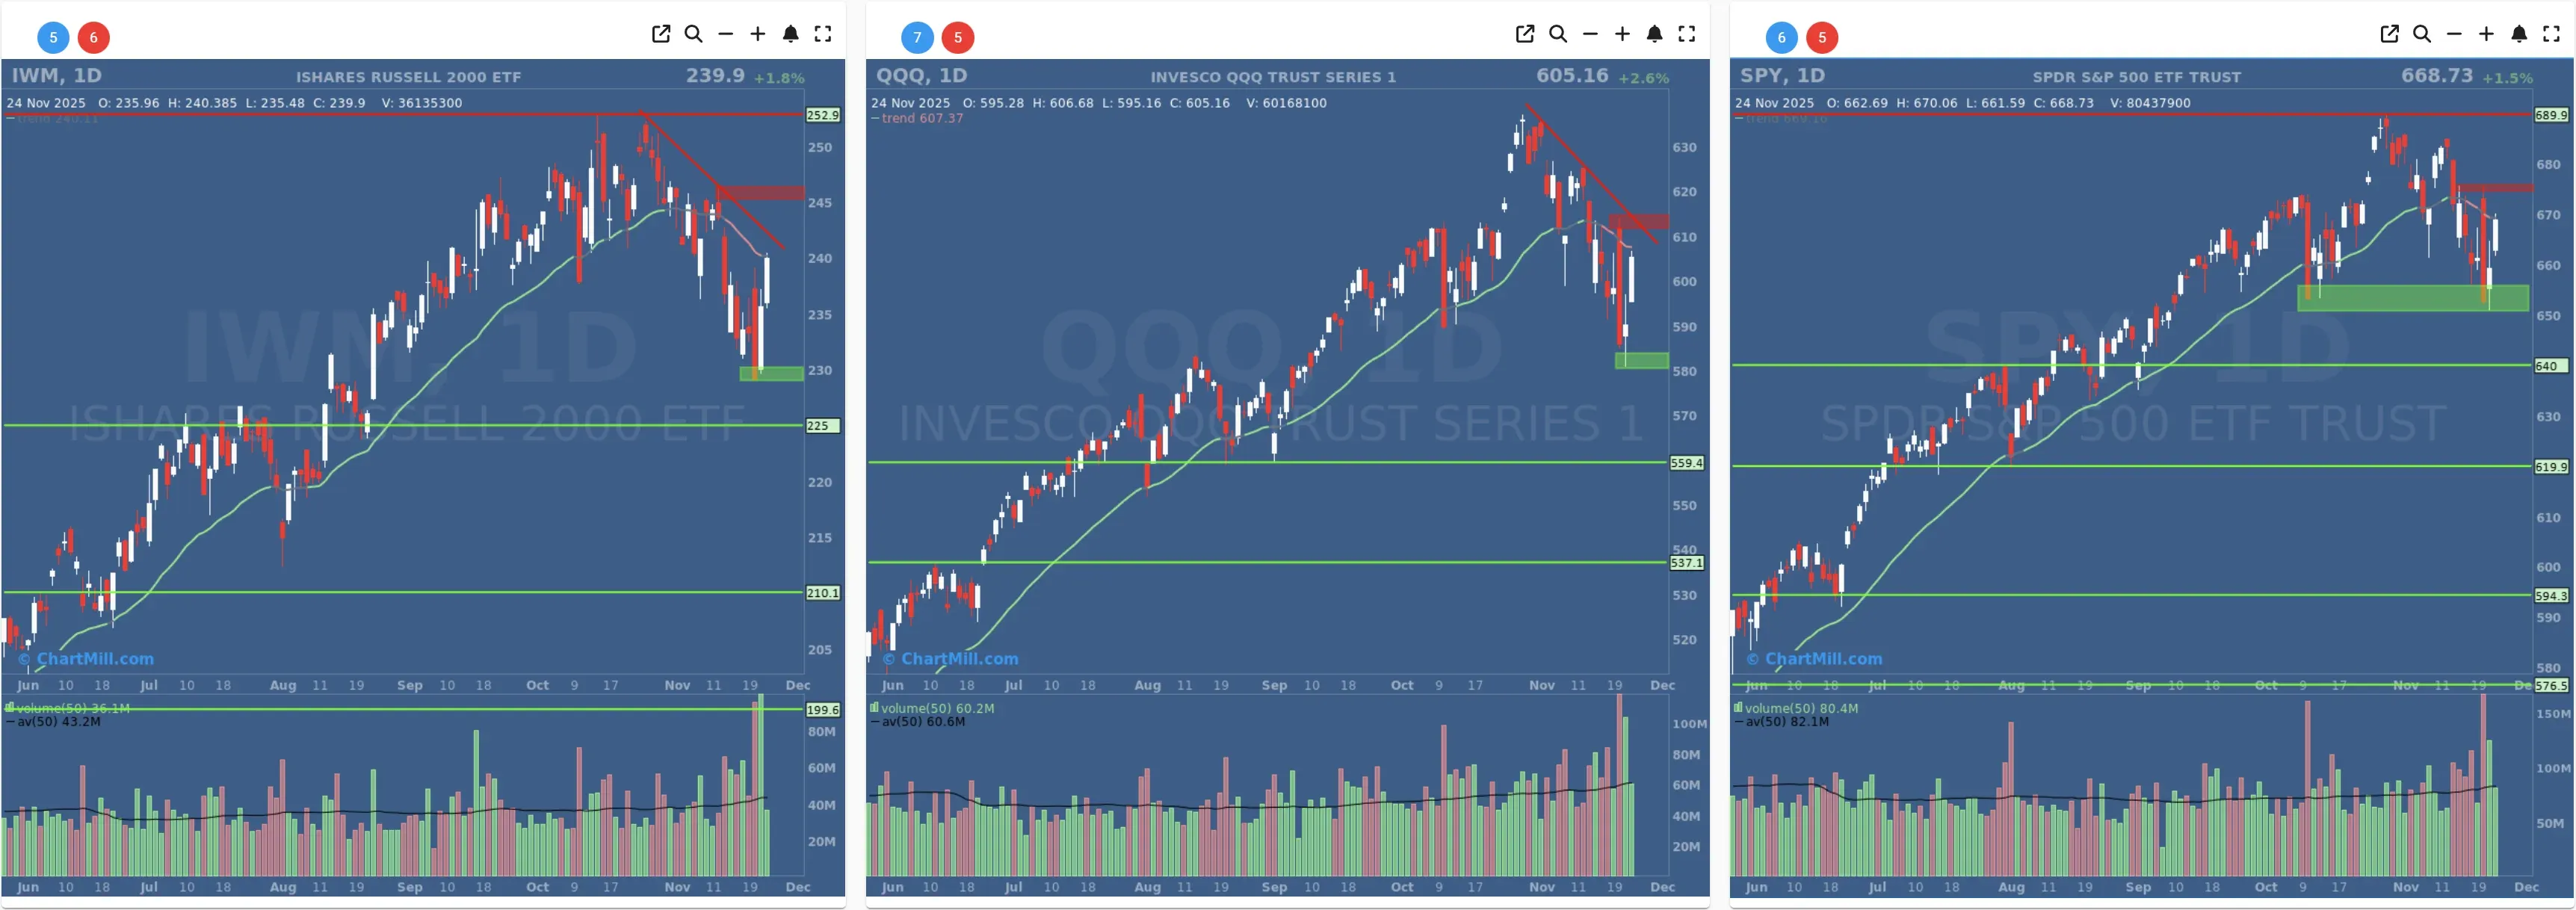
Despite the rally, all three indexes remain below short-term trendlines and are encountering overhead resistance, especially SPY and QQQ, which are approaching downtrend lines drawn from recent highs.
Short Term Trend
- Short-Term Trend: !!TREND CHANGE - NEUTRAL!! (from negative)
- Next Support at $650
- Next Resistance $667
- Volume: At Average (50)
- Pattern: Up Day - Gap Up - Strong Candle Close
- Short-Term Trend: Negative (no change)
- Next Support at $580
- Next Resistance $614
- Volume: At Average (50)
- Pattern: Up Day - Gap Up - Strong Candle Close
- Short-Term Trend: !!TREND CHANGE - NEUTRAL!! (from negative)
- Next Support at $229
- Next Resistance at $245
- Volume: Slightly Below Average (50)
- Pattern: Up Day - Strong Close
Long Term Trend
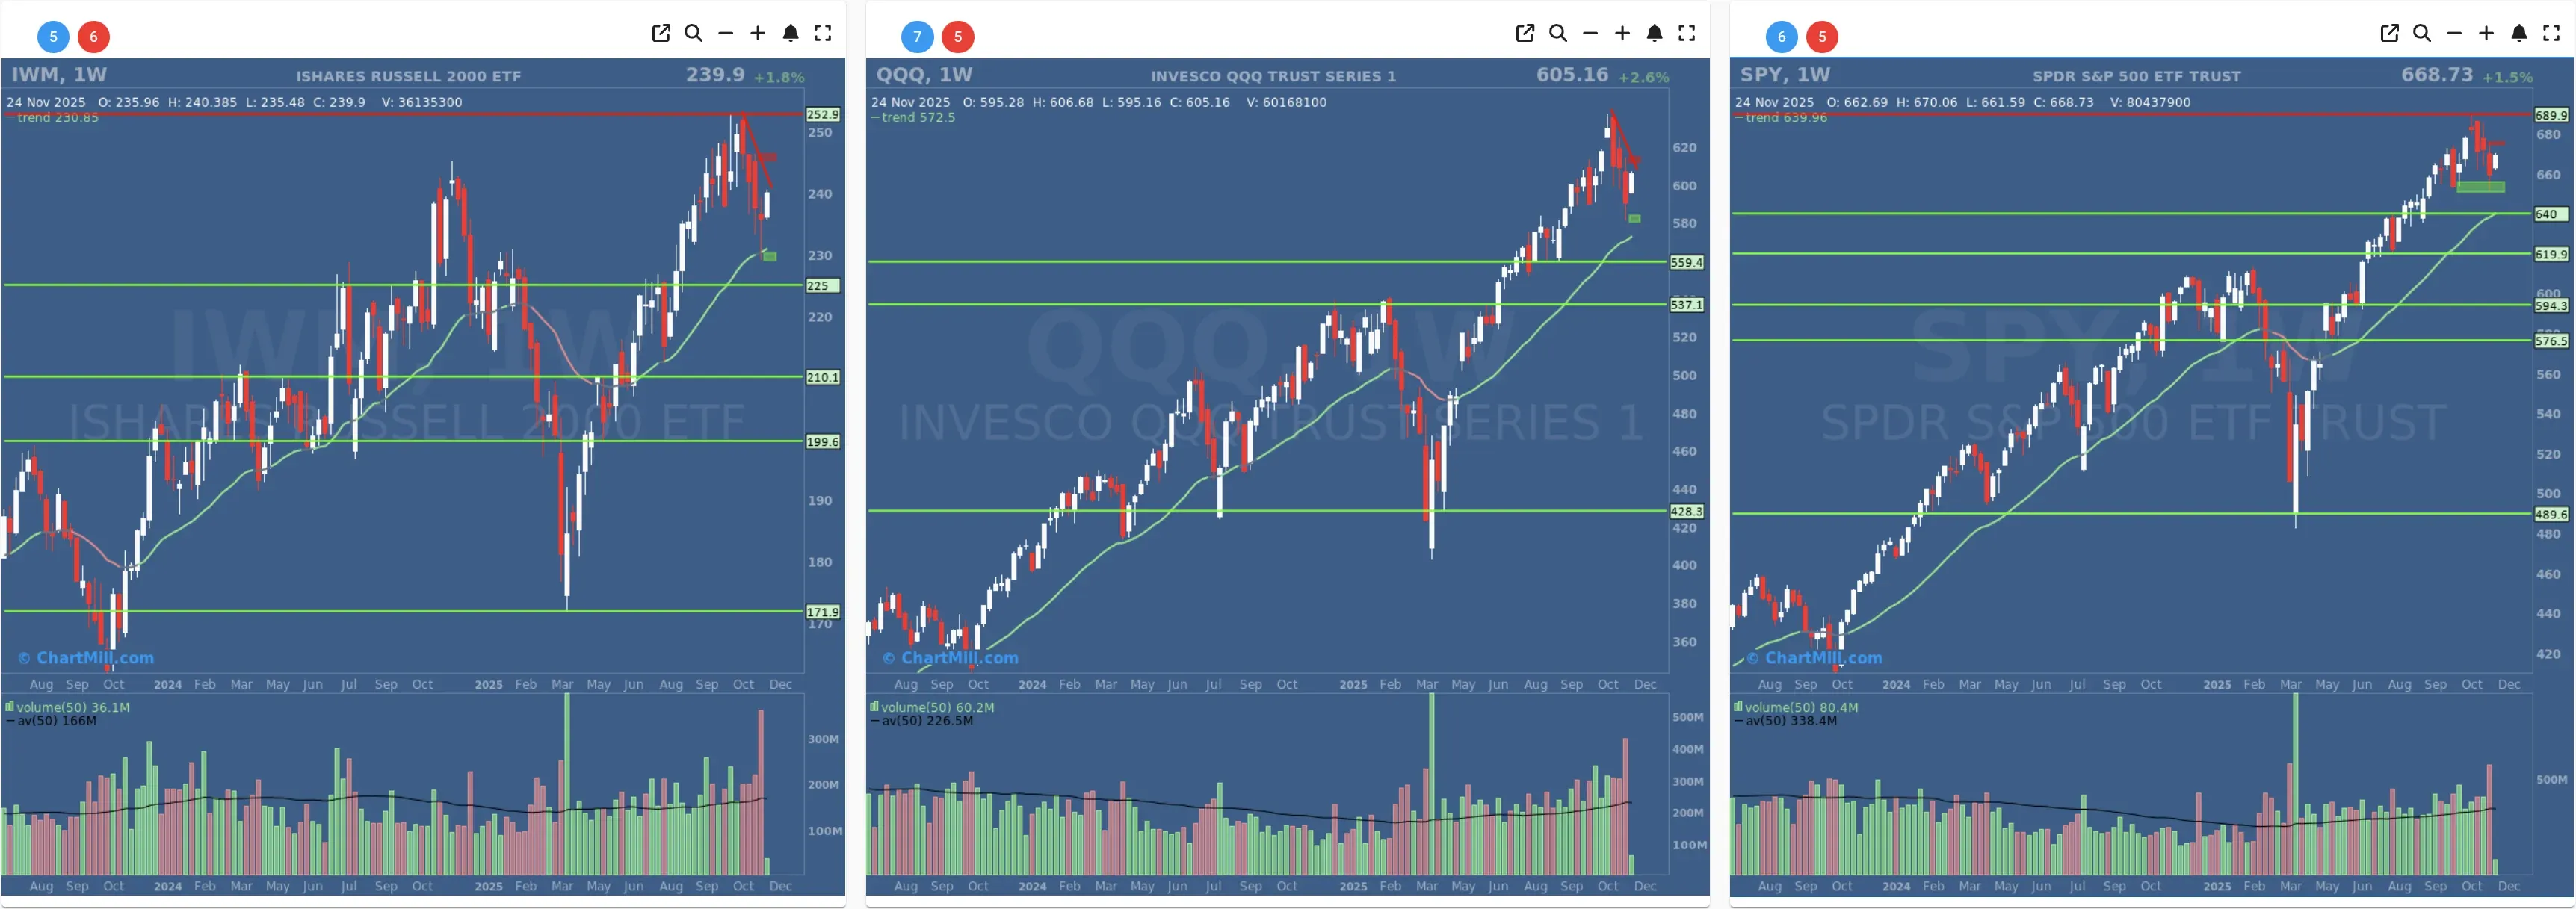
- Long-Term Trend: Positive (no change)
- Long-Term Trend: Positive (no change)
- Long-Term Trend: !!TREND CHANGE - POSITIVE!! (from neutral) - NOT CONFIRMED (intraweek close)
Daily Market Breadth Analysis – November 24, 2025 (After Market Close)
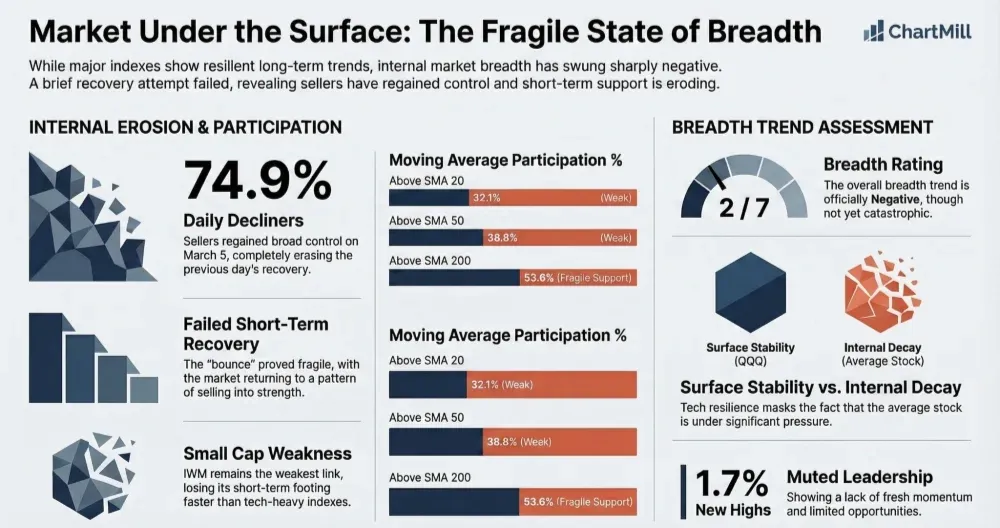
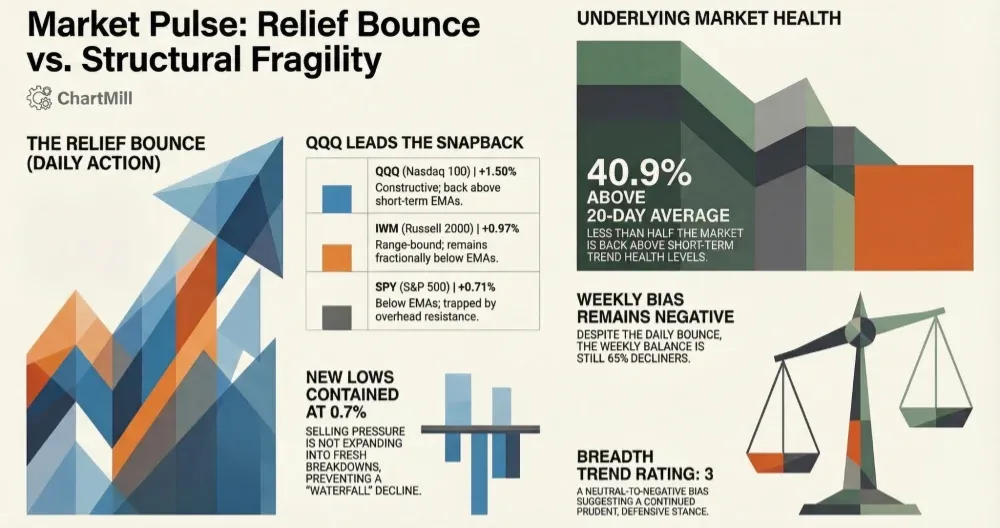
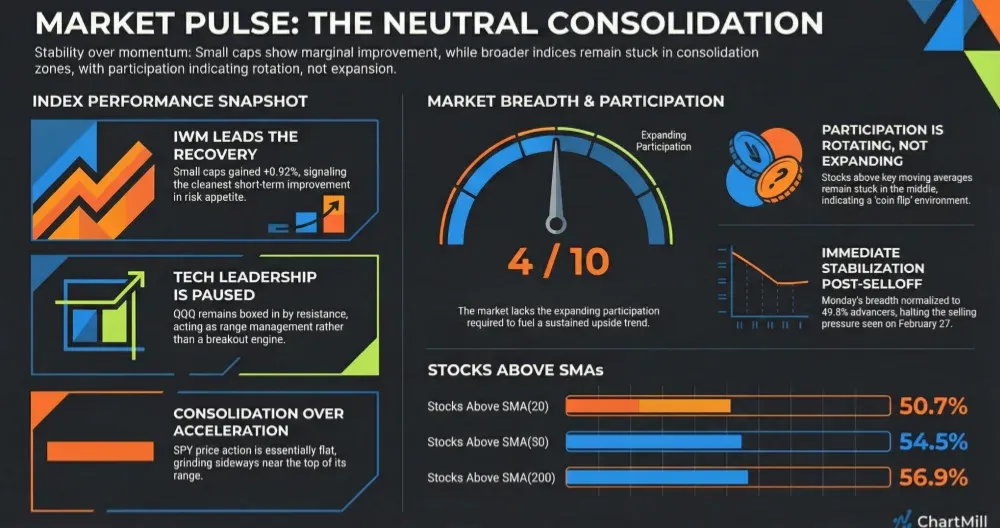
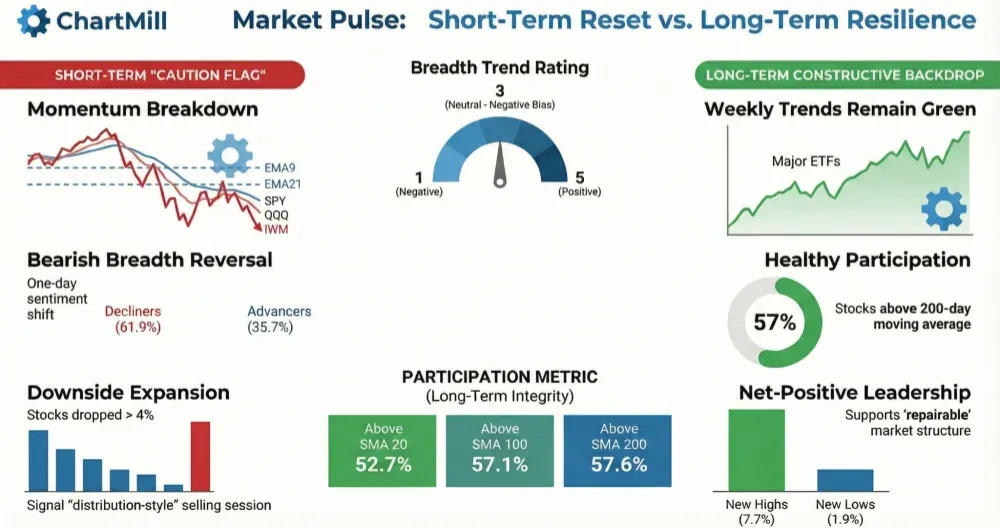
After last week’s sharp selloff, breadth metrics rebounded significantly across the board on Monday, Nov 24. While the short-term trend flipped positive and major indexes bounced off key support zones, broader participation remains uneven, with longer-term metrics still showing underlying weakness.

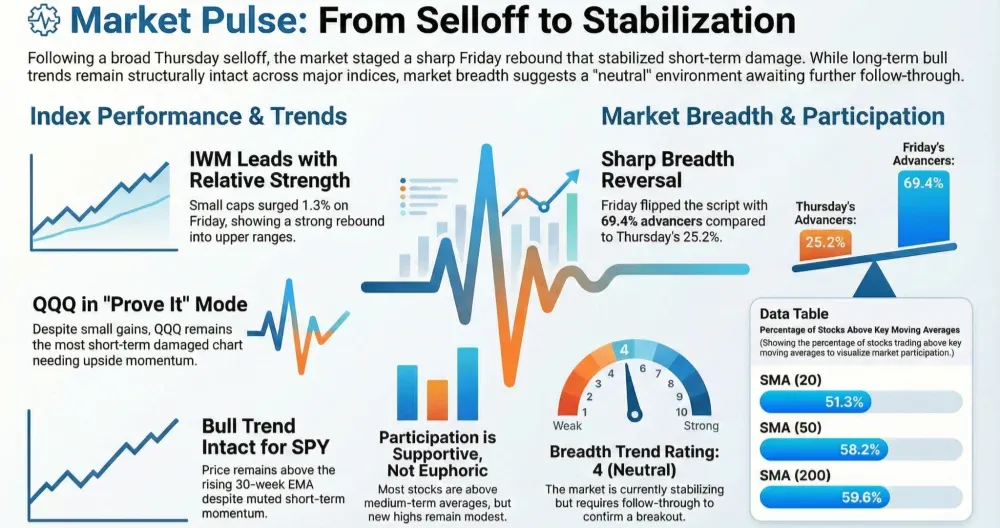
The market delivered a strong recovery on Monday, November 24, following Friday's bounce, with nearly 69% of stocks advancing versus just 28.4% declining.
This marked the second consecutive strong session and represents a continuation of the breadth recovery that began Friday (when 78% of stocks advanced). Notably, this two-day surge follows a severe deterioration in breadth through mid-to-late last week, which had dragged the short-term trend decisively negative.
The most notable improvements in the data include:
4% Day Advances climbed to 6.6%, a strong number not seen since November 11. This points to more intense buying pressure in a broader range of stocks.
The percentage of stocks above key SMAs (20d/50d/100d) saw a jump:
-
SMA(20)+: up to 39.1% from 32.4%
-
SMA(50)+: up to 35.6% from 30.3%
-
SMA(100)+: up to 46.6% from 42.7%
-
However, SMA(200)+ only nudged higher to 55.1%, signaling that longer-term participation still lags.
The weekly breadth also flipped sharply:
-
Adv Week: 58.3% (up from 32.9%)
-
Decl Week: dropped to 40.6% (from 66.3%)
Monthly breadth remains weak, with 73.2% of stocks still down over the past month—underscoring that this rebound is short-term in nature for now.
The new highs vs. new lows ratio improved slightly (2.3% NH vs 1.4% NL), but this is still low and not yet signaling a healthy leadership environment.
Price Action & Context (SPY, QQQ, IWM)
-
SPY bounced strongly off a key support zone near 650 and regained 668.73 (+1.5%), attempting to re-establish a higher low.
-
QQQ reclaimed the 600 level, gaining +2.6%, following a sharp flush on Friday that now appears to have found short-term capitulation.
-
IWM (Russell 2000) continued its rebound with a +1.8% gain, reclaiming the 240 zone after narrowly holding support near 230.
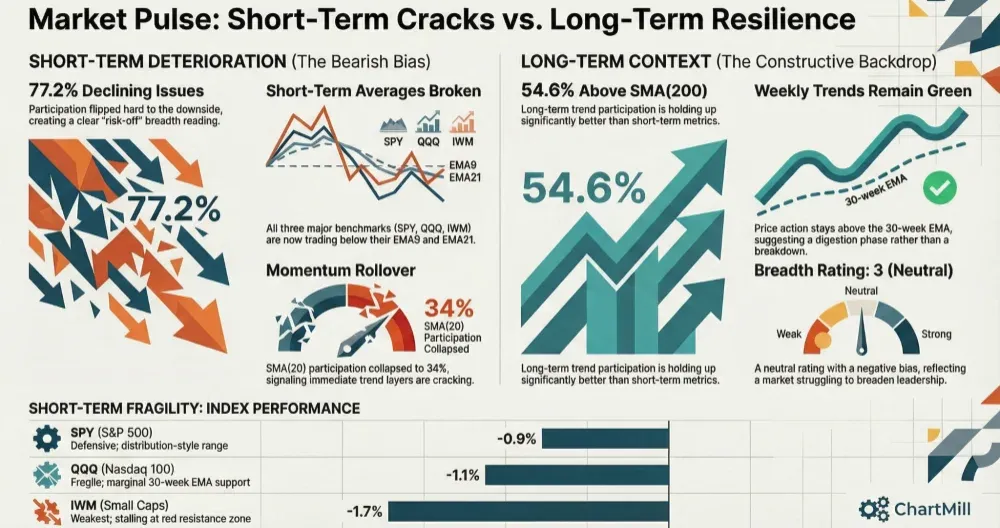
Despite the rally, all three indexes remain below short-term trendlines and are encountering overhead resistance, especially SPY and QQQ, which are approaching downtrend lines drawn from recent highs.
Comparative Context to Previous Breadth Update (Nov 21):
Friday’s reversal was already impressive, but Monday’s follow-through confirms a short-term bottom attempt. The percentage of stocks up >4% moved from 9.7% to 6.6% (slightly lower), indicating slightly fewer explosive movers but still healthy momentum.
The SMA(50)+ and SMA(100)+ metrics showed their first significant uptick in over a week—an encouraging sign.
However, medium- to long-term breadth remains notably damaged. The 3-month breadth stats (Adv: 9.2%, Decl: 11.2%) are barely improved, and the percentage of stocks above their 200-day moving average hasn't broken out of its stagnation zone (~50–55%) since mid-November.
Conclusion and Trend Score
The data confirms a strong short-term recovery, supported by broad participation and a reversal off technical support. However, longer-term breadth metrics remain fragile, suggesting this is a bounce within a broader correction phase, not yet a confirmed trend reversal.
Breadth Trend Rating: Neutral with a positive bias

If the coming sessions can build on this strength and push more stocks above their 50- and 100-day SMAs - especially if we see improving 3-month breadth and leadership expansion via NH/NL - the case for a sustained uptrend will strengthen.
Kristoff - ChartMill
Next to read: AI Roars Back as Wall Street Eyes December Rate Cut